Zero Waste to Residuals
|
|
|
- Chester Short
- 5 years ago
- Views:
Transcription
1 RDN Solid Waste Management System Overview: Zero Waste to Residuals Regional Solid Waste Advisory Committee May 16, 2013
2 Presentation Outline 1. RDN System Background System Characteristics System Cost 2. Zero Waste Plan Performance Objectives Performance 3. Residual Waste Management Plan Performance Objectives Performance 4. Issues and Opportunities
3 RDN Solid Waste Management System BACKGROUND


4 System Characteristics SF Residential MF Residential ICI DLC Municipal Self-Haul Private Source Collection Landfill Recycling MRF Composting WTE Pulp Mills Disposal or Diversion Facilities Transfer Facilities Public Private 170,000 tpy


5 RDN Solid Waste Management System Single Family Multi- Family DLC ICI Municipal Collection Self Haul Private Collection Public Transfer Facilities Private Transfer Facilities Landfill Recycling Facilities Compost Facilities WTE Pulp Mills


6 Waste Source (Generators) 21% 25% 6% 170,000 tpy Single Family Multi- Family ICI DLC 48%


7 Waste Collection 21% 16% 170,000 tpy Private Muncipal Self-Haul 63%


8 Waste Transfer Facilities 170,000 tpy 49% 51% Private Public

9 Recycling Infrastructure in RDN
10 Waste Transfer Facilities Public Private Church Road Transfer Station Regional Landfill Porter Wood Recycling Parksville Bottle & Recycling Depot BFI Springhill Alpine Disposal & Recycling Pacific Coast Waste Management DBL Disposal Nanaimo Recycling Exchange GIRO


11 Disposal & Diversion Facilities 12% 18% 36% 170,000 tpy Landfill Recycling Facilities Compost Facilities WTE Pulp Mills 34%
12 Disposal & Diversion Facilities Disposal Diversion Regional Landfill Schnitzer Steel BFI Tenth Street Emterra Environmental Cascades Recovery ICC Group Earthbank Harmac/Catalyst
13 System Cost-Public Disposal Service Area Budget Residential Collection RDN Curbside Collection $3,775,651 CON Curbside Collection $3,769,634 TQB Garbage Collection $173,859 Sub-Total $7,719,144 Region-Wide Disposal Overhead & Administration $1,162,920 Zero Waste Programs $514,394 Scale & Transfer Services Cedar $1,507,215 Scale & Transfer Services - CRTS $2,008,190 Disposal Operations $4,387,105 Sub-Total $9,579,824 Total $17,298,968
14 System Revenues Revenue Source Amount Percentage Tax Requisition $342,035 2% Tipping Fees $9,237,789 53% Utility Fee $7,719,144 47% Total $17,298,968
15 RDN Zero Waste Plan PERFORMANCE OBJECTIVES
16 Disposal Crisis
17 Solid Waste Management Plan Mandated by Province (EMA) RDN SWMP Prepared 1988 Amended R s Plan Amended 2004 Zero Waste Plan (75%) Demand Management WSML Bylaw Residual Waste Management Plan Disposal infrastructure - supply


18 1995 3RS Plan 50% 60% 77% Phase 1 Residential/ICI Recycling; Disposal Bans Phase 2 Construction/Demolition Waste Bans Phase 3 Regional Compost Facility; ICI/Residential Collection


19 2004 Zero Waste Plan continuously strive to reduce the amount of waste requiring disposal. WSML Disposal Bans SF Organics Collection Private Sector Level Playing Field Commercial Organics C/D Waste Pilot Study Full Scale
20 2004 Waste Composition Small Appliances 2% Glass 2% Beverage Containers Carpet & Underlay 1% Mattresses 1% 1% HHW 1% Other 1% Fines 1% Electronics 0.4% Rubber / Tires 0.2% Bulky Goods 2% Food Waste 31% Diapers / Personal Hygiene 3% Metal 5% Textiles 6% Paper 8% Yard Waste 7% Compostable Paper 4% C&D 11% Plastic 12%
21 RDN Zero Waste Program Waste Stream Management Licensing Private sector infrastructure Level playing field Landfill Disposal Bans Regulate Collaborate Educate Enforce Single Family Food Waste Collection User fees Can limits Zero Waste Education & Promotion


22 WSML Bylaw Environmental protection Encourage private sector investment High standards in the operation of recycling facilities Common regulatory framework Illegal dumping prevention
 Garden waste (2007) Wood Waste (2007) Stewardship Materials (2007) Household Plastic Containers (2009) Metal Food & Beverage Containers")
23 Landfill Disposal Bans Gypsum (1991) Land clearing waste (1992) Corrugated cardboard (1993) Recyclable Paper (1997) Scrap Metal (1997) Tires (1997) Commercial organic waste (2005) Garden waste (2007) Wood Waste (2007) Stewardship Materials (2007) Household Plastic Containers (2009) Metal Food & Beverage Containers (2009)


24 Bans Collaborate & Educate Collaborate with haulers Regular meetings Build trust Educate generators Create data base Workshops Promotion/education materials Follow-up

25 Load inspection Violation notices Issue to Hauler 3x tipping fee Enforcement Zero Waste Compliance Officer Collaborate with hauler to educate generator Site visits Monitor violations


26 User Pay Garbage Collection Full user-pay Utility bill $147.50/yr Food waste weekly Garbage & recycling alternating bi-weekly Tags for extra garbage- $2.00 per can

27 Illegal Dumping Observe, record, report Investigate complaints Identify responsible party Responsible for clean-up Contractor clean up for sites with no identification Signage posted
28 RDN Zero Waste Plan PERFORMANCE
29 2012 Disposal & Diversion Waste Stream Landfill Quantity (tonnes) Disposal Rate (kg/c/yr) 350 Data Source 53,000 Scale Records Diversion Recycling 78,156 WSML Reports Organics (FW + YW) 21,145 Scale Records EPR Programs 9,552 Stewards Reports Backyard Composting 4,000 Estimate (250 kg x 16,000) Total Diversion 112,850 Tonnes Generated 166,000 Diversion Rate 68%

30 Annual Disposal Rate 548 kg kg

31 RDN Tipping Fees $120 $120 $100 $80 $60 $50 $40 $20 $0


32 RDN Waste Generation % Diversion Disposal

33 Disposal Rate Comparison kg 641 kg kg 378 kg 0 Canada BC RDN Nova Scotia Statistics Canada 2008

34 Disposal Rate Comparison BC kg 699 kg 655 kg 590 kg 479 kg 459 kg 417 kg BC Ministry of Environment 2010
35 RDN Residual Waste Management Plan PERFORMANCE OBJECTIVES
36 Residual Waste Management Plan (1) Continued use of CRTS Export CRTS waste to Cache Creek Review alternative waste export options 2006 Continued use of Regional Landfill Optimize capacity by constructing geogrid toe berm on south side of landfill Extend landfill lifespan by 7 to 10 years (2012) Closure & Maintenance Post-Closure Planning
37 Residual Waste Management Plan (2) Household Hazardous Waste Promote existing Provincial and private stewardship programs for hazardous waste Encourage new stewardship programs Land clearing Waste Discontinuation of stump burn site on Doumont Road
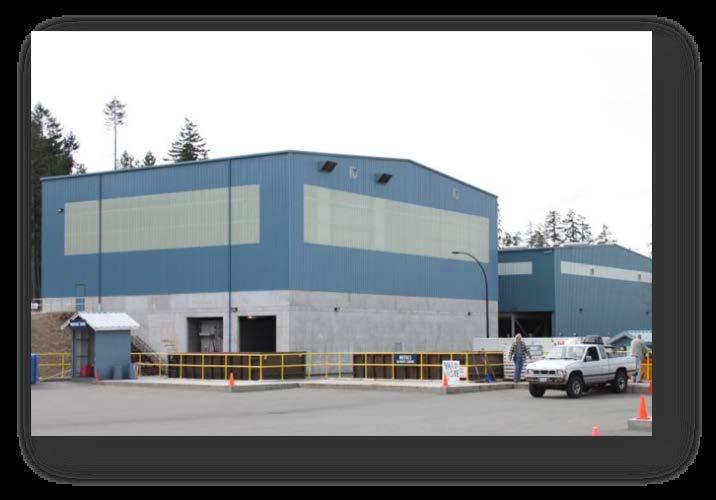
38 Residual Waste Management Plan (3) Secure a suitable transfer station/processing site Review new & emerging technologies Discuss cooperative strategies Reconsider disposal options by December 2006 Phase 2 Berm construction in 2014 if required
 No discharge on closed landfill (Cell")
39 Operational Certificate (1) Issued April 2004 Waste discharge to engineered landfill (Cell One) No discharge on closed landfill (Cell Two)
40 Operational Certificate (2) Plans required Design & Operations Leachate management Storm water management Landfill gas management Closure Post-closure Annual monitoring program
41 RDN Residual Waste Management Plan PERFORMANCE


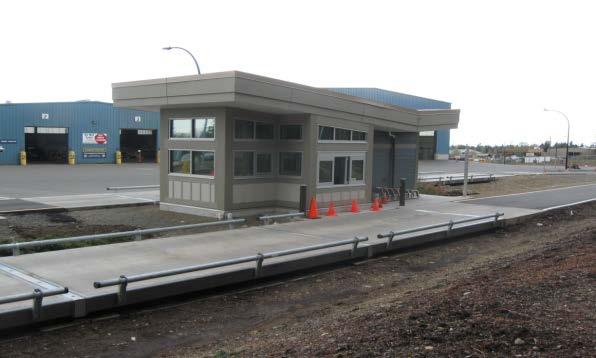
42 Church Road Transfer Station


43 New Construction


44 Green Features (1)


45 Green Features (2)

46 Regional Landfill
47 Design & Operations Plan DEVELOPMENT HISTORY POST-CLOSURE PLAN EXISTING INFRASTRUCTURE & CLOSURE PLAN (NATURE PARK) HYDROGEOLOGY SITE PERFORMANCE D&O PLAN SITE DEVELOPMENT & REMEDIAL ACTION PLAN
 NATURAL ATTENUATION CELL 1946 - Filling operations commence at the site.")
48 Site History Summary CELL ONE (8.6 Ha) NATURAL ATTENUATION CELL Filling operations commence at the site The RDN is formed RDN takes over the legal function of municipal waste disposal.

49 Regional Landfill September 2009

50 Public Park Concept Phase 1

51 Public Park Concept Final Closure

52 Sandstone Master Plan

53 Sandstone Eco-Industrial Park

54 Hydro Geological Study Undertaken in 2006 in support of the post-closure implementation plan. Three windows for potential shallow leachate migration identified. Trough #1 Trough #2 Trough #3
55 Design & Operations Plan Objectives Provide a long-term development plan for the site which addresses known issues. Identify and quantify key capital projects. Integrate existing environmental management systems. Update environmental controls.

56 Key Issues Identified in Cell One Excessive differential settlement in Cell One Leachate mounding LFG collection system blinded SETTLEMENT
57 D & O Plan Overview Address the above stated issues and substantially reduce leachate impacts to the environment (Remedial Action Plan). Provide an additional 1.4 million cubic metres of airspace for a net total available airspace of 2.4 million cubic metres. Integrate the public park concept into the final closure plan. Update the environmental monitoring program. Optimize LFG collection.


58 Capital Infrastructure Projects Cell One Remediation Southwest Berm Extension North Berm Extension Southeast Berm Extension
. Per tonne capital cost of approx.")
59 Final Closure Total capital cost estimate of $37 million (including final closure and public park). Per tonne capital cost of approx. $22 per tonne of waste landfilled.
60 LEACHATE GENERATION 140, , ,000 Total Leachate Generation Leachate to Environment Leachate to Sanitary m 3 /yr 80,000 60,000 40,000 20,000 0 Existing Conditions Interim Fill Plan Southwest Berm Extension Stage One Closure North Berm Construction Stage Two Closure Southeast Berm Extension Stage Three Closure Stage Four Closure Stage Five Closure Final Closure
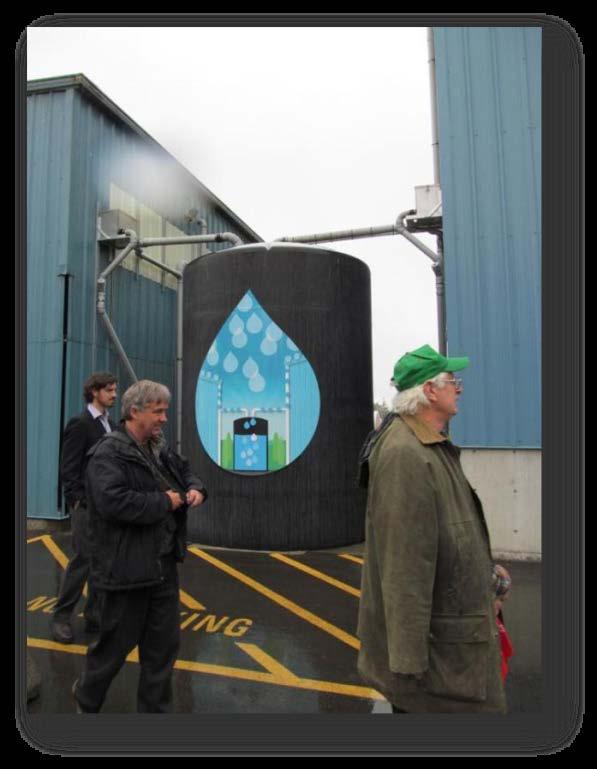
61 Summary Additional 1.4 million cubic metres airspace Site life extended from 2021 to 2026 Significantly reduced environmental impacts: Leachate generation LFG fugitive emissions Storm water management Integration with Sandstone Master Plan Nature Park Eco-Industrial Park Optimize LFG collection Required SWMP Amendment

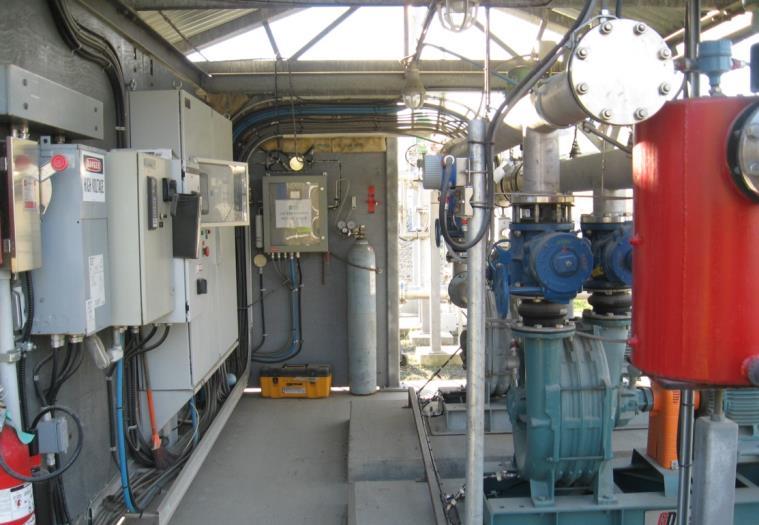
62 Landfill Environmental Controls Leachate Management 4.4 km buried collection system 1.9 km sanitary line 2 lift stations with chemical addition 13 h. closure Storm Water Management Storm water diversion system Ground/Surface Water Monitoring 10 surface water sampling stations 20 ground water stations with 38 wells 2 leachate sampling stations

63 Landfill Gas System

64 Current LFG Collection System Hybrid collection system concept. 7 horizontal trenches. 37 vertical collection wells 4 Manifold Stations 36% collection efficiency (calculated)


65 Vertical LFG Extraction Wells


66 LFG Manifold Station

67 LFG Control Plant
68 GHG Emissions Reduction Year Methane Emission Rate (tonnes/yr) Methane Destruction Rate (tonnes/yr) Efficiency , % ,091 1,029 33% ,133 1,220 40% ,281 1,011 31% ,448 1,376 40% ,549 1,060 30% ,624 1,131 31% ,704 1,338 36% ,789 1,365 36%

69 Gas Utilization Facility Phase 1 RFP December 2004 Cedar Road LFG 2005 Demonstration project Detailed legal agreements Cost borne by developer Royalty to RDN Phase 1 Project MW $3.6 Million 2 GE Jenbacher engines BC Hydro EPA


70 BCBN Collaboration RDN CRB BCBN Nanaimo Bioenergy Centre


71 Gas Utilization Facility Phase $2.3 million Improve efficiency and economics by: LFG storage Battery electricity storage Above grade geothermal LFG cleaning and processing Waste heat recovery system Gas processing and compression plant

72 Methane Gas Holder
73 RDN Solid Waste Management System ISSUES & OPPORTUNITIES


74 Waste Composition HHW 1% Household Hygiene 3% Other 7 % Paper 8% Household Hygiene 7% Other 3% Electronics 1% CD 11% Plastic 12% HHW 3% Electronics 3% Paper 12% Glass 2% CD 11% Plastic 14% Metals 6% Glass 3% Metals 2% Textiles 6% Beverage Containers 1% 2004 Compostable Organics Beverage 42% Containers Textiles 6% 2% 2012 Compostable Organics 35%


75 350 Kg Per Capita Disposal Rate 75 kg 21% Residential ICI 225 kg 79%
 BC Recycling Regulation Printed Paper & Packaging")
76 To 75% and Beyond! Extended Producer Responsibility (EPR) BC Recycling Regulation Printed Paper & Packaging - MMBC CCME Action Plan for EPR CD materials Furniture Textiles & carpet
77 To 25% or Less! Waste to Energy Counts as recovery if 60% energy recovery Metro Vancouver Zero Waste Plan In-region WTE Out-of Region WTE RDN WTE

78 Questions