Background. Much of the CA is directly underlain by the Walloon Coal Measures (WCM) which are the target of proposed coalbed methane (CBM) development
|
|
|
- Stephany Peters
- 5 years ago
- Views:
Transcription


 Sanjeev")
1 WaterTech 2016 Banff, Canada April 8, 2016 A Multi-Disciplinary Assessment of Hydrogeological Connectivity between Coal Measures and an Overlying Water Supply Aquifer, and Potential Impacts of Coalbed Methane Development in Queensland, Australia Josh Moncrieff (KCB) Stephen Denner, Simon Gossmann (Arrow Energy) Dhananjay Singh, Mark Gallagher, Randall Cox (OGIA) Sanjeev Pandey, Chris Dickinson (KCB)
 from 3500 water wells")

2 Background Condamine Alluvium (CA) covers an area of 7000 km 2 in Queensland, Australia s Surat Basin CA has been extensively developed for irrigation water supply since 1960 Current groundwater use in central CA is ~60 GL/yr (1900 L/s) from 3500 water wells Much of the CA is directly underlain by the Walloon Coal Measures (WCM) which are the target of proposed coalbed methane (CBM) development CBM development in Surat Basin will entail pumping of ~70 GL/yr from coal seams through Impacts on CA groundwater are uncertain.

, covering the Surat Cumulative")
 in cooperation with CBM companies (Arrow Energy and others) Academia (University of")
3 Project Objective Improve understanding of the potential hydraulic connectivity between the CA and WCM leading to. Improve assessment of the potential impacts of CBM development (ie. water extraction) on CA in support of. Updates to the Underground Water Impact Report (UWIR), covering the Surat Cumulative Management Area (including the CA) led by Queensland Office of Groundwater Impact Assessment (OGIA) in cooperation with CBM companies (Arrow Energy and others) Academia (University of Queensland and others) Consultants (Klohn Crippen Berger and others)
4 Project Approach Multiple lines of investigation using pre-existing and new data sets Regional scale Geological interpretation and modelling Hydrochemistry analysis Groundwater level mapping Local scale Drilling, coring and geophysical logging Aquifer test pumping Direct measures of CA/WCM connectivity Geological interpretation/modelling Drilling and test pumping Indirect measures of CA/WCM connectivity Hydrochemistry analysis Groundwater level mapping
: A zone")

5 Regional Setting and CA/WCM Contact Zone Volcanics Condamine Alluvium Walloon Coal Measures CA/WCM Transition Zone (TZ): A zone of undifferentiated clay comprising: basal CA clay; and/or a product of weathered WCM; or Considered to be a distinct hydrostratigraphic unit


 for any loss or")
6 Geological Interpretation and Modelling Produced by: Objective: Interpret and map the Transition Zone Iterative interpretation of 1000s of water well logs using Rockworks, many of which were completed by drillers and are poor quality Airborne geophysics considered for mapping the TZ but determined not to be a useful tool due to lack of conductivity contrast Chinchilla Kingaroy Weipa Townsville Longreach Charleville 152 LOCALITY BRISBANE Dalby Tara Oakey Cecil Plains Toowoomba Condamine River Drainage, coastline and town data supplied courtesy of Geoscience Australia Canberra, ACT Disclaimer: While every care is taken to ensure the accuracy of this product, the Office of Groundwater Impact Assessment makes no representations or warranties of any kind, express or implied about its accuracy, reliability, completeness or suitability for any purpose and disclaims all responsibility and all liability (including without limitation, liability in negligence) for any loss or damage (including indirect or consequential loss or damage) which you might incur arising out of, or in connection with, the use of this product Kilometres Datum: Geocentric Datum of Australia /11/2014 Figure 1-1 Original Plan Size: A4 Office of Groundwater Impact Assessment Department of Natural Resources and Mines The State of Queensland 2014 Study Area Condamine Connectivity Research Project Surat Cumulative Management Area Main Highways Rivers Condamine Alluvium Extent Central Condamine Alluvium Extent Document Path: G:\QWC\CoalSeamGas\A_Business Reporting\A_Surat UWIR Report 2015\Report 7 Condamine Connectivity\KeyResultsTable&MXD\MXD\Fig1-1_Study_Area.mxd Warwick 152
 TZ Thickness Weipa")


 for any")
 which you might")
7 Geological Interpretation and Modelling Surat Basin Contact (WCM & SB Sst) TZ Thickness Weipa LOCALITY Townsville Longreach Charleville BRISBANE Chinchilla Dalby Tara Oakey Cecil Plains Condamine River 3D surface -28 Drainage, coastline and town data supplied courtesy -2 of Geoscience Australia Canberra, ACT Disclaimer: While every care is taken to ensure the accuracy of this product, the Office of Groundwater Impact Assessment makes no representations or warranties of any kind, express or implied about its accuracy, reliability, completeness or suitability for any purpose and disclaims all responsibility and all liability (including without limitation, liability in negligence) for any loss or damage (including indirect or consequential loss or damage) which you might incur arising out of, or in connection with, the use of this product.

 and K-means Cluster Analysis (KCA) CA (TDS mg/l) 6 clusters identified representing evolution in water")
8 Hydrochemistry Analysis Objective: Assess the extent of historic mixing of water between the CA and WCM using groundwater chemistry data Involved characterisation of existing groundwater quality data from nearly 2500 measurements Traditional methods such as analysis of individual parameters, major ions or Piper plots were not useful WCM (TDS mg/l) Instead used Principal Component Analysis (PCA) and K-means Cluster Analysis (KCA) CA (TDS mg/l) 6 clusters identified representing evolution in water chemistry
9 Hydrochemistry Analysis Similar Total Dissolved Solids (TDS) but different Sodium Adsorption Ratio (SAR) values for CA and WCM PCA indicates individual loading of variables is different for the CA and WCM Higher levels of Ca 2+ and Mg 2+ in the CA compared to WCM Ca 2+ and Mg 2+ to Cl - ratios show different signatures between CA and WCM In general the hydrochemistry assessment does not indicate significant mixing of water between the CA and WCM

10 Groundwater Level Mapping Objective: Map relative differences in hydraulic heads between the CA and WCM CA groundwater levels have dropped by over 30 m in some areas since 1960s Very limited WCM groundwater levels data Historic CA Groundwater Levels


")


 which you might incur arising out of, or in connection with, the use of this product.")
11 Groundwater Level Mapping 350 Groundwater levels data are available from 1000s of CA wells and dozens of reported WCM wells; much data can be unreliable Head difference Weipa Chinchilla Townsville Kingaroy LOCALITY Condamine Alluvium 300 Dalby 300 Weipa Townsville Longreach Charleville LOCALITY Kingaroy BRISBANE Longreach Water levels measured at 86 wells, and supplemented using existing data from a selection of high confidence wells Chinchilla Charleville BRISBANE Cecil Plains Condamin e 350 River Oakey Upwards hydraulic gradients of close to 20 m from WCM to CA in areas of large CA level depression Cecil Plains Dalby Con damine River Drainage, coastline and town data supplied courtesy of Geoscience Australia Canberra, ACT Weipa LOCALITY Disclaimer: While every care is taken to ensure the accuracy of this product, the Office of Groundwater Impact Assessment makes no representations or warranties of any kind, express or implied about its accuracy, reliability, completeness or suitability for any purpose and disclaims all responsibility and all liability (including without limitation, liability in negligence) Kingaroyfor any loss or damage (including indirect or consequential loss or damage) which you might incur arising out of, or in connection with, the use of this product. Figure 7-3 Walloon Coal Measures CA Groundwater Levels 300 Townsville Longreach Condamine Connectivity Research Project Charleville Surat Cumulative CA Monitoring Bores Kilometres Management Area Groundwater Contours - 5m Datum: Geocentric Datum of Australia 1994 Chinchilla Main Highways Original Plan Size: A4 Groundwater Contours - 25m Rivers 12/11/2014 Produced by: Office of Groundwater Impact Assessment Condamine Alluvium Extent Department of Natural Resources and Mines Oakey The State of Queensland 2014 Document Path: G:\QWC\CoalSeamGas\A_Business Reporting\A_Surat UWIR Report 2015\Report 7 Condamine Connectivity\KeyResultsTable&MXD\MXD\Fig7-3_CA_Groundwater_Levels.mxd BRISBANE Results indicate that there is a significant impediment to flow between CA and WCM upwards downwards Drainage, coastline and town data supplied courtesy of Geoscience Australia Canberra, ACT Tara 325 Cecil Plains Dalby Oakey Disclaimer: While every care is taken to ensure the accuracy of this product, the Office of Groundwater Impact Assessment makes no representations or warranties of any kind, express or implied about its accuracy, reliability, completeness or suitability for any purpose and disclaims all responsibility and all liability (including without limitation, liability in negligence) for any loss or damage (including indirect or consequential loss or damage) which you might incur arising out of, or in connection with, the use of this product. CA to WCM Water Level Difference Figure 7-5 Condamine Connectivity Research Project Surat Cumulative CA to WCM Water Level Difference Kilometres Management Area Datum: Geocentric Datum of Australia 1994 Main Highways Original Plan Size: A Rivers 12/11/2014 Produced by: Drainage, coastline and town data supplied courtesy Office of Groundwater Impact Assessment WCM Monitoring Bores of Geoscience Australia Canberra, ACT Department of Natural Resources and Mines Condamine Alluvium Extent The State of Queensland Disclaimer: While every care is taken to ensure the accuracy of this product, the Office of Groundwater Impact Assessment makes no representations or warranties of any kind, express or implied about its accuracy, reliability, completeness or suitability for any purpose and disclaims all responsibility and all liability (including without limitation, liability in negligence) for any Document Path: G:\QWC\CoalSeamGas\A_Business Reporting\A_Surat UWIR Report 2015\Report 7 Condamine Connectivity\KeyResultsTable&MXD\MXD\Fig7-5_CAtoWCM_Water_Level_Difference.mxd loss or damage (including indirect or consequential loss or damage) which you might incur arising out of, or in connection with, the use of this product. Figure Kilometres Datum: Geocentric Datum of Australia 1994 Original Plan Size: A4 WCM Groundwater Levels Surat Cumulative Management Area CONTOUR 375 Condamine Connectivity Research Project WCM Monitoring Bores <all other values> Condamine River -28

 Dalby Condamine River Weipa Kingaroy LOCALITY")


 for any loss or damage (including indirect or consequential loss or damage)")

12 Drilling and Test Pumping Objective: Test representative sites and estimate vertical hydraulic conductivity (K v ) between CA and WCM Drilling, coring and testing of two sets of >4 nested wells at Daleglade and Cecil Plains At each location, step test performed followed by 30- to 40-day constant rate test and recovery Multiple interpretation methods Chinchilla Daleglade ^_ ^_ Stratheden (Dalby) Dalby Condamine River Weipa Kingaroy LOCALITY Townsville Longreach Charleville BRISBANE Oakey Cecil Plains Cecil Plains ^_ Drainage, coastline and town data supplied courtesy of Geoscience Australia Canberra, ACT Disclaimer: While every care is taken to ensure the accuracy of this product, the Office of Groundwater Impact Assessment makes no representations or warranties of any kind, express or implied about its accuracy, reliability, completeness or suitability for any purpose and disclaims all responsibility and all liability (including without limitation, liability in negligence) for any loss or damage (including indirect or consequential loss or damage) which you might incur arising out of, or in connection with, the use of this product Figure 8-1 Kilometres Datum: Geocentric Datum of Australia 1994 Original Plan Size: A4 Pumping Test Site Locations Condamine Connectivity Research Project Surat Cumulative Management Area Main Highways Rivers

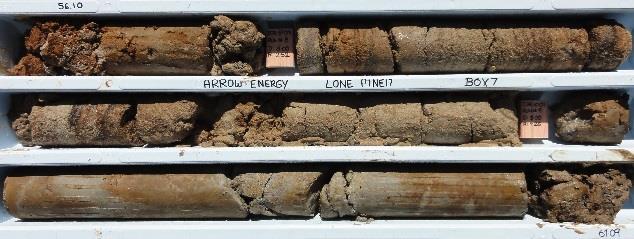

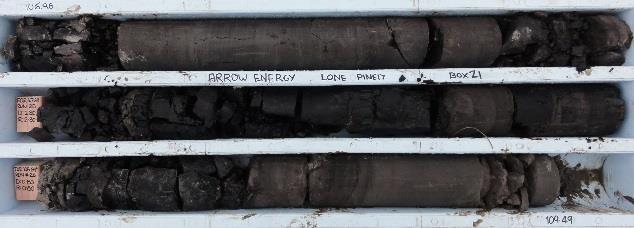

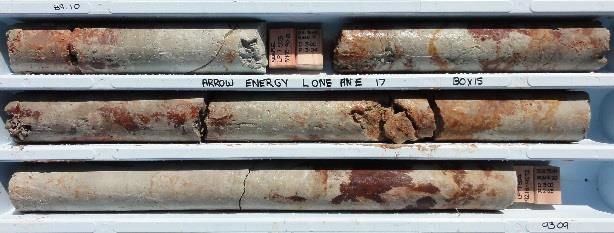
13 Cecil Plains Core and Geophysics 56 to 61 m 73 to 77 m 83 to 86 m 89 to 93 m 96 to 98 m

14 Cecil Plains Hydrogeology and Drawdown Prior to CRT, CA SWL between 314 m and 318 m; WCM SWL between 327 m and 335 m; upwards hydraulic gradient from WCM to CA Pumping well drawdown 17.3 m CA drawdown m offset CA screen 1980 m offset 0.7 m drawdown CA screen 36 m offset 11.8 m drawdown Upper WCM screen 26 m offset 0.1 m drawdown Pumping Well CA screen 17.3 m drawdown CA screen 1280 m offset 5.8 m drawdown WCM drawdown 0.1 m to 0.2 m within 26 m offset; may not be related to pumping Middle WCM screen 11 m offset 0.2 m drawdown
15 Cecil Plains Test Pumping Response 325 Limited correlation between CA water level and upper or middle WCM water level Mechanical loading likely explains some response in upper WCM Water Level Elevation (mahd) Water Level Elevation (mahd) Oct 31-Oct 14-Nov 28-Nov 12-Dec 26-Dec 09-Jan 23-Jan 06-Feb 20-Feb 06-Mar 20-Mar 03-Apr 17-Apr 01-May Pumping Test and Recovery Multiple Pumping Cycles LP14 Upper WCM No Pumping Carn Brea 17 LP15 LP16 LP14 RN LP Oct 31-Oct 14-Nov 28-Nov 12-Dec 26-Dec 09-Jan 23-Jan 06-Feb 20-Feb 06-Mar 20-Mar 03-Apr 17-Apr 01-May Water Level Elevation (mahd) LP16 Middle WCM LP Oct 31-Oct 14-Nov 28-Nov 12-Dec 26-Dec 09-Jan 23-Jan 06-Feb 20-Feb 06-Mar 20-Mar 03-Apr 17-Apr 01-May

16 Daleglade Test Pumping Response Test Prep Pumping Test Multiple Pumping Cycles No Pumping and Recovery Upper WCM


 Centrifuge")
 CA Pumping")
17 Drilling and Pumping Test Interpretation Multiple interpretation methods used to interpret test results and estimate effective K v between CA pumping well and WCM monitoring wells Analytical methods (MLU, Theis etc) Centrifuge permeameter testing of WCM core Numerical modelling (MODFLOW) CA Pumping Well WCM Observation Well
18 Parameter Summary A Comparison K v of TZ and Upper WCM (m/day) Concrete Typical landfill liner Clay Silty Sand
19 Key Conclusions Regional Connectivity There is low level of regional hydraulic connectivity between the Condamine Alluvium and the Walloon Coal Measures. This is expected to limit the impacts of CBM development on overlying water supply aquifer. Hydraulic evidence Despite the presence of a significant (up to >30 m) hydraulic gradient, WCM groundwater levels not clearly impacted by declining CA levels Test pumping at two representative sites indicate low vertical hydraulic conductivity between CA and WCM (10-9 to m/s) Hydrochemical evidence Despite the presence of a significant hydraulic gradient, hydrochemical signatures do not indicate intermixing of water between CA and WCM. Physical evidence Presence of clay and mudstone dominated horizon underlying much of the CA that will impede vertical flow
20 Ongoing Work This is an ongoing project aimed at continually improving understanding and predictive capabilities. Monitoring of water levels at nested CA/WCM well pairs Ongoing water quality sampling Additional drilling and pumping tests at select sites Understanding of CA/WCM connectivity being incorporated into regional numerical models aimed at basin-wide predictions of groundwater impacts Results will be summarized in 2016 Surat Basin UWIR update (consultation draft available online), and future UWIR updates.

21 Project Partners