Chemical Flood Design
|
|
|
- Delilah Hamilton
- 5 years ago
- Views:
Transcription

1 Chemical Flood Design V L A D I M I R A L V A R A D O C H E M I C A L A N D P E T R O L E U M E N G I N E E R I N G J A N U A R Y


2 Outline Project objective Fluid characterization Design challenge ASP Evaluation First Attempt Second Attempt Closing remarks
3 Project Objective To develop an effective alkaline-surfactantpolymer (ASP) blend for the DC field based on based behavior studies in the lab and coreflooding experiments. No rock samples from this field were available Fluid samples and data on the reservoir were collected by UW-PETE team
4 Brine Analysis Reservoir Brine Synthetic Reservoir Brine Calcium: 456 mg/l Calcium: 433mg/L Magnesium: 63 mg/l Magnesium: 72 mg/l Sodium: 1315 mg/l Sodium: 1459 mg/l Potassium: 71 mg/l Potassium: 79 mg/l Bicarbonate: 509 mg/l Bicarbonate: 505 mg/l Chloride: 360 mg/l Chloride: 860 mg/l Sulfate: 3400 mg/l Sulfate: 3700 mg/l TDS: 6094 mg/l TDS: 6730 mg/l Synthetic brine optimized for sulfate and bicarbonate concentrations
5 Brine Analysis Injection Water Synthetic Injection Water Calcium: 6.3 mg/l Calcium: 13 mg/l Magnesium: 1.7 mg/l Magnesium: 2 mg/l Sodium: 556 mg/l Sodium: 486 mg/l Potassium: 2.6 mg/l Potassium: 0.5 mg/l Bicarbonate: 298 mg/l Bicarbonate: 362 mg/l Chloride: 12 mg/l Chloride: 13 mg/l Sulfate: 720 mg/l Sulfate: 780 mg/l TDS: 1600 mg/l TDS: 1500 mg/l Synthetic brine optimized for sulfate and bicarbonate concentrations
6 IFT (dynes/cm) Interfacial Tension IFT measured with pendant drop = 26 dynes/cm Deadman Creek Oil with Deadman Creek Injection Water at 25 C Time (s) IFT = 26 dynes/cm drop released IFT
7 Design Challenge Ongoing fresh waterflooding have changed current reservoir water chemistry. The challenge is to find surfactant blends that reach optimum salinity at a TDS < 12,000 ppm. Solution: Use of surfactants with PO groups and blend them with the main surfactant
8 First Attempt SUBOPTIMUM DESIGN (ONE SURF.)

9 Prepared solutions with: 1 wt% surfactant Surfactant Selection 1 wt% Alkali NaOH Na 2 CO 3 NaCl salinity varying from 1 wt% to 7 wt%

10 Surfactant Selection Flame seal pipettes Inject Alkali- Surfactant solutions with each salinity Combine with DC Oil Cap pipettes and purge with argon gas Placed in oven at 120 F, mixed gently


11 Surfactant Selection
12 SR cc/cc Surfactant Selection Record initial oil/water interface Measure the volume of oil and water in microemulsion Determine optimum salinity by plotting solubilization ratio vs salinity P S-13 B [NaCl] (wt%) Optimum Salinity = 5 wt% SRw SRo
13 Surfactant Selection Surfactant Activity (%) Yes No Maybe P S-13 B X P S-13 C X P S1-HA X P M X P S-13D HA X P A-6 X P C-2 46 X A-F X P C X P S X Yes = Optimum Salinity below brine salinity, less than 2 days to achieve


14 Surfactant Selection Tested P S-13B and P S- 13C with synthetic field brines Tested P S-13C for critical micellar concentration (CMC)
15 Core Flooding ASP # 1(NaOH) Core: Minnelusa Core W R741 D7215 D=3.735 cm L=7.364 cm A= cm 2 Φ=22.99 % Kg=516.6 md PV= cm 3 Wt dry= g Wt wet= g Diff= g Core was initially cleaned with toluene and methanol, then dried in the oven
16 Core Flooding ASP #1 (NaOH) Test for reduction in residual oil saturation Core aged in synthetic DC reservoir brine Flooded with DC oil to Swi and aged 10 PV waterflood with synthetic DC injection brine 3 PV ASP flood 500 ppm P S-13C 2000 ppm Floppam 3330S polymer 1 wt% NaOH 1L synthetic DC injection brine 10 PV chase waterflood with synthetic DC injection brine
17 ΔP (psi) Core Flooding #1 (NaOH) ASP Experiment # DP PV Injected 0 Oil Recovered
18 Core Flooding ASP # 2 (Na 2 CO 3 ) Core: Minnelusa Core W R741 D D=3.728 cm L=7.557 cm A= cm 2 Φ=22.73 % Kg=510.1 md PV= cm 3 Wt dry= g Wt wet= g Diff= g Core was initially cleaned with toluene and methanol, then dried in the oven

19 Core Flooding ASP #2 (Na 2 CO 3 ) Test for reduction in residual oil saturation Core aged in synthetic DC reservoir brine Flooded with DC oil to Swi and aged 10 PV waterflood with synthetic DC injection brine 3 PV ASP flood 500 ppm P S-13C 2000 ppm Floppam 3330S polymer 1 wt% Na 2 CO 3 1L synthetic DC injection brine 10 PV chase waterflood with synthetic DC injection brine
20 ΔP (psi) Core Flooding #2 (Na 2 CO 3 ) ASP Experiment # 2 (Na 2 CO 3 ) DP Oil Production PV Inj
21 Core Flooding Comparison Test φ K (md) Swi (%) Waterflood Recovery (%OOIP) Tertiary ASP Recovery (%OOIP) Pressure Drop Return to Waterflooding ASP#1 (NaOH) Yes ASP#2 (Na 2 CO 3 ) No
22 kr - relative permeability ASP #1 Relative Permeability Curves Sw krw vs Sw krow vs Sw
23 Cumulative oil produced (ml) Oil Cut Pressure drop (psi) OOIP% ASP #1 (NaOH) History Match (WF) Inj. PV 12 CMG- STARS Measured Inj. PV CMG-STARS Measured CMG-STARS Measured CMG-STARS Measured Inj. PV E N H A N CInj. E D PV O I L R E C O V E R Y I N S T I T U T E
24 Second Attempt OPTIMUM DESIGN (+1 SURF.)
25 Materials and Methods Connate brine Component Wt (gr) MgSO KCl Injection brine Just 1600 ppm NaCl CaCl 2.2H 2 O NaCl Na 2 SO TDS 7100 ppm
26 Materials and Methods Dead man Creek Crude Oil Surfactant Polymer Alkali Core Viscosity at 48 o C = 83 cp 0.75wt%PS13-D wt%PS3B Flopaam-3330s 2000 ppm (ASP) 1000 ppm (P) Berea: (ASP 1) L= cm D= 3.73 cm PV= cc Φ= 25.62% K air = md 1wt% NaOH Minnelusa: (ASP 2) L= cm D= cm PV= cc Φ= 21.43% K air = md

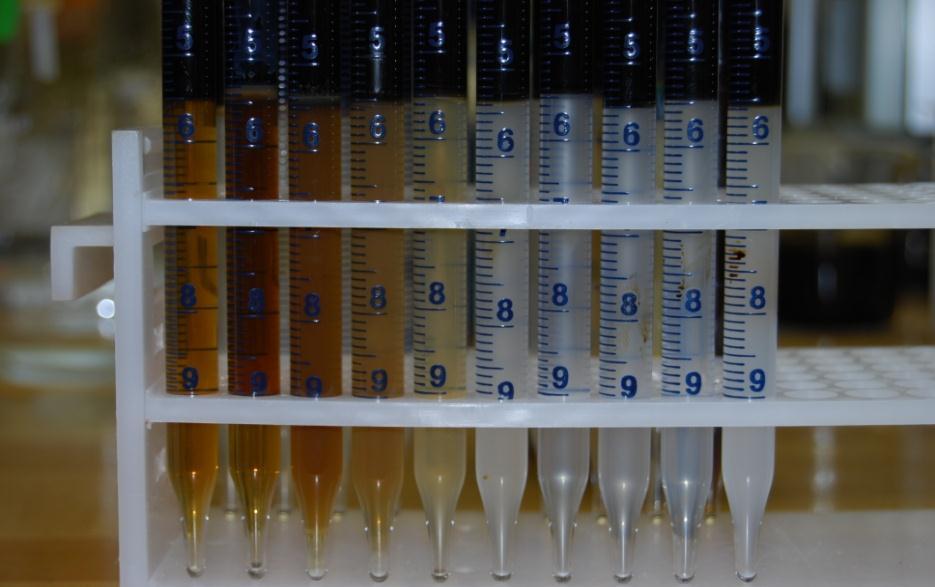
27 micro micro Oil 24 hr Brine + surfactant Initial interface Pipette (bottom sealed) Varying parameter Parameter Salinity Surfactant blend ratio Soap/surfactant ratio Winsor Winsor Type - I - I Type - - III III Winsor Type -- II II Optimal parameter

 increases")

28 Only 1wt% Surfactant Salinity (NaCl ppm) increases
29 1wt% Surf. + 1wt% Na 2 CO 3 Salinity (NaCl ppm) increases

30 1wt% Surfactant + 1wt% NaOH Salinity (NaCl ppm) increases

31 Only 1wt% Surfactant 1wt% Surfactant + 1wt% NaOH 1wt% Surfactant + 1wt% Na 2 CO 3 Opt_Sal > ppm Opt_Sal ~ ppm Opt_Sal ~ ppm
32 Theory: Log ( optimal salinity) blend n number of i 1 surfact. x i Log ( optimal salinity) i Log( optimal salinity) ASP _ blend x1log( opt. salinity of insitu soap) x2 Log( opt. salinity of injected surfactnt) F( type of organic acids, ph, type of cations) F( TAN, asphaltene amount, ph, concentration of alkali)
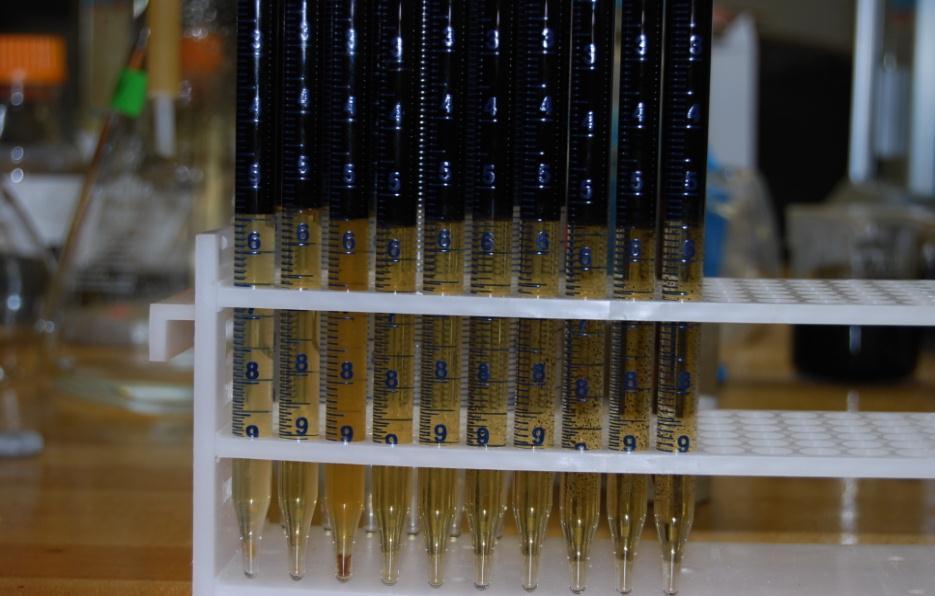
33 Only 1wt% Na 2 CO 3 Salinity (NaCl ppm) increases

34 Only 1wt% NaOH Salinity (NaCl ppm) increases
")
35 Results (ASP#1)
36 (sec -1 )
37 ph ph at effluent Inlet ph Inj. PV
38 Water visc. (cp) Emulsion visc. (cp) Water viscosity Inlet viscosity Emulsion Inj. PV 0
39 Stage Permeability (md) Initial air permeability 366 Initial brine permeability (S w =1) 55.5 Oil permeability at S wi Brine permeability at S or Brine permeability at the end of chemical flood 27.43
")

40 Results (ASP#2) WF ASP P WF 40
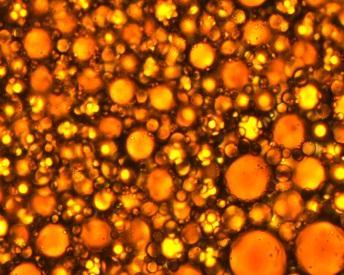
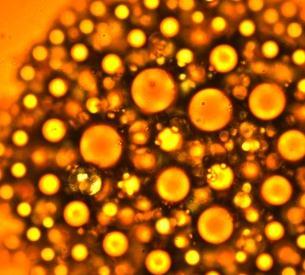


41 ph and surfactant concentration at effluent: Mostly stable W/O emulsion 41

 kev Spectrum 4 Ca Cl Cl K O Ca Na Si S")


42 Observed precipitation at effluent samples: Ca Spectrum 1 Cl Na O K Ca S K Cl Si Cl K Ca Full Scale 4240 cts Cursor: (82 cts) kev Spectrum 4 Ca Cl Cl K O Ca Na Si S Cl K K Ca Full Scale 5549 cts Cursor: (361 cts) kev As we expected some secondary minerals was produced (here calcite, also some sulfur was produced which is a really evidence for anhydrite dissolution)
43 Results (ASP#2) (cont d) Permeability Changes (Minn.) Stage Permeability (md) Initial air permeability Initial brine permeability (S w =1) 152 Oil permeability at S wi Brine permeability at S or 42.5 Brine permeability at the end of chemical flood
44 Results (ASP#3) 44


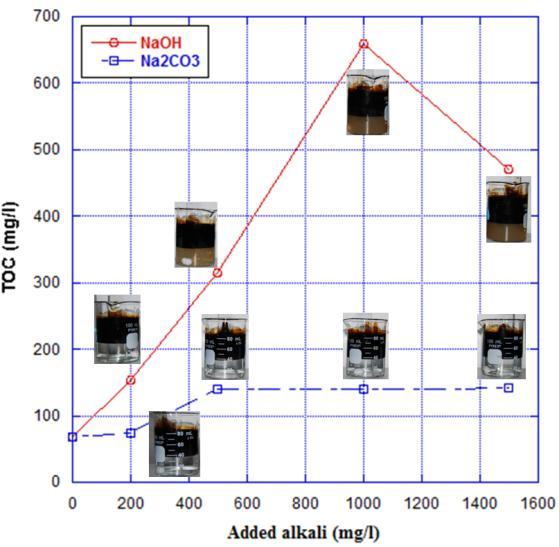
45 Why does NaOH work better? 45