Byllesby Reservoir Phosphorus TMDL Public Meeting & Open House May 13, 2013 Phillippo Scout Reservation
|
|
|
- Russell Ryan
- 5 years ago
- Views:
Transcription

1 Byllesby Reservoir Phosphorus TMDL Public Meeting & Open House May 13, 2013 Phillippo Scout Reservation Minnesota Pollution Control Agency Cannon River Watershed Partnership wq-iw9-10n


2 Thank you for your time and attention. SWCDs, Counties, State Agencies, Cities, others
 Background Byllesby Reservoir Impaired waters Project Information Water quality goals")
3 Introductions (?) Background Byllesby Reservoir Impaired waters Project Information Water quality goals Nutrient loads Implementation Recent Water Quality Data Timeline, Next Steps

4

5
 Watershed Area*** (acres) Hunt (66-0047-00) Lake No 174 639 3.6 French (66-0038-00) Lake No 879 4,400 5.0 Shields (66-0055-00) Lake Yes 932 7,053 7.")
6 Table 1. Examples of surface area to watershed area ratios for Cannon River watershed lakes and reservoirs. Lake Name Lake or Reservoir* Cannon River Flowage? Surface Area** (acres) Watershed Area*** (acres) Hunt ( ) Lake No French ( ) Lake No 879 4, Shields ( ) Lake Yes 932 7, Rice ( ) Reservoir Yes , Byllesby Reservoir ( ) Reservoir Yes 1, , * Determined by presence or absence of artificial control structure at outlet. **From draft (d) lakes shapefile. ***Delineated by Cannon River Watershed Partnership at request of Rice County in Ratio Shallow
7 In the 1970 s, the Clean Water Act provided motivation and funding to identify water quality problems and to develop solutions to correct these problems States have a responsibility to create water quality standards that are based on the designated uses of water bodies. States are also required to assess water bodies (such as a lakes, rivers, and streams) and use the information to identify waters not meeting water quality standards (303d list) Note fact sheets
 Aquatic Recreation >> excess nutrients (phosphorus) Aquatic Life >> Turbidity, biological")
8 Affected Use >> Assessment Parameter Aquatic Consumption >> mercury Aquatic Recreation >> pathogens (E. coli) Aquatic Recreation >> excess nutrients (phosphorus) Aquatic Life >> Turbidity, biological data
9 Lake and Reservoir Restoration Guidance Manual, US EPA
 Affected Use: Aquatic")
10 Year listed: 2002 Impairment cause: excess nutrients (phosphorus) Affected Use: Aquatic Recreation

11
12 Understand current water quality and pollutant loads Compare to allowable per goals Determine splits between sources to extent practicable; mainly point vs non-point Manage accordingly to reduce loads

13
14 Byllesby Reservoir Watershed Ecoregions In 2008 the State of Minnesota promulgated water quality standards for class 2 waters 1.A provision that states that eutrophication standards for reservoirs may be formulated on a site-specific basis to account for characteristics unique to reservoirs that can affect trophic status, such as water temperature, variations in hydraulic residence time, watershed size, and the fact that reservoirs may receive drainage from more than one ecoregion (see , subpart 4a(E)).
15 The Byllesby Reservoir is unique and distinctly apart from the natural lakes of Minnesota. It has the most expansive lake or reservoir drainage in the Lower Mississippi River Basin in Minnesota (with the exception of Lake Pepin) and 80-90% of its water budget comes by way of the Cannon River. Given its relative shallowness, very large watershed, and short residence time, it would be inappropriate to apply to the Byllesby Reservoir a eutrophication standard designed for deep, natural lakes. Rather, the focus should be on reducing the frequency and severity of nuisance algae blooms. This is consistent with shallow Western Corn Belt Plains (WCBP) lakes, and thus the proposed numeric criteria for the Byllesby Reservoir are similar to the WCBP shallow lakes values. Proposed Criteria (summer means): TP: 90 ug/l Chla: 30 ug/l Secchi: 0.8 meters Significant reductions required to attain these goals
16
17


18 Understand current water quality and pollutant loads Compare to allowable per goals Determine splits between sources to extent practicable; mainly point vs non-point Manage accordingly to reduce loads


19


20 Google: Environmental Data Access


21 Commonly used lake and reservoir water quality simulation tool Set up model using available data Reduce phosphorus loads until goals met Make allocations accordingly Spigot: inflow; what happens in the tub?

22 Byllesby Reservoir Annual Phosphorus Load (kg/year TP) Measured vs Capacity 250, , ,000 Ref Year Measured Loading Capacity 100,000 50,000 0 Lower Flow Higher Flow
23 Higher Flow Year Gross Estimate 2002 kg/year 39,461 All other (residual) WWTF pre-2012 (measured at outfalls) 188,469

24
25 Major municipal wastewater treatment facilities go to 1 mg/l total phosphorus limit The three most significant municipal point source dischargers of phosphorus (Faribault, Northfield and Owatonna) have completed capital improvements and taken on further maintenance costs to address phosphorus removal. Cost: approximately $27 million (low interest loans and other funding) for improved treatment (Henry Morgan, personal communication). TMDL will be used for permitting going forward
 20000 15000 10000 2010 2011 2012 5000 0 Faribault Northfield Owatonna All")
26 Wastewater Phosphorus Loads in the Byllesby Reservoir Watershed Total Phosphorus (kg/year from Delta) Faribault Northfield Owatonna All Other Total

27 Municipal Separate Storm Sewer Systems (MS4s) Pipe conveyance Goal is 30% reduction Permit mechanism, Stormwater Pollution Prevention Plan (SWPPP)
, parts of six counties TMDL includes inventories of feedlots, septic systems, CRP acres, and various land uses Continued pursuit of prioritization")
28 Few regulatory tools On-going work Very large watershed (1.3% of MN), parts of six counties TMDL includes inventories of feedlots, septic systems, CRP acres, and various land uses Continued pursuit of prioritization of nonpoint source work A lot has already been done and much underway; Clean Water Fund; other money

29 31 permanent easements have been secured covering over 1700 acres of previously drained wetlands and adjacent uplands.


30 Projects have focused on: Reduction of runoff from smaller, open lot livestock feedlots through increased technical, educational, and financial support Assistance to beef and dairy producers to accelerate the use of rotational grazing Assistance to small, unsewered communities to provide adequate treatment of sewage Sediment, E. coli, phosphorus goals related Note Reserve Capacity
31
32 Pollutant Trends in Southeast Minnesota Rivers Total Biochemical Suspended Total Nitrite/ Oxygen Solids Phosphorus Nitrate Ammonia Demand Chloride Vermillion River at Br on Blaine Ave, 4 Mi NE of Farmington (VR-32.5) (period of record ) overall trend decrease decrease no trend decrease increase little data Cannon River at Br on CSAH-7 at Welch (CA-13) (period of record ) overall trend decrease decrease increase decrease decrease increase Straight River near CSAH-1, 1 Mi SE of Clinton Falls (ST-18) (period of record ) overall trend decrease decrease no trend decrease decrease increase Zumbro River South Fork at CSAH-14, 3 Mi N of Rochester (ZSF-5.7) (period of record ) overall trend decrease decrease increase decrease decrease increase Whitewater River South Fork N of Cr-115, 3.5 Mi NW of Utica (WWR-26) (period of record ) overall trend decrease no trend increase decrease decrease increase Garvin Brook at CSAH-23, SW of Minnesota City (GB-4.5) (period of record ) overall trend decrease decrease increase decrease decrease increase Root River at Br on MN-26, 3 Mi E of Hokah (RT-3) (period of record ) overall trend decrease decrease increase decrease decrease increase Cedar River at CSAH-2, 0.5 Miles E of Lansing (CD-24) (period of record ) overall trend decrease decrease increase decrease decrease no trend Cedar River at CSAH-4, 3 Miles S of Austin (CD-10) (period of record ) overall trend decrease decrease increase decrease decrease no trend Shell Rock River at Br on CSAH-1, 1 Mi W of Gordonsville (SR-1.2) (period of record ) overall trend decrease decrease increase decrease decrease increase
33 Streams and lakes within Byllesby Watershed Byllesby Reservoir goals Pepin goals

34 Cannon River at Canada Avenue
35 Reservoir goal of TP < 90 mg/l Cannon River inflow goal of TP ~ 150 mg/l
36 Goal for Cannon River Inflow Owatonna, Faribault phos limits

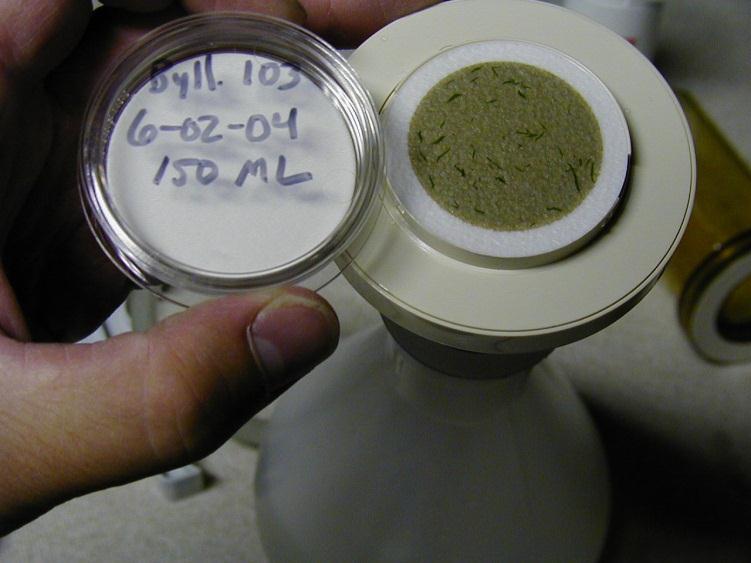
37 Total Phosphorus Year site 101 site 103 site Phosphorus levels down Good reports from locals Weather, flow matter Site 101: inflow segment Site 103: mid-lake segment Site 105: near-dam segment Metropolitan Council Environmental Services monitoring reservoir in 2013
38 Comment period: today through June 14 Response to comments Documented modified Submitted to EPA for review and approval Google: Byllesby TMDL
39 Continue key monitoring work (plan in TMDL) Partnership between MPCA, CRWP, METC, LBIA citizen monitors Technical work in Cannon is on-going Intensive monitoring, assessment Construction of a watershed model will help to examine scenarios for Byllesby On-going implementation work TMDL is a guide for watershed permits

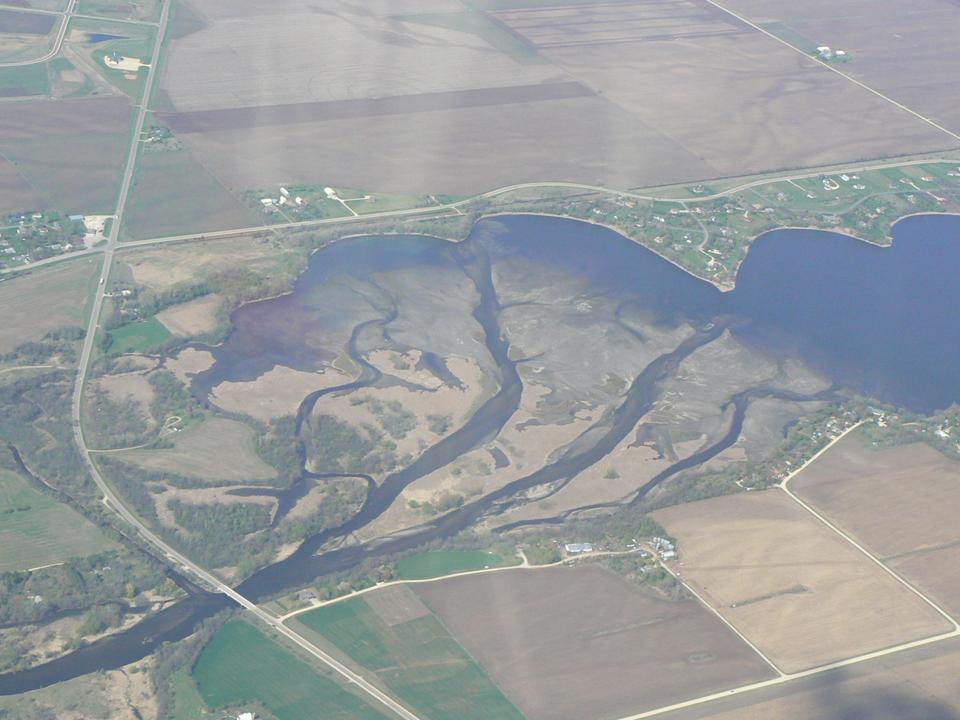
40 August 2003, Byllesby Reservoir