Telling Stories with Data: Tales from the Smart Grid February 6, Ethan Goldman Energy Informatics Architect Efficiency Vermont
|
|
|
- Ethel Barnett
- 5 years ago
- Views:
Transcription


1 Telling Stories with Data: Tales from the Smart Grid February 6, 2013 Ethan Goldman Energy Informatics Architect Efficiency Vermont 1
 earned on completion of this program will be reported to AIA/CES for AIA members. Certificates of Completion for both AIA members and non-aia members are available upon request.")
2 Efficiency Vermont is a Registered Provider with The American Institute of Architects Continuing Education Systems (AIA/CES). Credit(s) earned on completion of this program will be reported to AIA/CES for AIA members. Certificates of Completion for both AIA members and non-aia members are available upon request. This program is registered with AIA/CES for continuing professional education. As such, it does not include content that may be deemed or construed to be an approval or endorsement by the AIA of any material of construction or any method or manner of handling, using, distributing, or dealing in any material or product. Questions related to specific materials, methods, and services will be addressed at the conclusion of this presentation. 2
3 Learning Objectives By the end of this program, participants will be able to: Learn about the latest technologies, both hardware and software (analytics), for interacting with the Smart Grid (and associated data) to find and verify energy savings. Learn the current status of VT Smart Grid deployments for various electric distribution and efficiency utilities. Learn about the latest research findings on behavioral conservation and other energy savings from Smart Grid technologies and services. Assess different types of customers and situations (high bill, new building commissioning, etc.) and different technology options in order to select the appropriate solution. 3

4 Course Evaluations In order to maintain high-quality learning experiences, please access the evaluation for this course by logging into CES Discovery and clicking on the Course Evaluation link on the left side of the page. 4

5 VEIC s mission: Reduce the costs both economic and environmental of energy use. 5
6 The nation's first ratepayer-funded energy efficiency utility providing energy efficiency services statewide 6


7 12,000,000,000 energy measurements in Vermont in 2013 (give or take a few) 7

8 8

9 GMP-south: Online access 9


10 10
11 Green Button Example: leafully 11


12 Commercial Analysis: Energy Ai 12

13 13

14 Commercial Analysis: Retroficiency 14

15 Commercial Analysis: Retroficiency 15

16 Commercial Analysis: Retroficiency 16
17 Retroficiency 17

18 Home Electricity Report Pilot 18

19 Home Electricity Report Pilot 19
20 Home Electricity Report Pilot 20
21 Home Electricity Report Pilot 21

22 C&I: Custom Analysis 22

23 Experimental Interfaces 23

24 24


25 C&I: Submetering 25
26 C&I: Submetering Date & Time Record Date Record End Time Day of Week High Pressure Pump 1 [kw] High Pressure Pump 2 [kw] High Pressure Pump 3 [kw] High Pressure Pump 4 [kw] High Pressure Pump 5 [kw] High Pressure Pump 6 [kw] 4/27/2012 9:05 4/27/2012 9:05: /27/2012 9:10 4/27/2012 9:10: /27/2012 9:15 4/27/2012 9:15: /27/2012 9:20 4/27/2012 9:20: /27/2012 9:25 4/27/2012 9:25: /27/2012 9:30 4/27/2012 9:30: /27/2012 9:35 4/27/2012 9:35: /27/2012 9:40 4/27/2012 9:40: /27/2012 9:45 4/27/2012 9:45: /27/2012 9:50 4/27/2012 9:50: /27/2012 9:55 4/27/2012 9:55: /27/ :00 4/27/ :00: /27/ :05 4/27/ :05: /27/ :10 4/27/ :10: /27/ :15 4/27/ :15: /27/ :20 4/27/ :20: /27/ :25 4/27/ :25: /27/ :30 4/27/ :30: /27/ :35 4/27/ :35: /27/ :40 4/27/ :40: /27/ :45 4/27/ :45: /27/ :50 4/27/ :50: /27/ :55 4/27/ :55:
27 Power [kw] C&I: Submetering High Pressure Line - Compiled Pressure and Power Pressure control reduced from 1100 PSI to 1050 PSI Pressure control reduced from baseline 1150 PSI Pressure control reduced from 1050 PSI to 1000 PSI Pressure [PSI] Sum High- Pressure Pumps [kw] Pressure at High- Pressure Pumps [PSI] Memorial day shutdown produces lower valley; short drops to zero caused by pump turnoff while branchvalve testing was completed 0 4/27/2012 9:05 5/4/2012 9:05 5/11/2012 9:05 5/18/2012 9:05 5/25/2012 9: *Note: Black pressure trendline is a rolling 100 point average, and is thus slightly out of phase with data; it is included solely for visual clarity and was not used for calculations. 27


28 Residential and Small Business Sub-metering 28
")
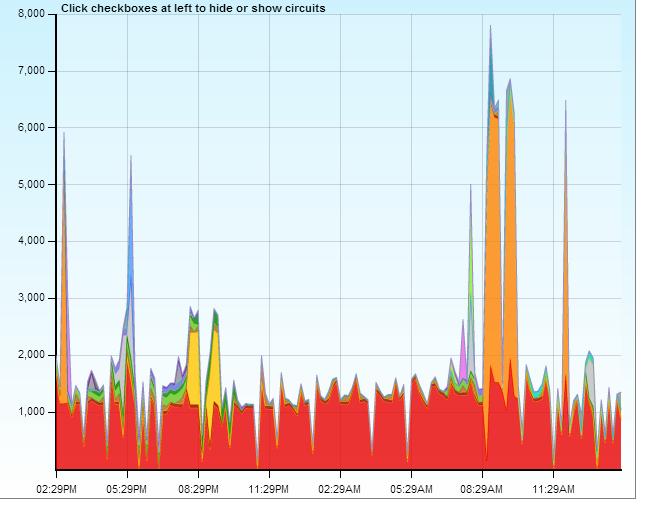
29 Circuit-level data (egauge) 29


30 Circuit-level data (egauge) 30
31 Circuit-level data (egauge) 30 Fridge kwh / week
")
32 Circuit-level data (emonitor) 32
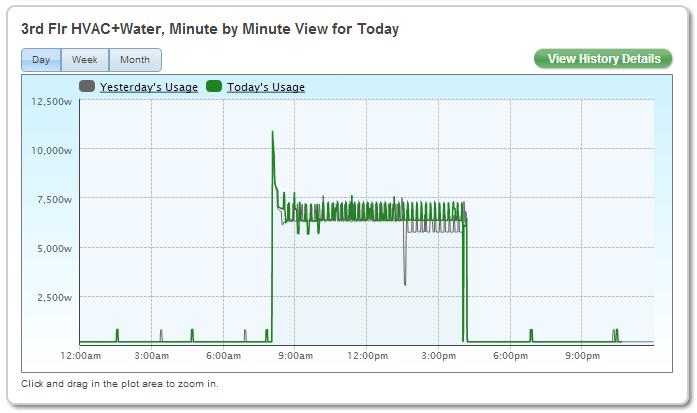

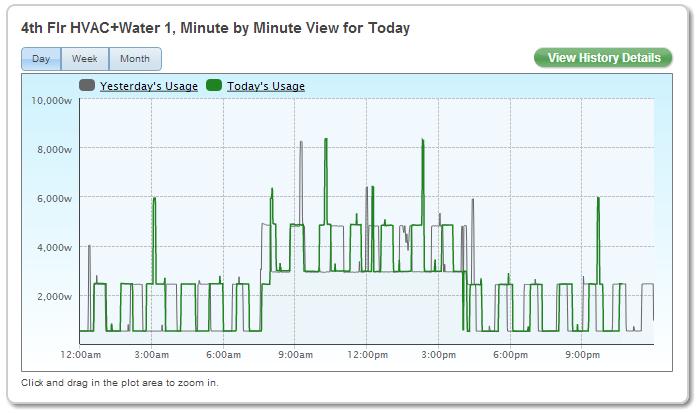

33 Circuit-level data (emonitor) 33


34 34


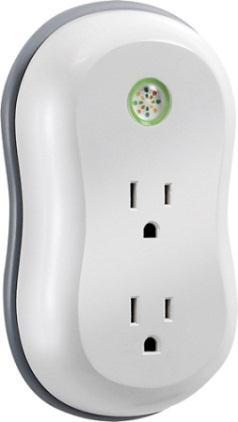
35 Plug Loads: Meter Loan Program 35

36 Plug loads: Modlet 36


37 Thermal Performance Feedback (Residential) 37
38 Smart Thermostats 38
39 Gathering data bit by bit 39

40 Connected data everywhere 40
41 Indoor temp (F) Data logged from inside temperature Samples, 5 min between each 42
42 Indoor Temp (F) U*A*(inside temp outside temp) specific heat of air * volume * density internal loads air infiltration, ventilation Time 43
43 Indoor temp (F) Logging temperature cycles Feb 5-Feb 6-Feb 44

44 Programmable Communicating Thermostat (PCT) 45
45 Programmable Communicating Thermostat (PCT) 46

46 PCT Web Interface 47

47 Thermal Data Analysis 48
48 49
49 Schwoop-slope vs. Delta-T 50
50 Rate of cooling (deg F per hour) Between-building comparison 0 Inside - Outside Delta-T y = x R² = y = x R² = y = x R² =
51 Slope Adjustment Intercept Adjustment 52
52 53