Renewable Energy at Landfills - OR - The New Waste Management Hierarchy
|
|
|
- Polly Tucker
- 5 years ago
- Views:
Transcription


1 Renewable Energy at Landfills - OR - The New Waste Management Hierarchy

2 Asset Management Beyond Closure EPA Waste Management Hierarchy Renewable Energy?

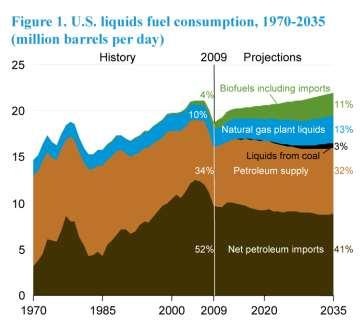
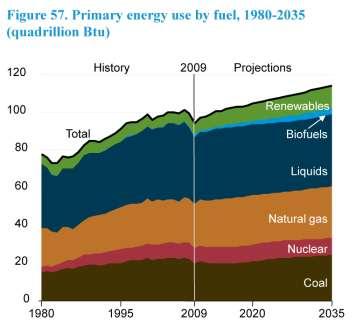
3 The Case for Renewables Economics Geopolitics Energy Security Green Ethics World Energy Consumption Energy Information Agency
4 The Case for Renewables (cont.) Source: Energy Information Agency
5 Repowering America EPA / DOE / NREL Promoting Renewables on Brownfields, Superfund Sites, Landfills > 490,000 sites identified 15 million acres of contaminated land 100,000 decommissioned or old landfills 11 landfill solar farms = 43 MW (dated) CO, GA, NV, NC, NJ, MA & TX

6 US Photovoltaic (PV) Potential Source: National Renewable Energy Laboratory
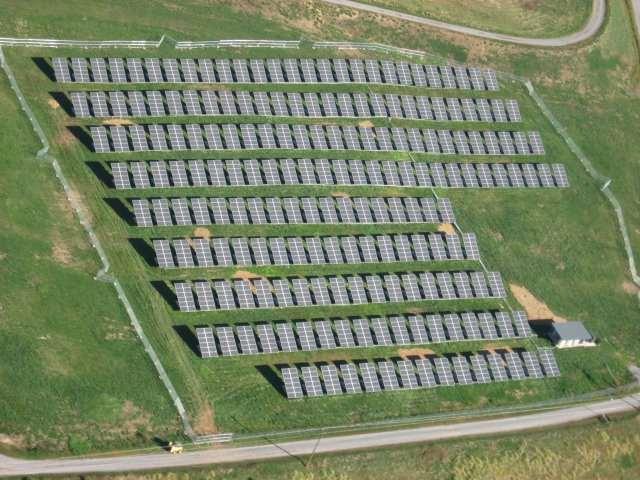
7 Landfill Solar Facilities
8 WM Landfill Morrisville, PA

9 Evergreen Packaging LF - NC


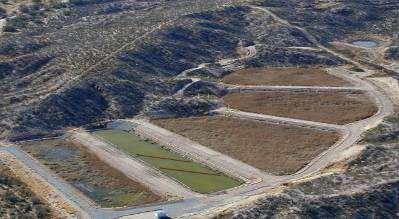
10 Apache Powder Site AZ GW Remediation


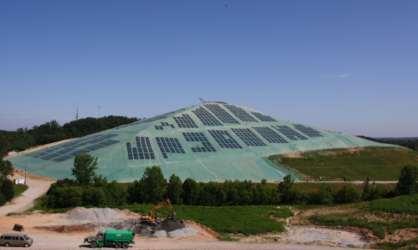
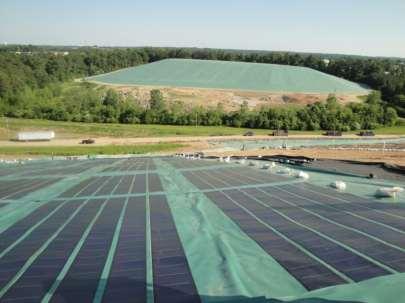
11 Republic s Hickory Ridge LF - GA

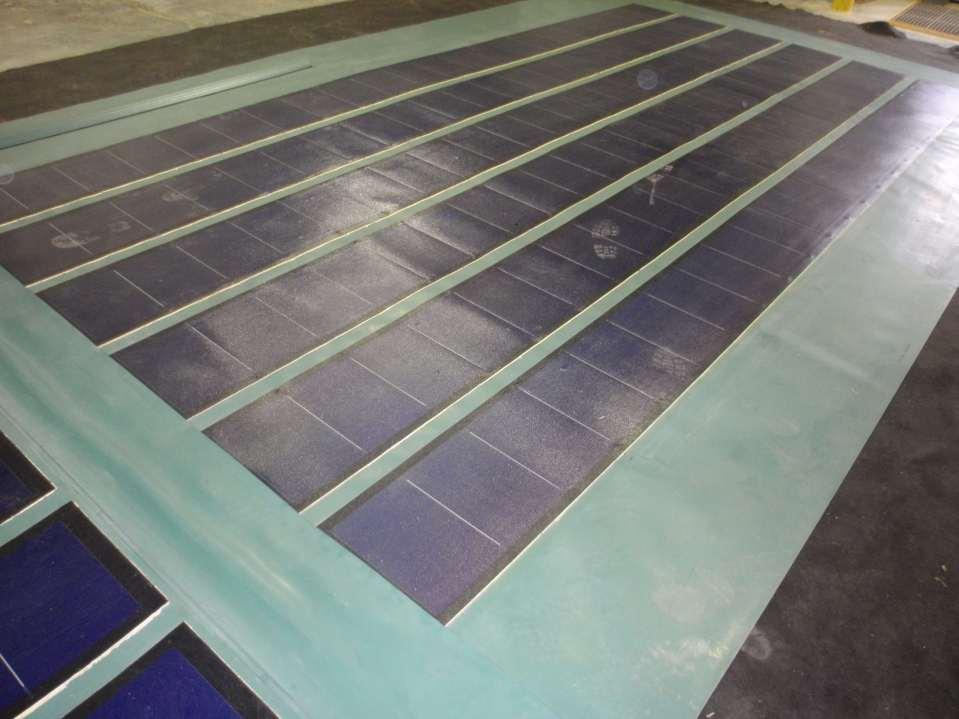
12 Project Basics


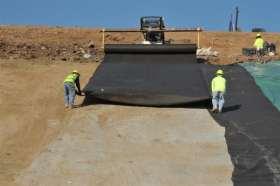
13 Project Components SpectroMat GeoTPO Geomembrane Geotextile Low Profile Wire Trace
14
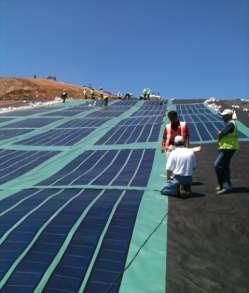
15 Construction Spring Summer 2011
 Total Expense $102,400 / Ac Net Present Value: account for savings in maintenance & sale")
16 TYPICAL COSTS 45 Acre Total Closure 7 South-facing Acres for Spectro Power Cap $60,000 / Ac installed (material $21k/ac) Spectro Power Cap = 150kw / $5/watt GA Environmental Finance Authority Grant = $2m Federal tax incentives (30% & 5 yr depreciation) Total Expense $102,400 / Ac Net Present Value: account for savings in maintenance & sale of electricty


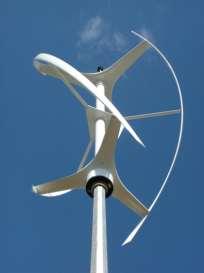
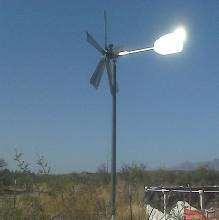
17 Wind Power Technology


18 US Wind Potential Source: NREL Why are wind turbines usually so high off the ground?

19 James Madison University 30 Meter Map

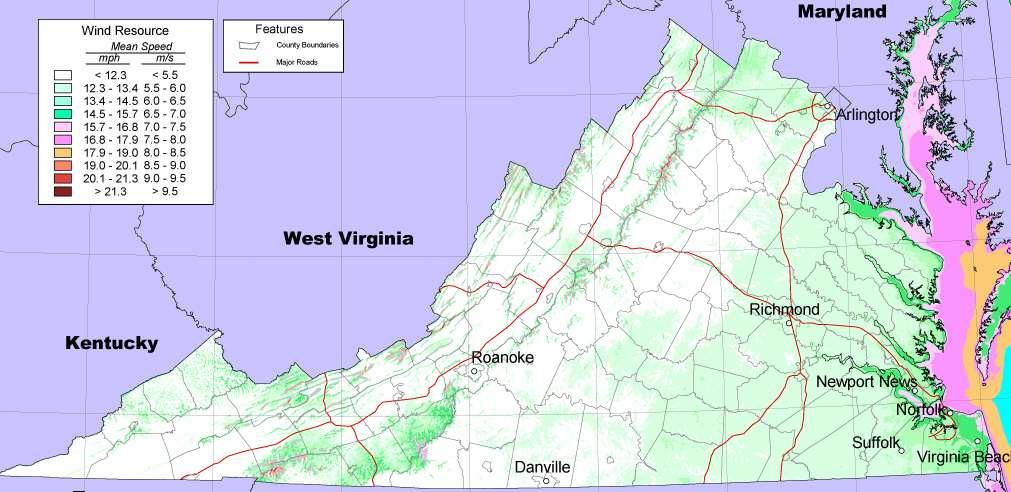
20 James Madison University 100 Meter Map

21 Wind Turbines and Height Source: Georgia Tech & Southern Company

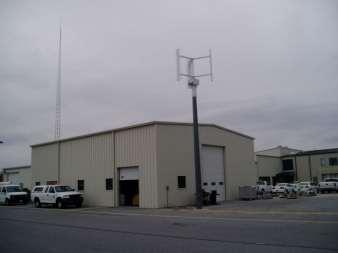
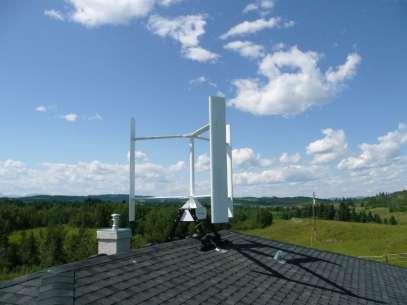
22 Landfills and Wind Power

23 Frey Farm Landfill - LCSWMA


24 Project Partners

25 LCSWMA Wind Farm Development Long-term wind speed of m/s or mph South-central PA s 1st commercial-scale wind project 25% annual electricity needs provided to Turkey Hill Dairy 7.76 million kwh annually Reduced carbon footprint
26
 $5.")

27 Project Finances Cost Breakdown $9.5 Million Total Project Cost $1.5 Million PEDA Grant $2.4 Million Tax Credit (30%) $5.6 Million Total Equity Required LCSWMA Participation Loan to PPLRE = $4.65 million at 6% Receives 12.5% of electric revenues ROI = Avg. 9% per year over 20 years Tenfold higher than US Treasuries in 2010

28 Do Renewables Make Sense For You? Wind and Solar Inexhaustible resources Hedge against energy price fluctuations Contribute to RPS Do not contribute to: CO2 emissions SOx / NOx - Acid rain Smog / haze Mercury emissions Water withdrawal Particulate-related health effects Due Diligence Feasibility Analysis Resource assessment Financial analysis Electrical Interconnections Bundle projects? Permitting Requirements Impact Evaluations Cap Compatibility Site Engineering Community

29 Average Electrical Rates - US
 www.dsireusa.")
30 RPS Policies WA: 15% x 2020* OR: 25% x 2025 (large utilities)* 5% - 10% x 2025 (smaller utilities) CA: 33% x 2020 NV: 25% x 2025* AZ: 15% x 2025 MT: 15% x 2015 UT: 20% by 2025* NM: 20% x 2020 (IOUs) 10% x 2020 (co-ops) / June 2011 ND: 10% x 2015 SD: 10% x 2015 CO: 30% by 2020 (IOUs) 10% by 2020 (co-ops & large munis)* KS: 20% x 2020 MN: 25% x 2025 (Xcel: 30% x 2020) WI: Varies by utility; 10% x 2015 statewide IA: 105 MW IL: 25% x 2025 OK: 15% x 2015 MO: 15% x 2021 MI: 10% & 1,100 MW x 2015* IN: 15% x 2025 VT: (1) RE meets any increase in retail sales x 2012; (2) 20% RE & CHP x 2017 NY: 29% x 2015 OH: 25% x 2025 WV: 25% x 2025* VA: 15% x 2025* NC: 12.5% x 2021 (IOUs) 10% x 2018 (co-ops & munis) ME: 30% x 2000 New RE: 10% x 2017 NH: 23.8% x 2025 MA: 22.1% x 2020 New RE: 15% x 2020 (+1% annually thereafter) RI: 16% x 2020 CT: 23% x 2020 PA: ~18% x 2021 NJ: 20.38% RE x ,316 GWh solar x 2026 DC MD: 20% x 2022 DE: 25% x 2026* DC: 20% x 2020 TX: 5,880 MW x 2015 HI: 40% x 2030 Renewable portfolio standard Renewable portfolio goal * Solar water heating eligible Minimum solar or customer-sited requirement Extra credit for solar or customer-sited renewables Includes non-renewable alternative resources PR: 20% x states + DC and PR have an RPS (8 states have goals)

31 RPS Policies with Solar/DG Provisions WA: double credit for DG OR: 20 MW solar PV x 2020; double credit for PV NV: 1.5% solar x 2025; multiplier for PV UT: 2.4 multiplier for solar-electric AZ: 4.5% DG x / June 2011 CO: 3.0% DG x % customer-sited x 2020 NM: 4% solar-electric x % DG x 2020 MO: 0.3% solarelectric x 2021 MI: triple credit for solarelectric IL: 1.5% PV x 2025 OH: 0.5% solarelectric x 2025 WV: various multipliers NC: 0.2% solar x 2018 NH: 0.3% solarelectric x 2014 DC MA: 400 MW PV x 2020 NY: % customersited x 2015 NJ: 5,316 GWh solarelectric x 2026 PA: 0.5% PV x 2021 DE: 3.5% PV x 2026; triple credit for PV MD: 2% solar x 2022 DC: 0.4% solar x 2020 TX: double credit for non-wind (non-wind goal: 500 MW) Renewable portfolio standard with solar / distributed generation (DG) provision 16 states + DC have an RPS with solar/dg provisions Renewable portfolio goal with solar / distributed generation provision Solar water heating counts toward solar provision


32 Full Cost Accounting - Funding Life Open LF $ - $ - $ - $ - $ Sinking Fund Closed LF Internal Rate of Return (IRR)
33 Summary Asset Management Continues Beyond Closure Non-Productive Land May Be Put To Beneficial Use Financing A Key to Realizing Potential Renewable Energy Part of An Integrated WM Strategy Part of the Waste Management Hierarchy
34

35 North Carolina PV Potential

")

36 PV in Virginia PV in Virginia Ranges from 1.9 W/m2/day (December) to 5.6 kw/m2/day (June) Average household uses 1.2 kw/day Lots of PV configurations and $$


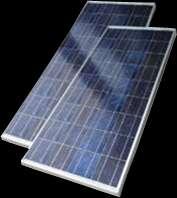

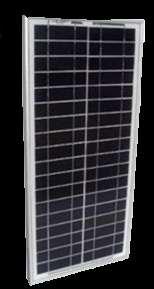
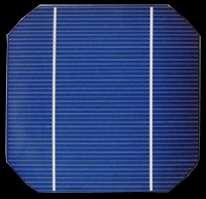
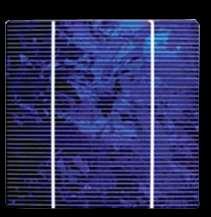

37 Landfills & Solar Photovoltaic: What Works Best? Monocrystalline Polycrystalline Amorphous Thin-film

38 Fort Carson Army Base - CO
39 Solar Considerations Does Solar Make Sense for You? Permitting Requirements Erosion & sediment control planning/npdes permits Solid Waste Management Regulation Local zoning Site and Geotechnical Engineering


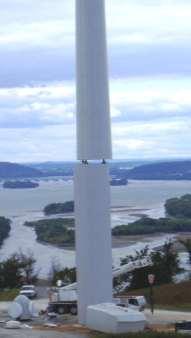
40 Anatomy of a Turbine Top Nacelle Hub Base Blades


41 Lancaster County Solid Waste Management Authority Foundation Excavation Placement of Geo-Textile for Stone Pad

42 Is Wind For You? Factors to Consider: Due Diligence Wind resource assessment Financial analysis Renewable energy credits Power purchase agreements Electrical Interconnections Permitting Requirements Erosion & sediment control planning/npdes permits Federal Aviation Administration Solid Waste Management Regulation US Fish & Wildlife Local Zoning
43 Is Wind For You? Factors to Consider: Impact Analyses Visual Sound Environmental/ecologic Avian Wildlife Site and Geotechnical Engineering Post-Construction Monitoring
44 LCSWMA Wind Farm Development Projected Life-Span = 20 years Analysis: 60-meter meteorological tower placed Sonic Detection and Ranging (SODAR) study Long-term wind speed of m/s or mph
45

46 Renewables in the US Energy Portfolio


47 What Else? The future ain t what it used to be. If you don t run, you rust. If I had a million dollars I could be a millionaire.????