2017 Performance Report for Bobcaygeon Waste Water Treatment Facility
|
|
|
- Gillian Melton
- 5 years ago
- Views:
Transcription
1 2017 Performance Report for Bobcaygeon Waste Water Treatment Facility Amended Environmental Certificate of Approval (ECA) #3028-AEUKDQ Section 11(4) requires the Performance Reports to contain the following: a) a summary and interpretation of all monitoring data and a comparison to the Final Effluent limits outlined in Compliance Limits condition, including an overview of the success and adequacy of the Works; b) a description of any operating problems encountered and corrective actions taken; c) a summary of all maintenance carried out on any major structure, equipment, apparatus, mechanism or thing forming part of the Works; d) a summary of any effluent quality assurance or control measures undertaken in the reporting period; e) a summary of the calibration and maintenance carried out on all effluent monitoring equipment; f) a description of efforts made and results achieved in meeting the Design Objectives of Condition 6; g) a tabulation of the volume of sludge generated in the reporting period, an outline of anticipated volumes to be generated in the next reporting period and a summary of the locations to where the sludge was disposed; h) a summary of any complaints received during the reporting period and any steps taken to address the complaints; i) a summary of all By-pass, spill or abnormal discharge events; j) a copy of all Notice of Modifications submitted to the Water Supervisor as a result of Schedule B, Section 1, with a status report on the implementation of each modification; k) a report summarizing all modifications completed as a result of Schedule B, Section 3; and l) any other information the Water Supervisor requires from time to time; and (ECA) #3028-AEUKDQ Section 6(3)
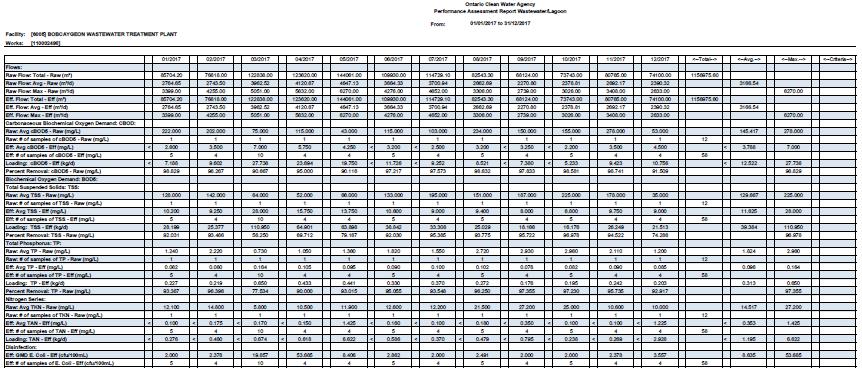
2 The Owner shall make an assessment of the issues and recommendation of pro-active actions if any is required under the following situations and include in the annual report to the Water Supervisor: a. when any of the design objectives is not achieved consistently; b. when the Annual Average Daily Flow reaches 80% of the Rated Capacity. The following is a report from the records maintained by the Ontario Clean Water Agency for the Bobcaygeon WWTP for the calendar year 2017: (a) Attached as Appendix I is a copy of the 2017 Performance Assessment Report (PAR) and loading calculations for the Bobcaygeon WWTP for the facility combined final effluent. The PAR contains: a tabulation of all monthly average raw sewage and final effluent sample results obtained during the reporting period, a tabulation of average daily flows, and monthly volumes for the reporting period, and a tabulation of calculated total loading of BOD/CBOD 5, suspended solids, total phosphorus, and ammonia + ammonium as N concentrations in the final effluent. Overall, the plant process ran well in The following table summarizes the monthly effluent quality results in comparison to the effluent limits Condition 7 of Certificate of Approval #3028-AEUKDQ and Condition of Environmental Certificate of Approval (ECA) #3028-AEUKDQ (issued April 10, 2017). The Bobcaygeon WWTP has a Rated Capacity of 3,055 m3/day and a Peak Capacity of m3/day. The total final effluent flow was 1,156,975.60m 3. The average daily flow was 3,169.8 which is 103.8% of the rated capacity. A sanitary sewer flow monitoring study was completed by Civica in 2015 and identified several areas where excess I&I flow is coming into the collection system (i.e. Infiltration joints, cracks, manhole covers, etc., sump pumps, storm drain tie-ins, etc. By isolating and addressing/maintaining the main areas of concern, the number of high flow events and the flow peaking factor to the WWTP will be reduced, which will have a positive impact on the current plant process on and will defer future plant expansion/major capital upgrades and the associated costs. OCWA initiated a Facility Optimization Program (FOP) in 2017 for the Bobcaygeon WWTP. Through the FOP, a comprehensive review of plant performance was conducted. This report provides details of the program and key findings through review of background information, plant treatment performance and capacity evaluation to establish opportunities for improved plant operations. To evaluate the impact of inflow and infiltration (I&I) on the influent flows to the plant, the historical flow data was analyzed. Over a 36-month period, the average influent flow to the facility increased by 50% and the average flow exceeded the rated design capacity of 3,055 m 3 /d in 2017 by 5%. The influent concentrations became more dilute on average over the 36 month
3 period. The increased flows and decreased organic loading is an indicator of significant I&I into the collection system. Precipitation data from 2017 from the Environment Canada for the weather station nearest to Bobcaygeon (Peterborough, ON) was analyzed in to determine if there was a correlation between higher precipitation and higher flows to the plant. The correlation between the periods of high influent flow and high precipitation amounts is strong, particularly in the spring season. A peak in the precipitation trend is immediately followed by a peak in the influent flow to the plant. OCWA will continue ongoing efforts to work in partnership with the City of Kawartha Lakes to reduce flows to the wastewater treatment plant. Final Effluent by Month Month Average Daily Flow (m 3 ) Maximum Daily Flow (m 3 ) Monthly Flow (m 3 ) January 2, , , February 2, , , March 3, , , April 4, , , May 4, , , June 3, , , July 3, , , August 2, , , September 2, , , October 2, , , November 2, , , December 2, , Total ,156, ECA #3028-AEUKDQ (issued April 10, 2017) Condition 9(3) describes the requirement for sample collection at the following locations, frequencies and by means of the specified sample type and analyzed for each parameter listed and all results recorded: Influent Sampling Point Parameters Sample Type Frequency BOD5 Composite Monthly Total Suspended Solids Composite Monthly Total Phosphorus Composite Monthly Total Kjeldahl Nitrogen Composite Monthly
4 Final Effluent Sampling Point Parameters Sample Type Frequency CBOD5 Composite Weekly Total Suspended Solids Composite Weekly Total Phosphorus Composite Weekly Total Ammonia Nitrogen Composite Weekly E. coli Grab Weekly ph Grab Weekly Temperature Grab Weekly Acute Lethality to Rainbow Trout and Daphnia magna Grab Quarterly Effluent Parameter Summary Carbonaceous Biochemical Oxygen Demand (CBOD5) ECA #3028-AEUKDQ sets the CBOD5 monthly average concentration limit at 25.0 mg/l and the monthly average waste loading at 76.4 kg/day. Carbonaceous Biochemical Oxygen Demand (CBOD5) Monthly Average Average Concentra tion (mg/l) Concentratio n Limit (mg/l) Complianc e Limit Achieved Averag e Waste Loadin g (kg/day ) Loadin g Limit (kg/day ) Complianc e Limit Achieved January Yes Yes February Yes Yes March Yes Yes April Yes Yes May Yes Yes June Yes Yes July Yes Yes August Yes Yes September Yes Yes October Yes Yes November Yes Yes December Yes Yes Total Suspended Solids (TSS) ECA #3028-AEUKDQ sets the TSS annual monthly concentration limit at 25.0 mg/l and the monthly average waste loading at 76.4 kg/day.
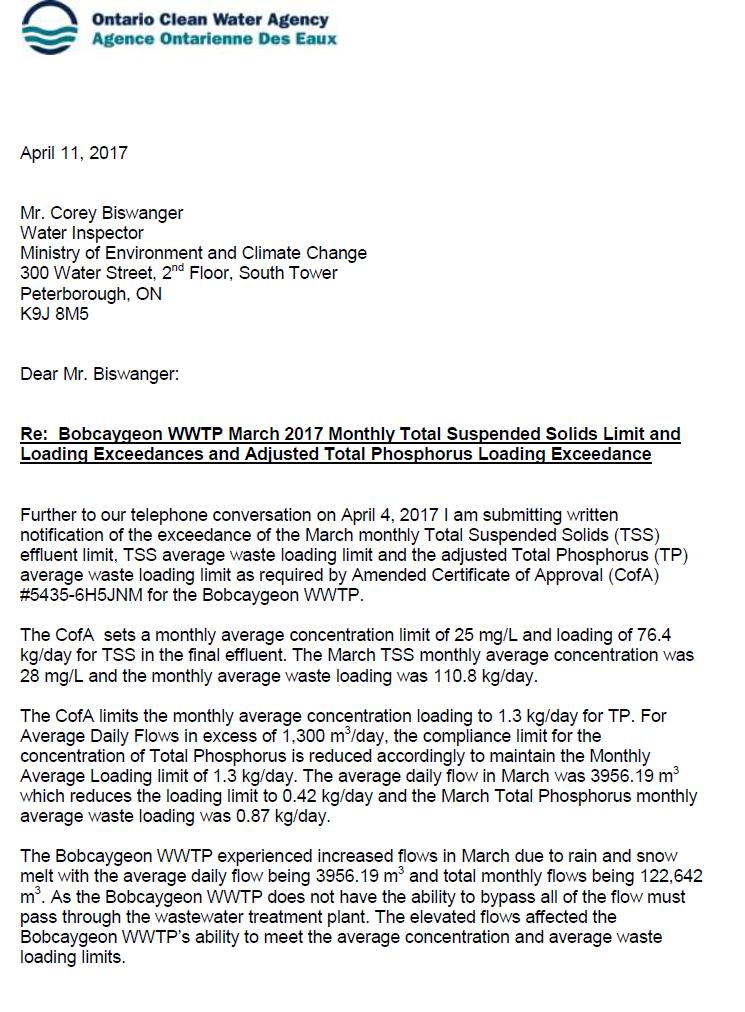
5 Total Suspended Solids (TSS) Month Average Concentration (mg/l) Concentration Limit (mg/l) Compliance Limit Achieved Average Waste Loading (kg/day) Loading Limit (kg/day) Compliance Limit Achieved January Yes Yes February Yes Yes March No No April Yes Yes May Yes Yes June Yes Yes July Yes Yes August Yes Yes September Yes Yes October Yes Yes November Yes Yes December Yes Yes The March Total Suspended Solids concentration limit and loading limit exceedance was verbally reported to the Ministry of the Environment and Climate Change Peterborough District Office on April 4, 2017 and in writing on April 11, Total Phosphorus (TP) ECA #3028-AEUKDQ sets the TP annual monthly concentration limit at 1.0 mg/l and the monthly average waste loading at 1.3 kg/day. Total Phosphorus (TP) Month Average Concentration (mg/l) Concentration Limit (mg/l) Compliance Limit Achieved Average Waste Loading (kg/day) Loading Limit (kg/day) Compliance Limit Achieved January Yes * See below February Yes * See below March Yes * See below April Yes Yes May Yes Yes June Yes Yes July Yes Yes August Yes Yes September Yes Yes October Yes Yes November Yes Yes
6 Month Average Concentration (mg/l) Concentration Limit (mg/l) Compliance Limit Achieved Average Waste Loading (kg/day) Loading Limit (kg/day) Compliance Limit Achieved December Yes Yes * Certificate of Approval H5JNM Condition 7(2)(b) indicates: For Average Daily Flows in excess of 1,300 cubic metres per day, the compliance limit for the concentration of Total Phosphorus will need to be reduced accordingly to maintain the Monthly Average Loading limit of 1.3 kilograms per day. This condition was not included in ECA #3028-AEUKDQ issued April 10, The following table provides the adjusted Total Phosphorus Monthly Average Loading Limit for average daily flows in excess of 1,300m 3 /day. The percent of excess flow was used to calculate the reduction to the loading limit. Month Average Waste Loading (kg/day) Adjusted Loading Limit (kg/day) Compliance Limit Achieved January Yes February Yes March No The March adjusted Total Phosphorus loading limit exceedance was verbally reported to the Ministry of the Environment and Climate Change Peterborough District Office on April 4, 2017 and in writing on April 11, E. Coli ECA #3028-AEUKDQ sets the monthly geometric mean density of E. Coli at 200 cfu/100ml. E.Coli Month Geometric Mean (cfu/100ml) Concentration Limit (cfu/100ml) Compliance Limit Achieved January Yes February Yes March Yes April Yes May Yes June Yes July Yes August Yes
7 Month Geometric Mean (cfu/100ml) Concentration Limit (cfu/100ml) Compliance Limit Achieved September Yes October Yes November Yes December Yes ph ECA #3028-AEUKDQ has a ph compliance limit within the range of 6.0 to 9.5, inclusive, at all times. ph Month Minimum Maximum January February March April May June July August September October November December The ph of the effluent ranged from throughout 2017 which is within the ECA compliance limit at all times. Acute Lethality to Rainbow Trout and Daphnia Magna Quarterly effluent samples are collected for analysis for acute lethality to rainbow trout and Daphnia magna and a summary of the results are provided in Appendix II: Acute Lethality Summary. All of the 2017 samples resulted in a 0% mortality rate for both Rainbow Trout and Daphnia magna. Samples were collected on January 11, April 12, August 9 and November 2, CBOD 5, Total Suspended Solids and Total Phosphorus average monthly concentrations and average monthly waste loadings were within the limits set in Condition 7 with the exception of Total Suspended Solids and the adjusted Total Phosphorus loadings in April. High loading results in March caused by high flows. All ph readings and the E.Coli monthly geomean was also within limits.
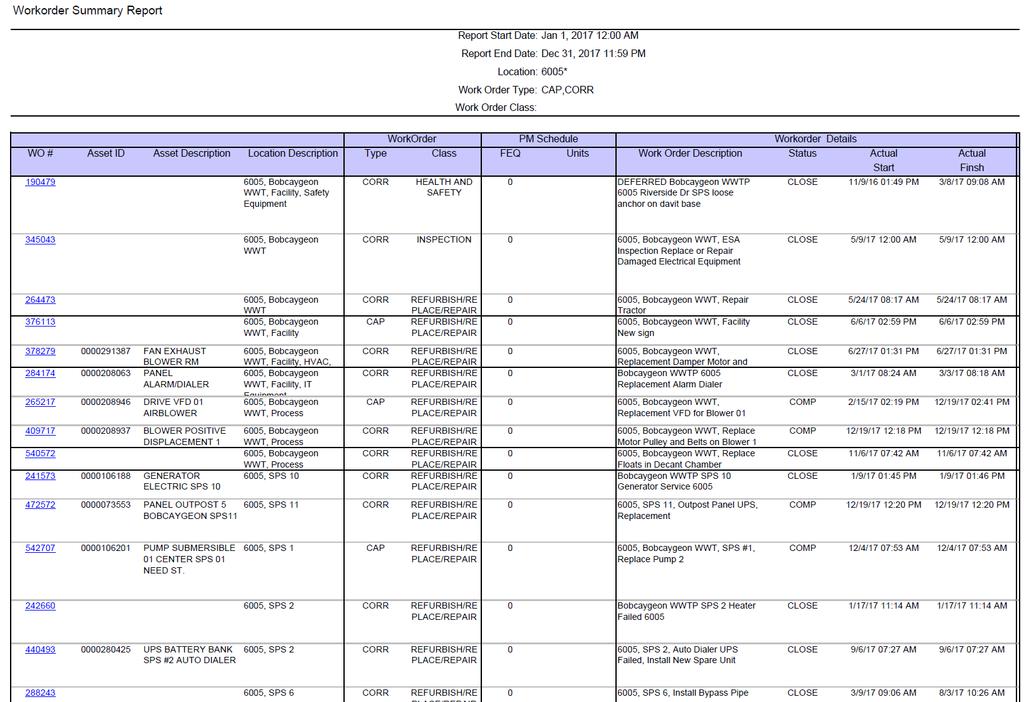
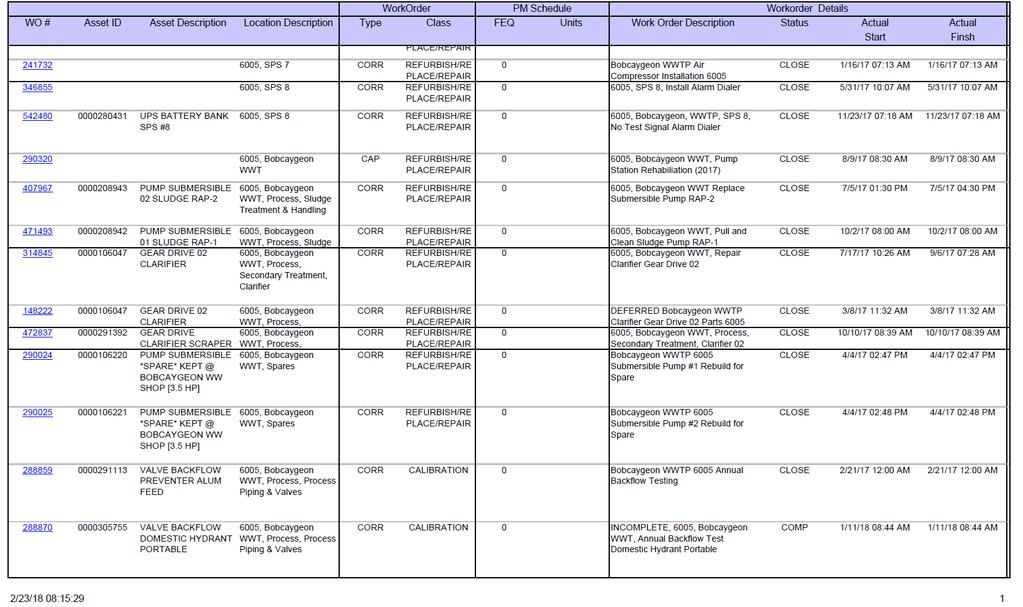
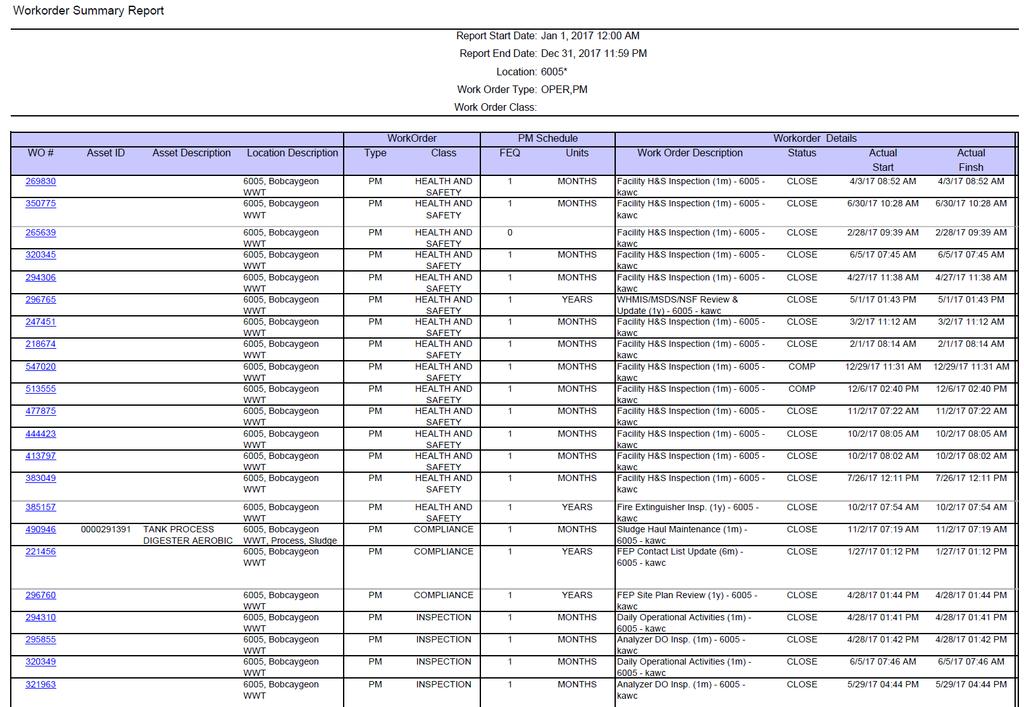
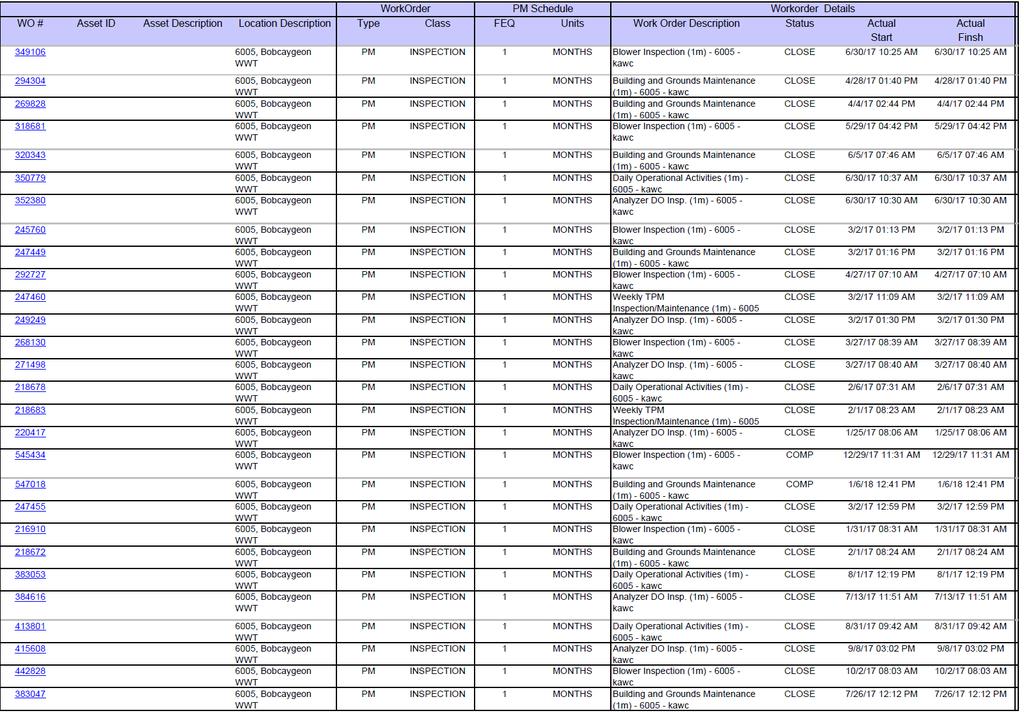
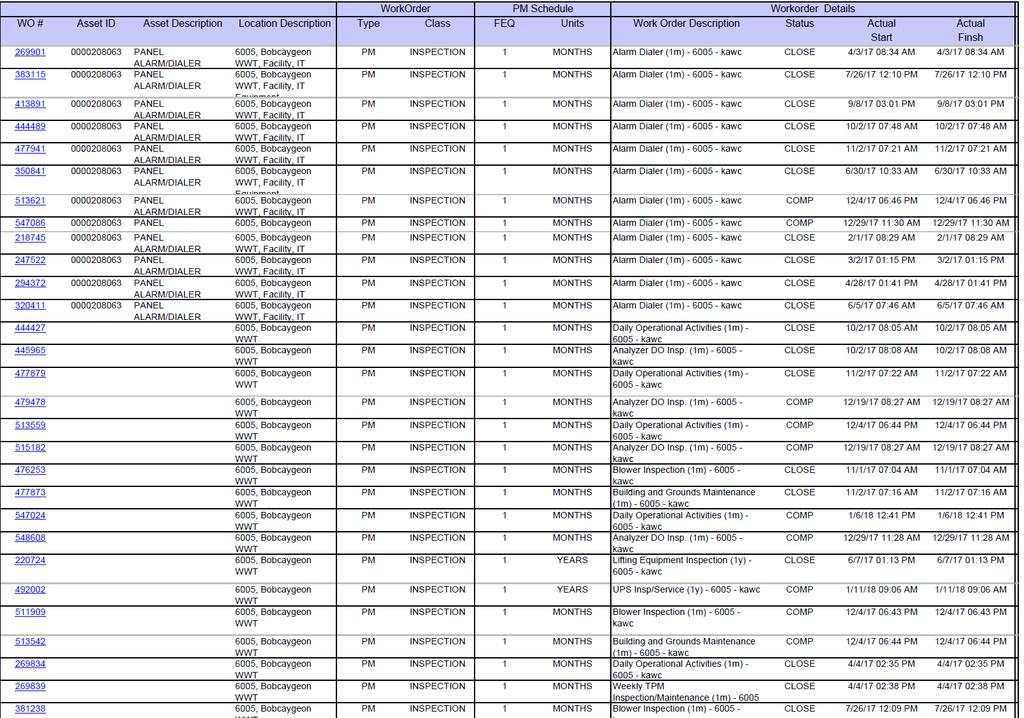
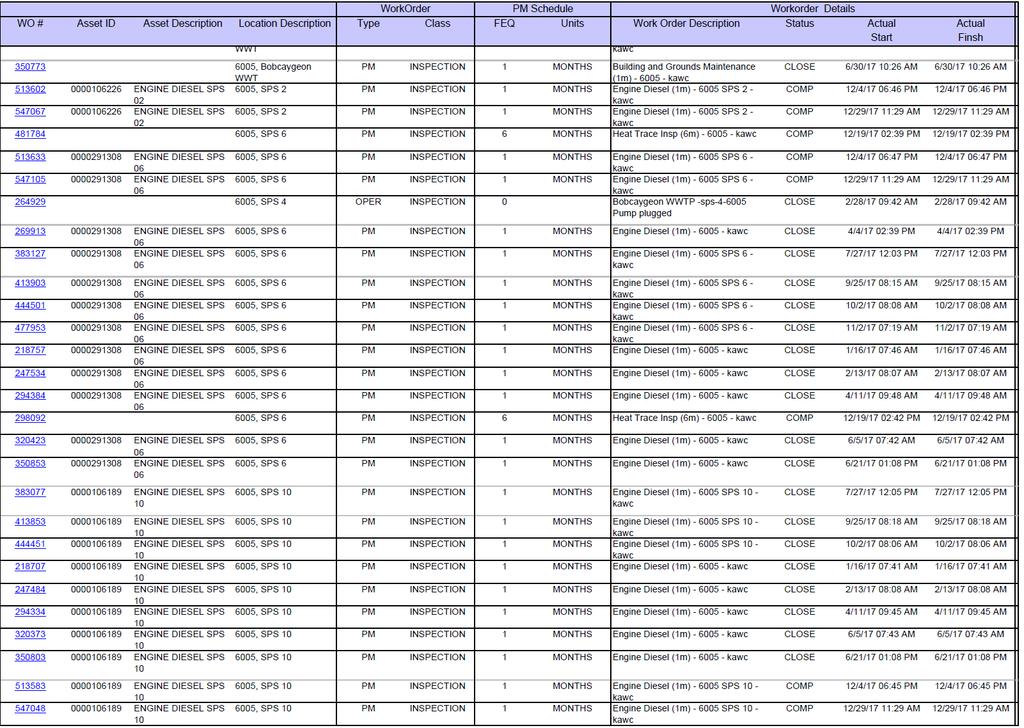
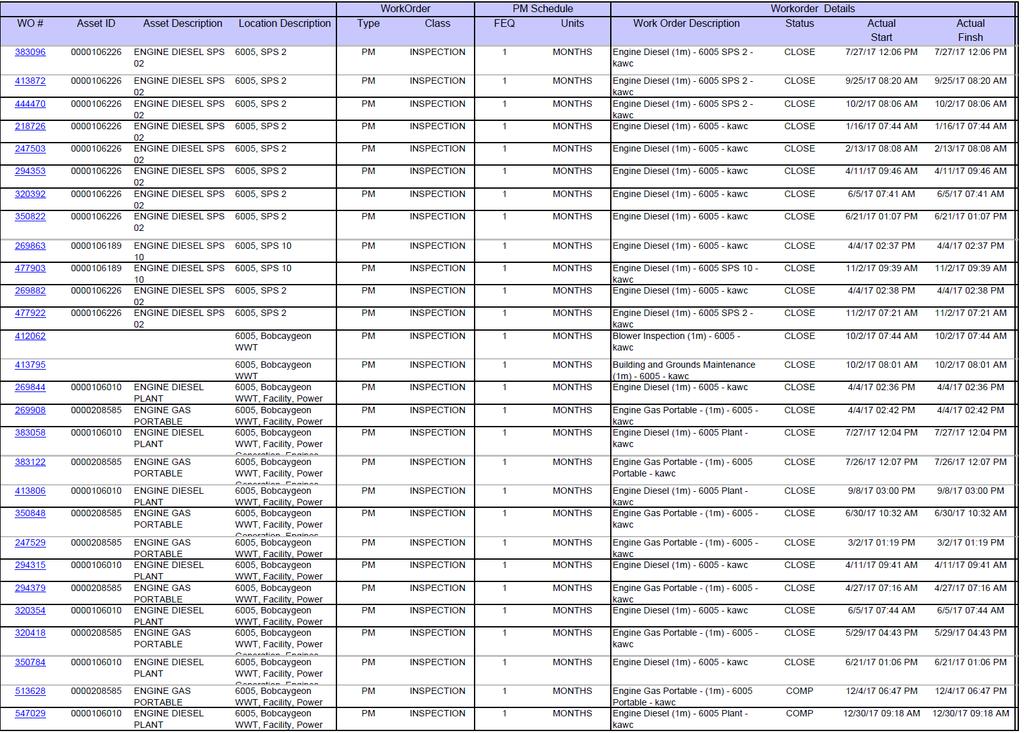
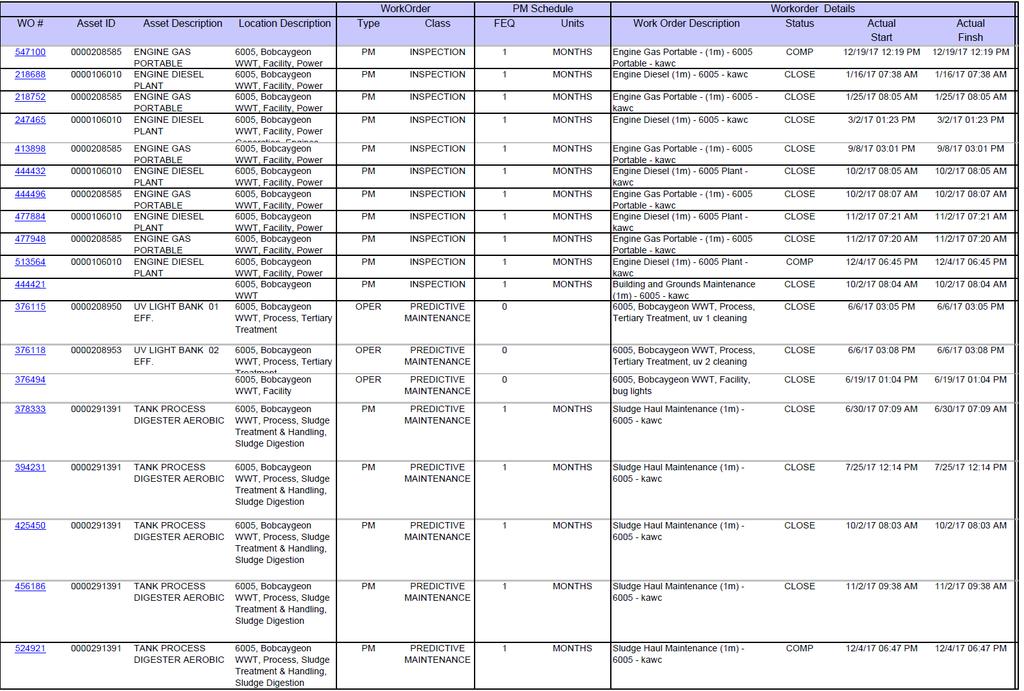
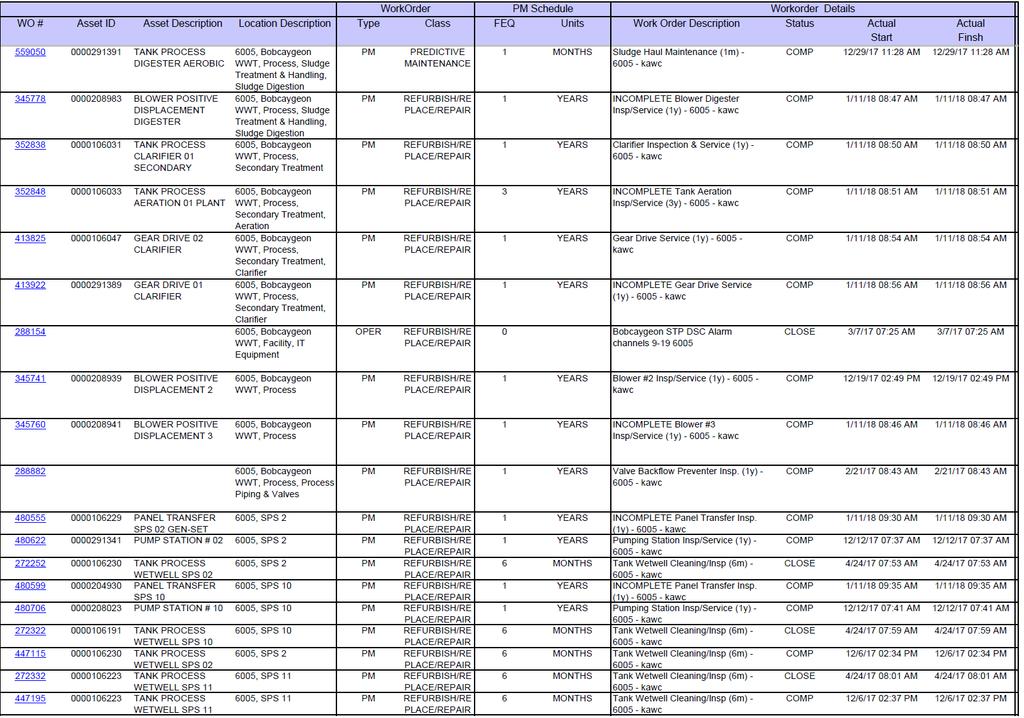
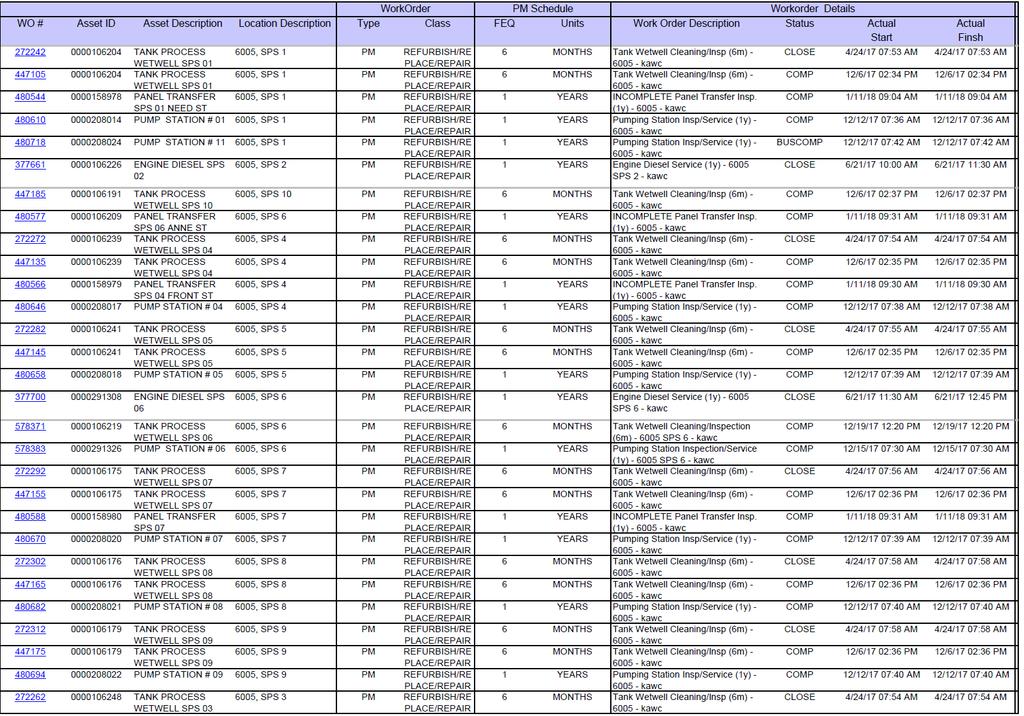
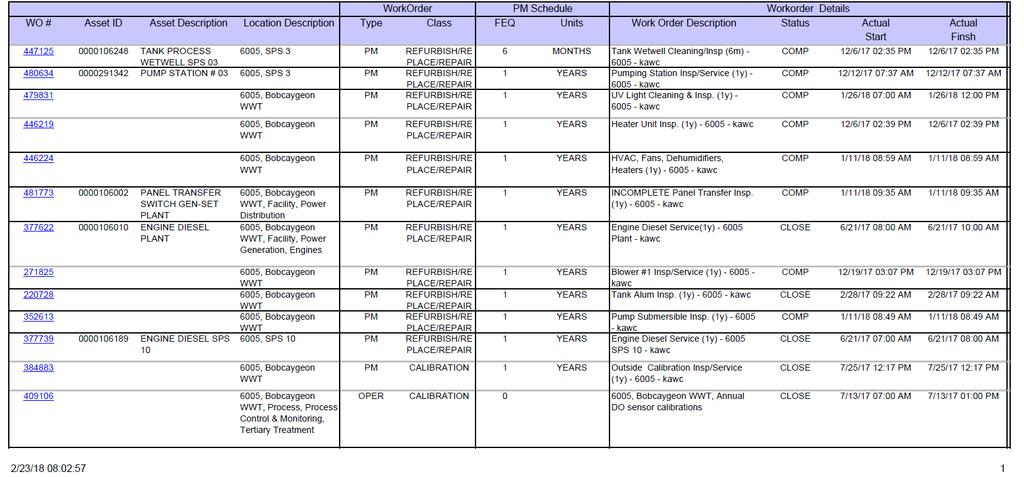
8 (b) The 2011 Ministry of the Environment Compliance Inspection Report identified odour issues as a concern with the Bobcaygeon WWTP. A requirement of the Inspection Report was to develop an action plan implementing odour control options as detailed by Cambium Environmental in their report Mitigation of Odours Bobcaygeon Water Pollution Control Plant dated October 18, The action plan included the preferred option and a timeline for installing the odour mitigation equipment. A pilot study using photoionization was implemented at the Bobcaygeon WWTP in 2013 and the results indicated that this method was not able to sufficiently achieve the desired results. Further studies are planned with alternative technologies. Operational measures currently in place to reduce odour complaints from nearby residents are: Operational staff continue to monitor wind direction Potential odour producing maintenance activities continue to be minimized during unfavorable wind direction (if at all possible) Potential odour causing activities are scheduled to reduce the impact on local residents as much as possible. (c) OCWA uses a Work Maintenance System (WMS). WMS is a maintenance tracking system that can generate work orders as well as give summaries of completed and scheduled work. During the year, the operating authority at the facility generates scheduled work orders on a weekly, monthly and annual basis. The service work is recorded in the work order history. This ensures routine and preventive maintenance is carried out and assets are maintained to manufacturer s and/or industry standards. Emergency and capital repair maintenance is completed and added to the system. Significant upgrades/repairs performed to major equipment in 2017 include: Replacement exhaust fan damper motor and controller Replacement Blower #1 VFD Replacement floats in decant chamber Replacement pump in SPS #1 Replacement heater in SPS #2 Installation of pipe for bypass pump to hook onto at SPS #3 Installation of air compressor Installation of flygt flush valves at SPS #8 and SPS #9 Replacement of sludge submersible pump Repair clarifier gear drive Rebuild two spare submersible pumps Repair clarifier 2 sludge collecting flygts Refer to Appendix II: Maintenance Summary.
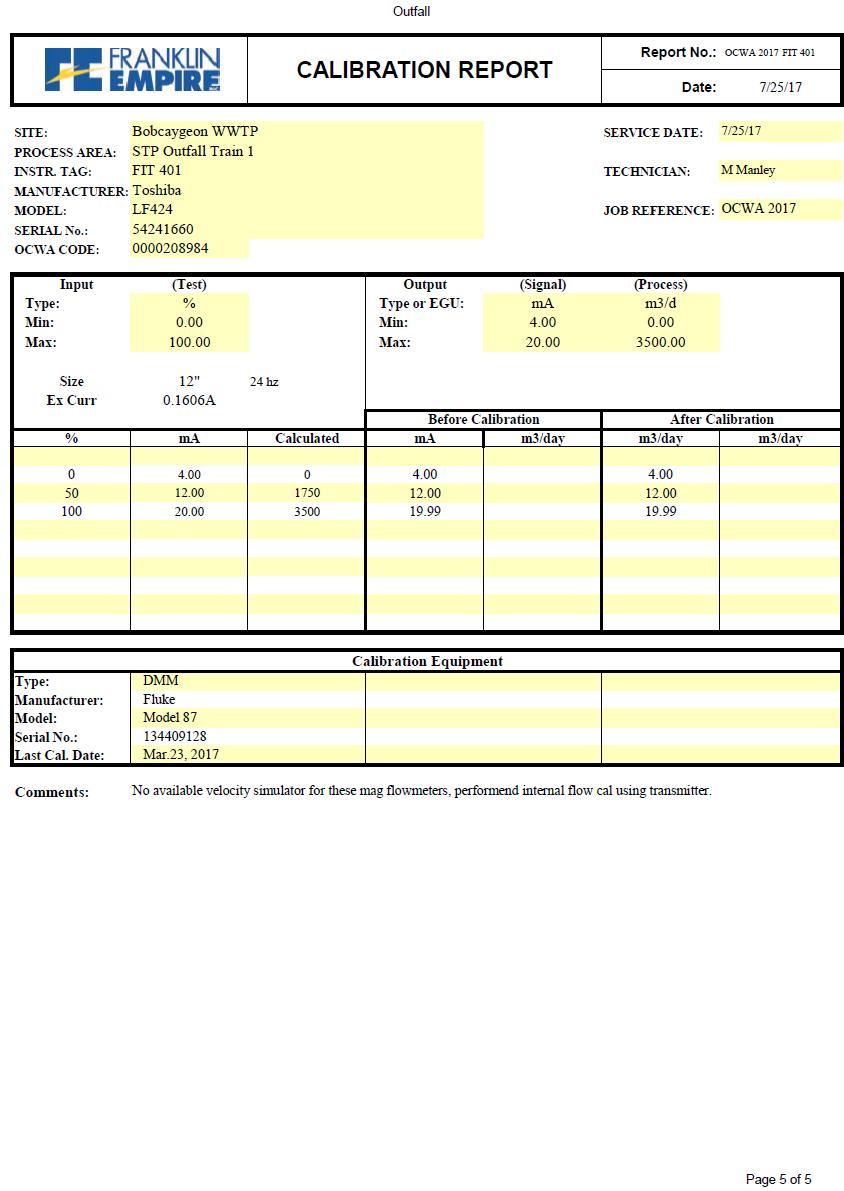
9 (d) Effluent quality assurance is maintained in several ways. Laboratory samples are sent to an accredited laboratory (SGS Lakefield) for analysis of all effluent parameters. Sampling calendars issued to the operator denote frequency of sampling and these calendars are submitted to the Process Compliance Technician at the end of each month. Raw and effluent samples are collected as per the Certificate of Approval and the results are reviewed on a regular basis to ensure compliance with the site s objectives and limits. Work orders illustrating all scheduled and preventative maintenance to be completed are issued to the operator and/or mechanic. OCWA conducts internal audits of the facility and develops Action Plans to ensure deficiencies are identified. Continuous phosphorus removal is achieved with the dosing of aluminum sulfate. A summary of its use and dosage is below: Month Aluminum Aluminum Sulfate (kg) Sulfate Dosage (mg/l) January February March April May June July August September October November December (e) Calibration of both Plant 1 and Plant 2 flow meters was conducted as part of the regular scheduled annual calibrations. Please see Appendix III: Calibration Report. (f) OCWA uses a number of best efforts to achieve the Effluent Objectives. Effluent quality assurance and control measures include in-house sampling and testing for operational parameters such as suspended solids, ph, phosphorus, dissolved oxygen, etc. In-house testing provides real time results which are then used to enhance process and operational performance. OCWA also collects raw sewage and effluent samples as per the ECA and reviews these results on a regular basis to ensure compliance with the ECA objectives and limits. OCWA uses a computerized maintenance management system which generates work orders to ensure maintenance of equipment is proactively performed. In addition, OCWA provides regular status reports to the Owner which includes operational data,
10 equipment inventory, financial statements, maintenance activities and capital improvement recommendations. OCWA has developed comprehensive manuals detailing operations, maintenance, instrumentation and emergency procedures. To ensure facilities are operated in compliance with applicable legal requirements, facility staff have access to a network of operational compliance and support experts at the hub, region and corporate level. The Bobcaygeon WWTP was able to consistently meet the Effluent Objectives throughout 2017 with the exception of: Total Suspended Solids March and April ph One reading in September and two readings in October Carbonaceous Biochemical Oxygen Demand (CBOD5) ECA #3028-AEUKDQ sets the CBOD5 monthly average concentration objective at 15.0 mg/l. Carbonaceous Biochemical Oxygen Demand (CBOD5) Monthly Average Average Concentration Concentration Objective Objective Achieved (mg/l) Target (mg/l) January Yes February Yes March Yes April Yes May Yes June Yes July Yes August Yes September Yes October Yes November Yes December Yes
11 Total Suspended Solids (TSS) ECA #3028-AEUKDQ sets the TSS monthly average concentration objective at 15.0 mg/l. Total Suspended Solids (TSS) Month Average Concentration (mg/l) Concentration Objective Target (mg/l) Objective Achieved January Yes February Yes March No April No May Yes June Yes July Yes August Yes September Yes October Yes November Yes December Yes Total Phosphorus (TP) ECA #3028-AEUKDQ sets the TP monthly average concentration objective at 0.5 mg/l. Total Phosphorus (TP) Month Average Concentration Concentration Objective Objective Achieved (mg/l) Target (mg/l) January Yes February Yes March Yes April Yes May Yes June Yes July Yes August Yes September Yes October Yes November Yes December Yes
12 E.Coli ECA #3028-AEUKDQ sets the monthly E.Coli geometric mean objective at 100 cfu/100ml. E.Coli Month Geometric Mean (cfu/100ml) Concentration Objective Target (cfu/100ml) Objective Achieved January Yes February Yes March Yes April Yes May Yes June Yes July Yes August Yes September Yes October Yes November Yes December Yes ph With the exception of three readings, the ph of the effluent ranged from throughout 2017 which is within the ECA design objectives of 6.5 to 8.5, inclusive, at all times. The three readings which are outside the design objectives are: 6.45 on September 29, on October 5, on October 26, 2017 ph Month Minimum Maximum January February March April May June July
13 Month Minimum Maximum August September October November December Unionized Ammonia Unionized ammonia has an objective of 0.1mg/L (100 ug/l). Using total ammonia nitrogen, along with field ph and temperature, the following are the results for the monthly calculated unionized ammonia averages. The final unionized ammonia average was less than the objective each month. Unionized Ammonia (Calculated) Month Average Concentration Concentration Objective Objective Achieved (ug/l) Target (ug/l) January Yes February Yes March Yes April Yes May Yes June Yes July Yes August Yes September Yes October Yes November Yes December Yes ph The ph and temperatures for the calculations were obtained from field records. The ph and temperature used were those closest to the date and time of sample collection. Temperature The final effluent temperature ranged from 4.95 o C to 20.0 o C. The parameters listed below are collected as per ECA or regulatory requirements or for process optimization.
14 Influent Month Carbonaceous Biochemical Oxygen Demand - CBOD5 (mg/l) Biochemical Oxygen Demand - BOD5 (mg/l) Total Suspended Solids TSS (mg/l) Total Kjeldahl Nitrogen TKN (mg/l) Total Phosphorus TP (mg/l) January February March April May June July August September October November December Influent Biochemical Oxygen Demand (BOD5) samples were not collected in July, August or September, 2017 as per ECA 3028-AEUKDQ. The Ministry of the Environment and Climate Change Peterborough District Office was notified. The requirement to sample BOD came into effect in April, 2017 with the issuance of ECA 3028-AEUKDQ. (g). The total volume of sludge generated in 2017 was m 3. Shepherd Septic Services has been contracted to haul, land apply and store the Biosolids on their approved sites and certified holding lagoon during the winter. Month Volume (m 3 ) January February March April May June July August September October November December Total
15 The anticipated volume of biosolids for the next reporting period is not expected to be appreciably different from this reporting period and no change is expected from the current sludge handling methods and disposal areas currently utilized. Appendix IV: Biosolids Summary has biosolids sampling results. (h) The following complaint concerning the Bobcaygeon WWTP was received during 2017: A resident was concerned with the amount of traffic to and from the Bobcaygeon WWTP by haul trucks. Operator spoke with the resident and explained the necessity of the trucks and hauling biosolids from the plant. (i) There were not any spills, by-passes or abnormal discharge events during (j) Nothing additional to report at this time. (k) A summary of all modifications completed as a result of Schedule B, Section 3 are included in Appendix II: Maintenance Summary ; and (l) The Water Supervisor has not requested any additional information be included in this report. End.
16
17
18
19
20
21
22
23
24
25
26
27
28
29
30
31
32
33
34
35
36
37
38
39
40
41
42
43
44
45
46
47
48