The University of Minnesota Water Resources Center: My Vision, My Experience
|
|
|
- Herbert Caldwell
- 5 years ago
- Views:
Transcription

1 The University of Minnesota Water Resources Center: My Vision, My Experience Mark B. David University of Illinois at Urbana-Champaign November 20, 2014
2 What I will cover vision for a water resources center in Minnesota land with a diversity of water resources current activities possible directions this would be developed as I knew more how am I prepared for this academic training research, teaching, and outreach experience leadership I like snow recent water quality work examples
3 Disclaimer difficult to state vision without talking to stakeholders, understanding resources my first task as director would be a visiting and listening tour tens of thousands of lakes, streams and rivers, Lake Superior, and the Mississippi River I want to see and hear about the water resource issues of the state university, state, farm groups, NGOs, and public former director (who left a strong center)
4 Current/recent programs onsite sewage treatment program wetland delineator certification program conservation drainage field days Minnegram reports and guides research symposiums Minnesota Water Conference Climate change impacts on water resources
5 Center vision the land-grant resource in the state, providing research, education, and outreach known for strong science in water issues in both the state and nationally one of 54 water resource institutes across country education of students (Water Resources Science Graduate Program) public engagement on all aspects of water resources homeowners to farmers to communities work with, be a part of extension
6 Center vision integration of biophysical and social sciences too often focus on technological solutions without the human side center where the sciences come together to solve problems (all involve people) graduate education must include both aspects for water resource issues strong linkages to other centers, departments, agencies, groups on and off campus

")
7 My preparation broad academic training a wide range of aquatic systems a variety of watersheds integrated projects research (biophysical and social) education outreach


8 Teaching experience introductory courses to graduate intro to NRES in various formats a range of field courses on water resources ecosystem biogeochemistry for graduate students seminar/discussion courses for graduate students courses have a wide diversity of students should all students take a environmental science course?

9 Leadership graduate and teaching coordinator positions in department associate head, acting head research teams various positions in agronomy society led Illinois Science Assessment team that is basis for the Nutrient Loss Reduction Strategy

10 Outreach experience dozens of talks to a wide range of groups within and outside of Illinois extensive interaction with farm and point source communities present best information possible

11 Illinois Nutrient Loss Reduction Strategy led science assessment riverine loads, nutrient sources methods to reduce losses costs and application across the state point and non point peer reviewed public process still underway
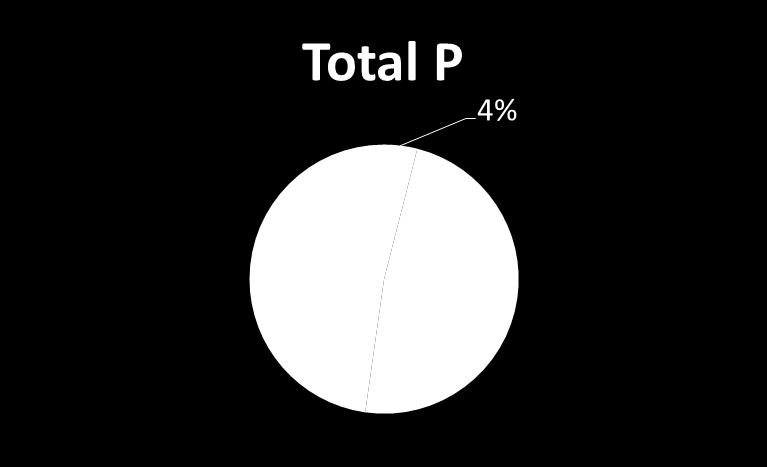
12 Point and agricultural sources ( ) Nitrate-N Total P Vermilion Green Rock Illinois Embarras Kaskaskia Little Wabash Big Muddy Illinois-All Goal Point sources Agricultural Goal Riverine Load (million lb N or P yr -1 )
13 Nitrate-N and Total P Targets 800 Nitrate-N 70 Total P Nitrate-N or Total P Load (million lb N or P yr -1 ) Red line is target, purple is average 1997 to 2011
14 Illinois as % of MRB Illinois Nitrate-N or Total P Load as Percent of MRB Nitrate-N Total P

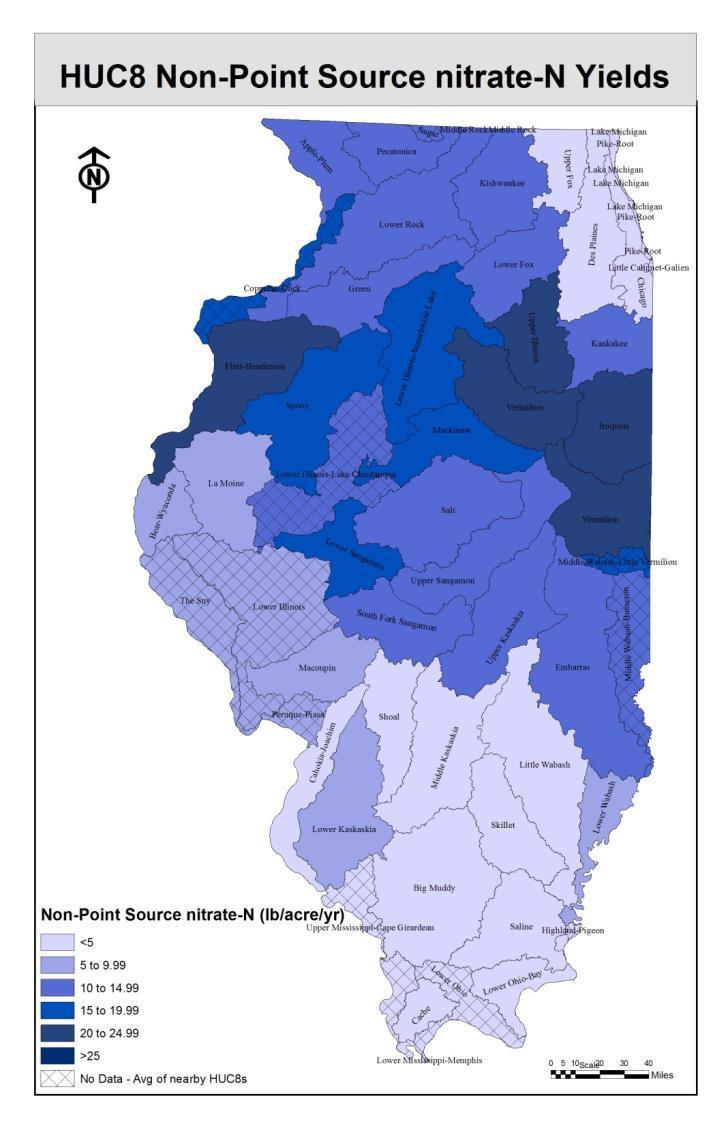
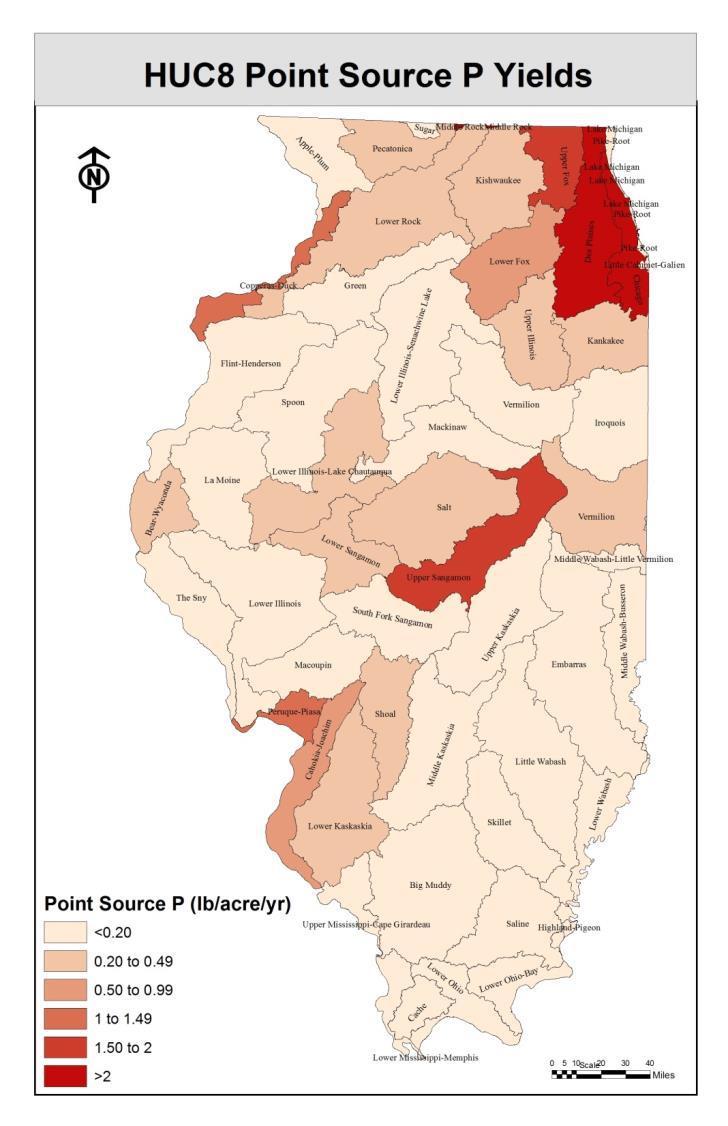
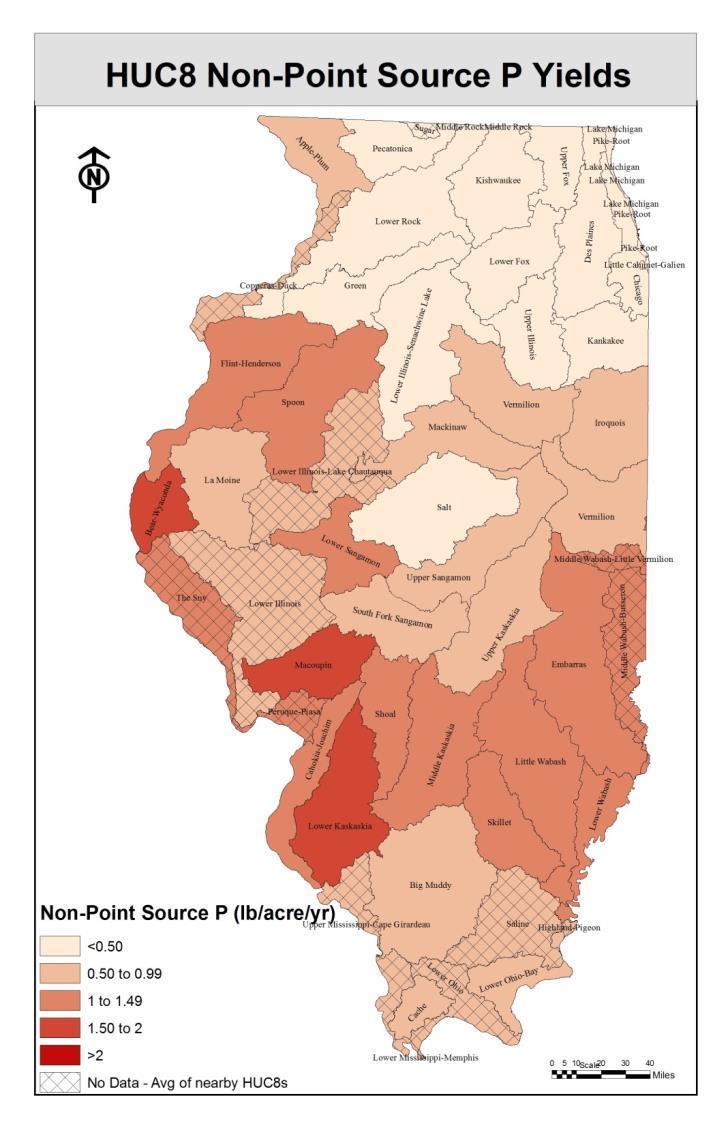
15 Illinois Nutrient Sources
16
17


18 What agricultural practices are available? three types of conservation practices could help nutrient-use efficiency (4Rs) in-field management (cover crops, drainage water management, complex rotations, perennials) off-site measures (wetlands, bioreactors, two stage ditches, riparian buffer strips, saturated buffers)


19 Cover crops - annual ryegrass and radish - aerial seeding Tile installation is faster than ever Pattern systems on 25 m spacing
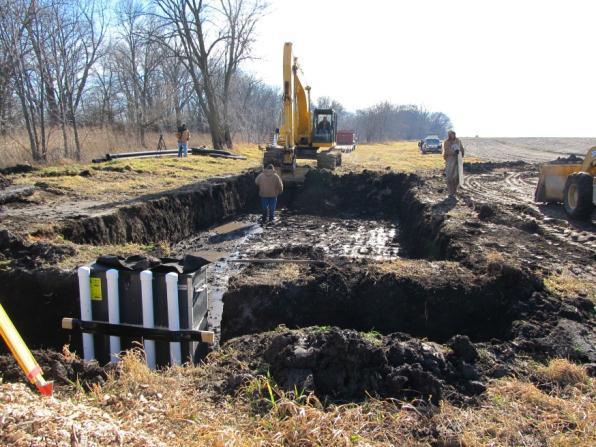
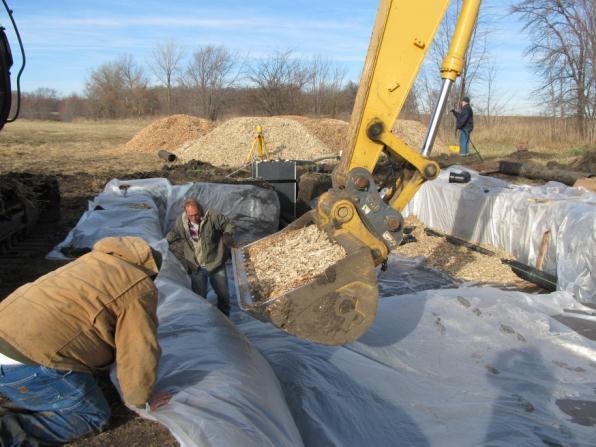
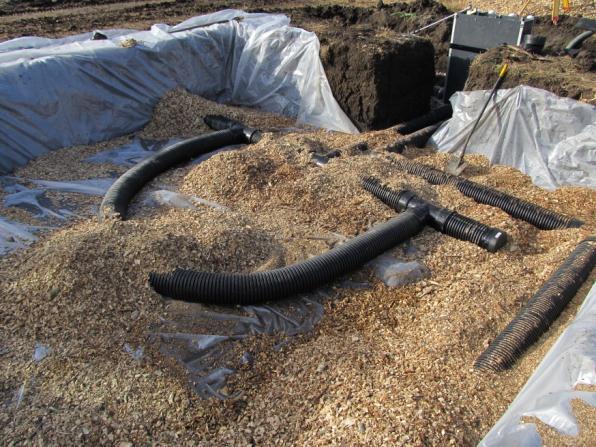
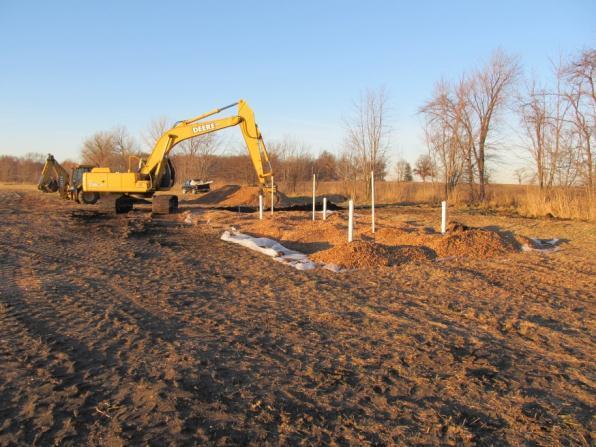
20 Woodchip bioreactors

21 Constructed wetlands

22 Point source P and N removal Cost ($/lb P or N) Total P Total N $13.71/lb for total P at 1.0 mg/l $3.30/lb for total N at 10 mg/l
23 In-field Example Statewide Results for N Practice/Scenario Nitrate- N reduction per acre (%) Nitrate- N reduced (million lb N) Baseline 410 Reducing N rate from background to the MRTN (10% of acres) Nitrification inhibitor with all fall applied fertilizer on tile-drained corn acres Split (50%) fall and spring (50%) on tile-drained corn acres Nitrate-N Reduction % (from baseline) Cost ($/lb N removed) to Fall to spring on tile-drained corn acres 15 to Cover crops on all corn/soybean tile-drained acres Cover crops on all corn/soybean non-tiled acres
24 Edge-offield In-field Example Statewide Results for N Practice/Scenario Nitrate- N reduction per acre (%) Nitrate- N reduced (million lb N) Baseline 410 Reducing N rate from background to the MRTN (10% of acres) Nitrate-N Reduction % (from baseline) Cost ($/lb N removed) Nitrification inhibitor with all fall applied fertilizer on tile-drained corn acres Split (50%) fall and spring (50%) on tile-drained corn acres to Fall to spring on tile-drained corn acres 15 to Cover crops on all corn/soybean tile-drained acres Cover crops on all corn/soybean non-tiled acres Bioreactors on 50% of tile-drained land Wetlands on 25% of tile-drained land Buffers on all applicable crop land (reduction only for water that interacts with active area)
25 Land use change Edge-offield In-field Example Statewide Results for N Practice/Scenario Nitrate- N reduction per acre (%) Nitrate- N reduced (million lb N) Baseline 410 Reducing N rate from background to the MRTN (10% of acres) Nitrate-N Reduction % (from baseline) Cost ($/lb N removed) Nitrification inhibitor with all fall applied fertilizer on tile-drained corn acres Split (50%) fall and spring (50%) on tile-drained corn acres to Fall to spring on tile-drained corn acres 15 to Cover crops on all corn/soybean tile-drained acres Cover crops on all corn/soybean non-tiled acres Bioreactors on 50% of tile-drained land Wetlands on 25% of tile-drained land Buffers on all applicable crop land (reduction only for water that interacts with active area) Perennial/energy crops equal to pasture/hay acreage from Perennial/energy crops on 10% of tile-drained land
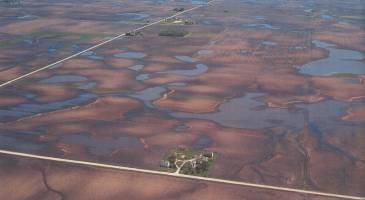
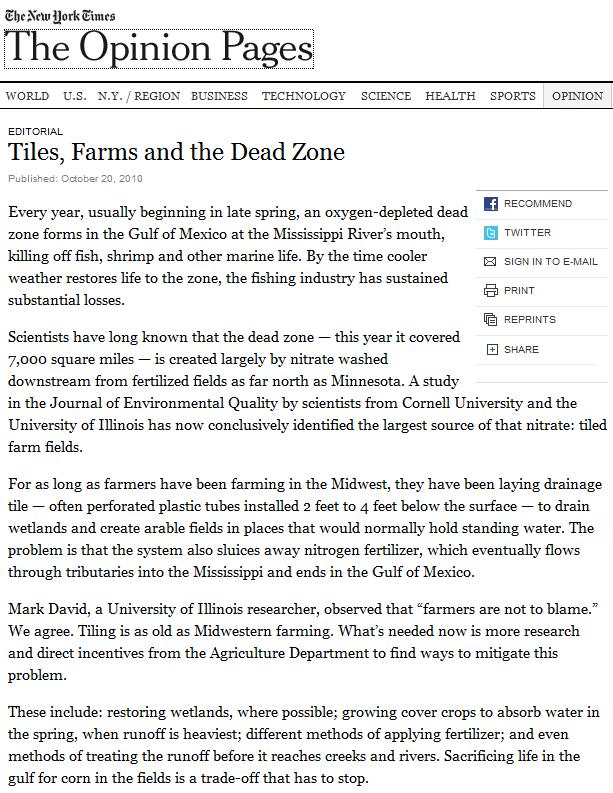
26 Point source Land use change Edge-offield In-field Example Statewide Results for N Practice/Scenario Nitrate- N reduction per acre (%) Nitrate- N reduced (million lb N) Baseline 410 Reducing N rate from background to the MRTN (10% of acres) Nitrate-N Reduction % (from baseline) Cost ($/lb N removed) Nitrification inhibitor with all fall applied fertilizer on tile-drained corn acres Split (50%) fall and spring (50%) on tile-drained corn acres to Fall to spring on tile-drained corn acres 15 to Cover crops on all corn/soybean tile-drained acres Cover crops on all corn/soybean non-tiled acres Bioreactors on 50% of tile-drained land Wetlands on 25% of tile-drained land Buffers on all applicable crop land (reduction only for water that interacts with active area) Perennial/energy crops equal to pasture/hay acreage from Perennial/energy crops on 10% of tile-drained land Point source reduction to 10 mg nitrate-n/l Point source reduction in N due to biological nutrient removal for P 8 1.8
27 Point source Land use change Edgeof-field In-field Example Statewide Results for P Practice/Scenario Total P reduction per acre (%) Total P reduced (million lb P) Baseline 37.5 Convert 1.8 million acres of conventional till eroding >T to reduced, mulch or no-till Total P Reduction % (from baseline) Cost ($/lb P removed) P rate reduction on fields with soil test P above the recommended maintenance level Cover crops on all corn/soybean acres Cover crops on 1.6 million acres eroding>t currently in reduced, mulch or no-till Wetlands on 25% of tile-drained land Buffers on all applicable crop land Perennial/energy crops equal to pasture/hay acreage from 1987 Perennial/energy crops on 1.6 million acres>t currently in reduced, mulch or no-till Perennial/energy crops on 10% of tile-drained land Point source reduction to 1.0 mg total P/L (majors only) USLE method
28 Example Statewide N & P Scenarios Name Combined Practices and/or Scenarios NP1 MRTN, fall to spring, bioreactors 50%, wetlands 25%, no P fert. on 12.5 million ac above STP maintenance, reduced till on 1.8 million ac conv. till eroding > T, buffers on all applicable lands, point source to 1.0 mg TP/L and 10 mg nitrate-n/l NP2 NP3 MRTN, fall to spring, bioreactors 50%, no P fert. on 12.5 million ac above STP maintenance, reduced till on 1.8 million ac conv. till eroding > T, cover crops on all CS, point source to 1.0 mg TP/L and 10 mg nitrate-n/l MRTN, fall to spring, bioreactors 15%, no P fert. on 12.5 million ac above STP maintenance, reduced till on 1.8 million ac conv. till eroding > T, cover crops on 87.5% of CS, buffers on all applicable lands, perennial crops on 1.6 million ac >T, and 0.9 million additional ac. Nitrate-N (% reduction) Total P (% reduction) Cost of Reduction ($/lb) Annualized Costs (million $/year) ** ** ** 791
29 County Level Analysis of Mississippi River Basin counties in MRB (all 1768) 1997 to 2006 annual data on fertilizer, crops, animals, people, deposition predictive model from watersheds applied to all MRB counties both N and P From David et al. (2010)
30 Annual N Fertilizer Applications Fertilizer (kg N ha -1 ) From David et al. (2010)
31 Tile drainage is concentrated in the corn belt Fraction Drain of county From David et al. (2010)
32 Net N Inputs (NNI) kg nni N ha Some counties negative, N from soil mineralization
33 Linking N balances to N Export hydrology overwhelming factor channelization, tile drainage can look at watershed N export as a fraction of net N inputs most studies, about 25% however in MRB we know it is larger in critical areas can be > 100% in heavily tile drained watersheds


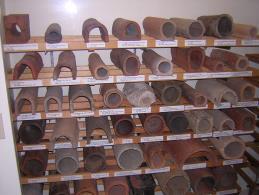
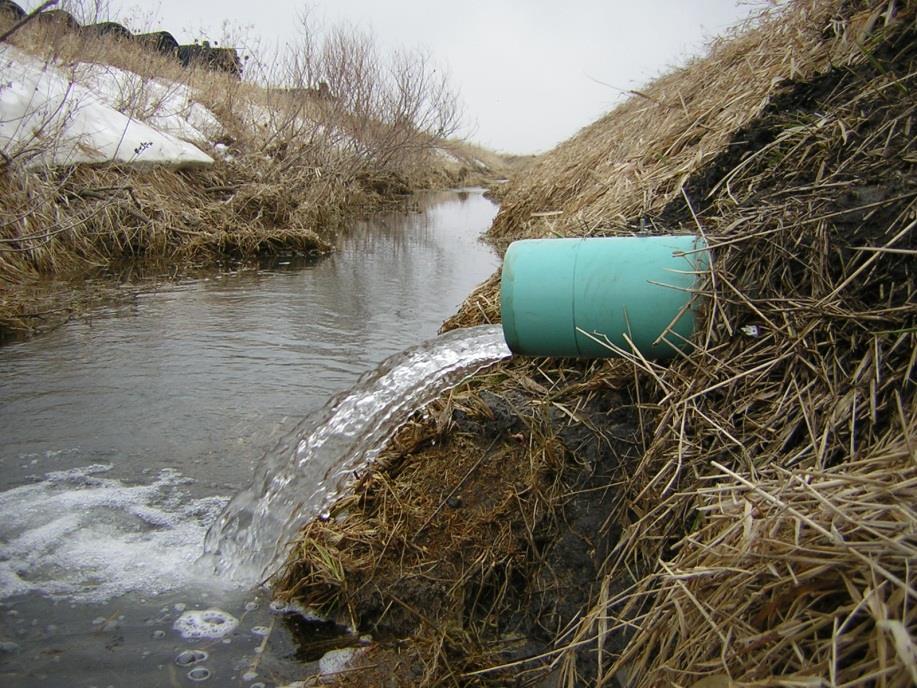
34 Drainage by tiles and ditches
35 Illinois Drainage Tile Installed Cumulative Drain Tile Produced (million feet) Year
36
37 Modeled January to June Nitrate Export Predicted N Yield (kg N/ha) Best model includes fertilizer, sewage effluent, and tile drainage
38 Fertilizer Illinois N budget through 2014 Nitrogen (kg N ha -1 ) Legume N Grain harvest Human consumption 50 Net Nitrogen Inputs NOy deposition Manure
39 Embarras River Nitrate N (mg N L -1 ) Water year
40 Importance of a Few Storm Events From Royer et al. (2006)
41 Fate of N limited in-stream losses of nitrate during high flow periods Lake Shelbyville Saylorville Reservoir retention times too short spring nitrate, headed to Gulf N Removed (%) Lake Shelbyville, Illinois Garnier et al. (1999) Royer et al. (2004) Saylorville Reservoir, Iowa Crumpton equation Depth/Time of Travel (m yr -1 )
42 Biofuels reduce tile nitrate Nitrate (mg N L -1 ) C-C-S Miscanthus Switchgrass Prairie 0 Jan-08 Jul-08 Jan-09 Jul-09 Jan-10 Jul-10 Jan-11 Jul-11 Jan-12 Jul-12 Jan-13 Jul-13 Jan-14 Jul-14 Jan-15 Date
43 Concluding remarks Minnesota WRC has great record continue/expand role as source of science and outreach for water resource issues in state central role in new nutrient reduction strategy? my background and experience have prepared me for the range of water resources in Minnesota exciting opportunity
44 Thank you