CERI Commodity Report Natural Gas
|
|
|
- Alyson Crawford
- 5 years ago
- Views:
Transcription


1 March 1 CERI Commodity Report Natural Gas Natural Gas Storage in Ontario Paul Kralovic Underground natural gas storage facilities play a vital role in the North American natural gas transmission and distribution system. While mainline gas transmission lines provide the crucial link between producing areas and the marketplace, underground gas storage facilities help to balance the supply and demand of the natural gas system particularly the dramatic divergence between the seasonal and daily variability of gas consumption and the inflexibility of gas production in North America. The amount injected or withdrawn is the difference between demand and production. other hand, is located where several natural gas pipelines intersect, connecting Canada, the southwest and the Gulf of Mexico (including the Henry Hub). Figure 1 illustrates Dawn Hub s storage operations and the various natural gas pipelines in the area, including transmission pipelines, as well as distribution pipelines and other pipelines in the region. Figure 1: Dawn Hub Infrastructure The bulk of storage in Canada is located in western Canada, with 7 Bcf of capacity, storage in Eastern Canada is located primarily in southwestern Ontario, primarily the Dawn Hub. While the Dawn Hub has long provided a location for a high-liquidity commodity market, the second largest physically traded hub in North America, 1 it is also the site of Canada s largest underground storage facility of natural gas, with a capacity of Bcf. Union Gas and Imperial Oil first agreed to store gas in the 19s, and storage began in As a storage hub, Dawn s 3 underground facilities serve Ontario, Québec, the US Northeast, the Mid-Continent, and natural gas marketers. The Dawn Facility can receive gas from western Canada, the US mid-continent, the Rockies, and the Gulf of Mexico. Dawn is located near Sarnia. The natural gas pipelines that directly connect to Dawn include the Dawn- Parkway, Dawn-Ojibway, TCPL s Mainline, Vector Pipeline and ANR-Enbridge. Chicago Citygate, on the CERI Commodity Report Natural Gas Editorial Committee: Paul Kralovic, Dinara Millington, Megan Murphy, Jon Rozhon, Allan Fogwill About CERI The Canadian Energy Research Institute is an independent, not-for-profit research establishment created through a partnership of industry, academia, and government in Our mission is to provide relevant, independent, objective economic research in energy and related environmental issues. For more information about CERI, please visit our website at or contact us at info@ceri.ca. Source: Union Gas 5 This accessible location is important for storage. The availability of multiple pipelines allows for higher capacity to withdraw gas in periods of high demand or high prices. Further, the differentials in prices at the various export locations allow for price optimization; Union Gas can choose to move gas through the highest priced pipeline. Local Distributing Companies (LDCs) are able to purchase and store natural gas during the summer months, a lower price period, and utilize the gas over the winter months.
2 Page It is important to note that while western Canadian storage is used primarily for managing producer and pipeline supplies, Dawn storage in Eastern Canada is used almost exclusively by LDCs and large end-use customers to meet winter demand in Ontario and Québec. However, it is important to mention that Québec utilizes Dawn s storage to supplement its own limited natural gas capacity. The province is home to two storage caverns: Point-du-Lac has a working capacity of. Bcf and Saint-Flavien has a working capacity of. Bcf. 7 The combined capacity is small relative to the storage elsewhere in the country, leading to increases in the enduser price of natural gas in Québec, even when the commodity itself is inexpensively priced. Dawn of a New Era The Dawn Hub is well connected to western Canadian gas fields as well as to those in the US, including the Marcellus Shale and the Utica Shale. And in many ways, Dawn operations have been influenced by the unprecedented unconventional natural gas production growth. Fueled by shale gas production in the Marcellus and Utica Shale, the North American natural gas market has been transformed by the emergence of unconventional gas developments. Both shale plays are located in the enormous Appalachian Basin, the largest hydrocarbonbearing basin in the Lower-, and in close proximity to Dawn. The Marcellus alone produced over 17 Bcfpd in the first part of 1, impacting directly the economies of Pennsylvania, West Virginia, Ohio, and New York. There are many, wide-ranging reverberations from the recent, unparalleled production growth. The Marcellus and underlying Utica Shale have had a dramatic impact on natural gas flows, not only in the US but elsewhere on the continent. This has changed supply dynamics dramatically. Western Canadian natural gas producers are facing pressure to compete with lower-priced gas from the US Northeast. Canadian gas is being pushed out of the US Northeast and US Midwest markets, where that gas once held a dominant position. Regional pipeline monthly export volumes are illustrated in Figure, showing Canadian pipeline exports to the West, Midwest, East and South regions of the US. Figure : Western Canadian Natural Gas Export Volumes by Region (Bcfpd) Source: NEB, 9 CERI Not only is western Canadian natural gas being pushed out of the US Northeast and US Midwest markets, it is also being driven out of central Canada. Imports of US gas into central Canada have been increasing since 7, reaching as high at 3. Bcfpd in US gas exports into Canada, delivered into Ontario and Québec border points, have increased from 93.1 MMcfd in to.1 Bcfd in 1 1 but subsequently dropped to 1.9 Bcfpd in The top five largest importing points of entry include Courtright (Vector Pipeline Canada and Vector Pipeline US), Niagara Falls (TransCanada Pipeline and Tennessee Gas Pipeline-National Fuel Gas Supply), Ojibway (Windsor-Detroit) (Union Gas-Panhandle Eastern Pipeline), Sarnia (TransCanada Pipelines-Great Lakes Gas Transmission Company), and St. Clair (Union Gas- Michigan Consolidated). It is important to note that of the five pipelines, four of them connect through Sarnia and area, in close proximity to the Dawn storage hub. 1 Two of them, St. Clair and Windsor (Ojibway), are owned and operated by Union Gas the operator of the Dawn storage facility. 13 Dawn storage being located adjacent to the largest shale basin in North America is changing its makeup. Imports from the Marcellus and Utica shales are replacing natural gas from the Western Canadian Sedimentary Basin (WCSB), either via the TransCanada Mainline or the Great Lakes Pipeline. 1 The mainline can be divided into the Prairie Segment, Northern Ontario Line, North Bay Shortcut (NBSC) and the Eastern Triangle. Branching off the 1,11-kilometer Canadian Mainline, TCPL exports natural gas south to the US at Emerson, Manitoba. This natural gas connects with TCPL s Great Lakes Gas
3 Page 3 Transmission Company (GLGT), transporting gas to St. Clair, Ontario. TCPL s exports through Emerson are decreasing, from 1.3 Bcfpd in 7 to. Bcfpd in In addition, TCPL s Eastern Triangle, the Eastern Zone of the Canadian Mainline, between North Bay, Parkway and Iroquois (near Ottawa) is being increasingly utilized by gas distributors and other large gas consumers sourcing their gas via the Dawn Hub, rather than gas from the WCSB. 1 Dawn is certainly attracting new supply to meet new storage and transportation demands, 17 taking advantage of its proximity to the most productive natural gas basin in North America. An additional 3 Bcfpd of Marcellus and Utica gas pipeline capacity is expected at Dawn by 1 via the following pipelines: Nexus (1-1.5 Bcfpd), ANR East (. Bcfpd), ETP Rover (1-1.5 Bcfpd) and TCPL, Tennessee, Empire and National Fuel (.7 Bcfpd). 1 Over the next several years, these infrastructure expansions will further link Dawn to Marcellus and Utica gas, increasing the diversity of Dawn s supply. Union Gas suggests that increased supply from the Marcellus and Utica supports the growth of Dawn Hub, increasing market depth and liquidity. 19 In addition, increased diversity of supply is expected to increase reliability as well as reduce cost savings to natural gas customers, through lower delivery costs. Whether entering Ontario or Chicago and the Midwest or the US Gulf Coast, Marcellus and Utica gas will likely continue to affect western Canadian gas production and eastern Canadian gas markets. CERI is currently examining the future of Canadian gas exports in a study to be released in late-spring 1. For additional information, go to Endnotes 1 Union Gas website, Meeting Market Demand, Patti Piett, Director, Storage & Transportation Marketing and Utilization, 15, communications/pdf/presentations/15/meeting%market% Demand.pdf, pp. 15. Spectra Energy Website, accessed March, 1, Operations/Storage/Dawn-Hub/ 3 Union Gas Website, accessed March, 1, Union Gas website, Unlocking Access to Dawn, Jim Redford, Director, Business Development and Upstream Regulation, November, 1, communications/presentations/ldcforumnov1/unlocking% Access%to%Dawn.pdf, pop.. 5 Union Gas website, Union Gas Operations Centre Storage Pools and Pipelines, (Accessed on April, 1) Intragaz website, Pointe-du-Lac Site, activities_pdl.html (Accessed April 7, 1) 7 Intragaz website, Pointe-du-Lac Site, activities_flavien.html (Accessed April 7, 1) U.S. Energy Information Administration, Marcellus Region Drilling Productivity report, March 1, drilling/pdf/marcellus.pdf 9 National Energy Board website, 1 Natural Gas Exports and Imports Summary, ntrlgssmmr/1/smmry1-eng.html#fn-rf (Accessed on February 1, 1) 1 National Energy Board, Gas Monthly Summary by Port- Volumes, 11 National Energy Board website, 15 Natural Gas Exports and Imports Summary, ntrlgssmmr/15/smmry15-eng.html (Accessed on March 31, 1) 1 US Department of Energy website, Fossil Energy, Table 1 Natural Gas Pipeline Points of Entry/Exit and Transporters, Table_1_POEE-Trasporters Rev_-7-1.pdf (Accessed on March 17, 1) 13 ibid 1 Union Gas website, Meeting Market Demand, Patti Piett, Director, Storage & Transportation Marketing and Utilization, 15, communications/pdf/presentations/15/meeting%market% Demand.pdf, pp National Energy Board website, Commodity Statistics, Monthly Summary by Port - Volumes, CommodityStatistics/Statistics.aspx (Accessed on March 17, 1) 1 Ontario Energy Board website, HSB Solomon Associates Canada, Ontario Natural Gas Background Report, March 1, Background_Report_Ontario_Natural_Gas_Ziff_13.pdf, pp Union Gas website, Focused on Continued Growth Calgary Customer Meeting, Jim Redford, Vice-President, Business Development Storage and Transportation, April, 1, media/storage-transportation/communications/pdf/ presentations/1/calgary-customer-meeting/redford.pdf, pp.. 1 Union Gas website, Ontario s Physical and Commercial Infrastructure: Readiness for Increased Reliance on Natural Gas Generation, Jim Redford, Director, Business Development and Upstream Regulation, November 19, 1, OntarioGrowingNaturalGasInfrastructure.pdf, pp, Union Gas, Ontario Infrastructure Development to, Jim Redford, Director, Business Development and Upstream Regulation, 1 NGMR Conference, pp.. Union Gas website, Transitions in Ontario s Physical and Commercial Natural Gas Infrastructure, Jim Redford, Director, Business Development and Upstream Regulation, ~/media/storage-transportation/communications/pdf/ presentations/1/transitions%to%natural%gas% Infrastructure%-%Redford.pdf, pp..
4 Page Henry Hub/AECO-C Beginning of Next Month Spot Price (US$/MMBtu) Henry Hub/Chicago Beginning of Next Month Spot Price (US$/MMBtu) Differential Henry Hub AECO-C Jan-5 Jul- Jan- Jul-9 Jan-11 Jul-1 Jan-1 Jul Differential Henry Hub Chicago Jan-5 Jul- Jan- Jul-9 Jan-11 Jul-1 Jan-1 Jul-15 SOURCE: CERI, Platts Gas Daily Price Guide. SOURCE: CERI, Platts Gas Daily Price Guide. Henry Hub/Rockies Beginning of Next Month Spot Price (US$/MMBtu) Chart Title Henry Hub/Southern California Beginning of Next Month Spot Price (US$/MMBtu) Differential Henry Hub Rockies Differential Henry Hub Southern California Jan-5 Jul- Jan- Jul-9 Jan-11 Jul-1 Jan-1 Jul-15 Jan-5 Jul- Jan- Jul-9 Jan-11 Jul-1 Jan-1 Jul-15 SOURCE: CERI, Platts Gas Daily Price Guide. SOURCE: CERI, Platts Gas Daily Price Guide. CERI Commodity Report - Natural Gas


5 SOURCE: Canadian Gas Association. SOURCE: CERI, Canadian Gas Association, Statistics Canada. Page Canadian Heating Degree Days 5-Year Avg US Heating Degree Days 5-Year Avg SOURCE: NOAA. SOURCE: CERI, NOAA, EIA. Canadian Heating Degree Days vs Residential and Commercial Consumption Degree Days 1, BCFPD 7 Degree Days Consumption 1, Jan-9 Jan-1 Jan-11 Jan-1 Jan-13 Jan-1 Jan-15 Jan-1 US Heating Degree Days vs Residential and Commercial Consumption Degree Days 1, BCFPD Degree Days Consumption 1, Jan-9 Jan-1 Jan-11 Jan-1 Jan-13 Jan-1 Jan-15 Jan-1


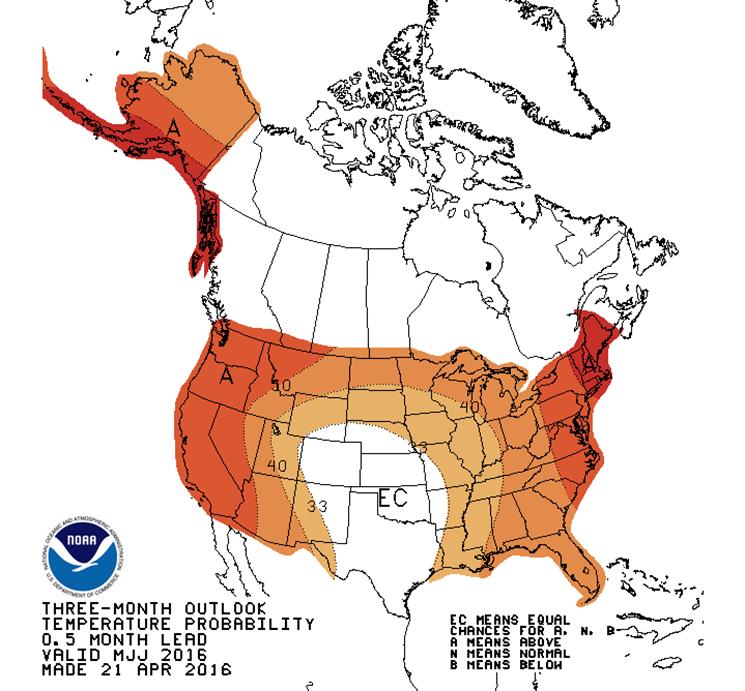
6 CERI Commodity Report - Natural Gas SOURCE: Environment Canada. SOURCE: NOAA. SOURCE: Environment Canada. SOURCE: NOAA. Page
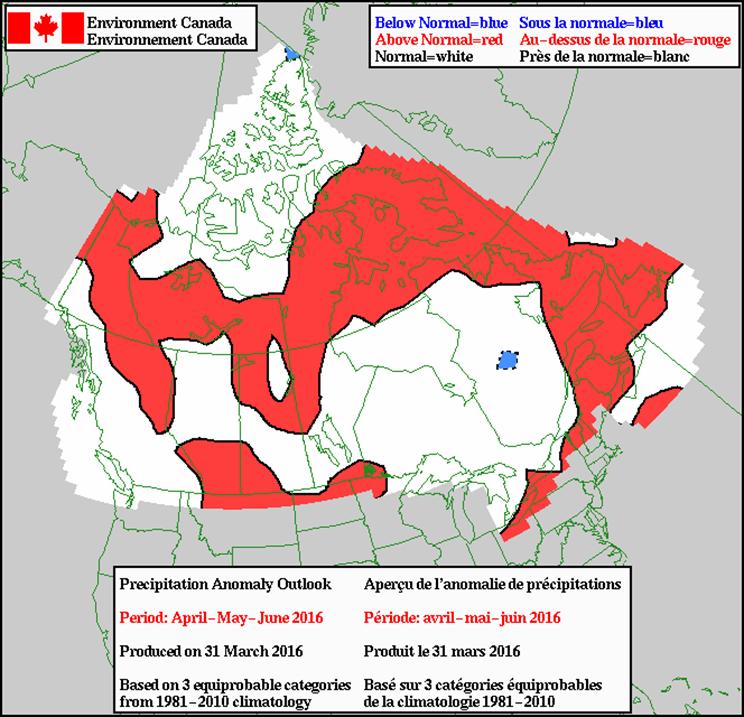
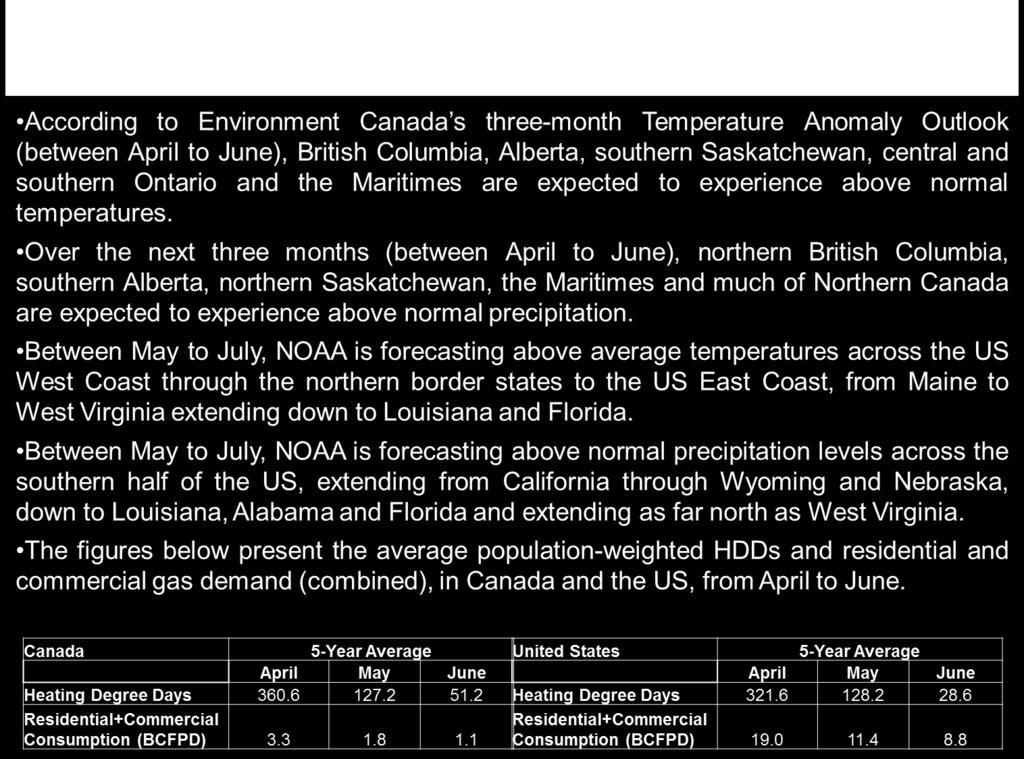
7 SOURCE: Environment Canada. SOURCE: NOAA. SOURCE: NOAA. Page 7

 1 Industrial Electric Power Commercial Residential 1 1")

8 SOURCE: Statistics Canada. SOURCE: Statistics Canada, NEB. SOURCE: EIA. SOURCE: EIA. Page Canadian Consumption By Sector (Bcfpd) 1 1 Industrial & Power Commercial Residential 1 1 Jan-9 Jan-1 Jan-11 Jan-1 Jan-13 Jan-1 Jan-15 US Consumption By Sector (Bcfpd) 1 Industrial Electric Power Commercial Residential 1 1 Jan-9 Jan-1 Jan-11 Jan-1 Jan-13 Jan-1 Jan-15 Jan-1 Canadian Marketable Production By Province/Region (Bcfpd) BC, Yukon, NWT AB SK E. Coast Jan-9 Jan-1 Jan-11 Jan-1 Jan-13 Jan-1 Jan-15 US Marketable Production (Bcfpd) 9 US Total Louisiana GOM Federal Waters Texas Jan-9 Jan-1 Jan-11 Jan-1 Jan-13 Jan-1 Jan-15 Jan-1 CERI Commodity Report - Natural Gas
 1.")
 13 1")

9 Page 9 BC, Yukon, NWT Marketable Production (Bcfpd) Saskatchewan Marketable Production (Bcfpd) Alberta Marketable Production (Bcfpd) East Coast Marketable Production (Bcfpd) SOURCE: Statistics Canada, NEB. SOURCE: Statistics Canada, NEB. SOURCE: Statistics Canada, NEB. SOURCE: Statistics Canada, NEB.
 1 15 1 Canadian Gas Exports to the US By Export Point - West (Bcfpd) Kingsgate")
 Empress McNeill AB-BC Alliance Mar-15 May-15 Jul-15 Sep-15 Nov-15")


10 Page System Field Receipts TransCanada + Westcoast; Monthly Average (Bcfpd) Canadian Gas Exports to the US By Export Point - West (Bcfpd) Kingsgate Monchy Elmore Huntingdon Feb-15 Apr-15 Jun-15 Aug-15 Oct-15 Dec-15 Feb Alberta System Deliveries (Bcfpd) Empress McNeill AB-BC Alliance Mar-15 May-15 Jul-15 Sep-15 Nov-15 Jan-1 Mar-1 Canadian Gas Exports to the US By Export Point - East (Bcfpd) Emerson Iroquois Others Niagara Feb-15 Apr-15 Jun-15 Aug-15 Oct-15 Dec-15 Feb-1 SOURCE: CERI, TCPL, Westcoast Energy. SOURCE: NEB. SOURCE: NEB. Note: Alliance deliveries were not available between Dec. 1/15 and Jan. 1/1. SOURCE: CERI, TCPL, Alliance Pipeline. CERI Commodity Report - Natural Gas

 1 1 Canada")
 West Midwest East Feb-15 Apr-15 Jun-15 Aug-15 Oct-15")
11 SOURCE: NEB. SOURCE: NEB. SOURCE: NEB, EIA. SOURCE: NEB. Page 11 US Imports of Canadian Gas By US Region (Bcfpd) 1 West Midwest East 1 Feb-15 Apr-15 Jun-15 Aug-15 Oct-15 Dec-15 Feb-1 Total US Pipeline Gas Imports (Bcfpd) 1 1 Canada Mexico 1 Jan-15 Mar-15 May-15 Jul-15 Sep-15 Nov-15 Jan Average Canadian Export Price By US Region (C$/GJ) West Midwest East Feb-15 Apr-15 Jun-15 Aug-15 Oct-15 Dec-15 Feb-1 Canadian Gas Imports By Import Point (Bcfpd) Courtright Sarnia St. Clair Other Feb-15 Apr-15 Jun-15 Aug-15 Oct-15 Dec-15 Feb-1


12 Page 1 SOURCE: US. DOE. SOURCE: US DOE. SOURCE: US DOE. Note: There were no LNG imports for the month of November 1. SOURCE: US DOE. CERI Commodity Report - Natural Gas


 Japan")


13 Page 13 SOURCE: US DOE, NEB. SOURCE: US DOE. US LNG Exports by Destination (Bcf) Japan Taiwan Brazil Feb-1 May-1 Aug-1 Nov-1 Feb-15 May-15 Aug-15 Nov-15 Feb-1 SOURCE: EIA, US DOE. SOURCE: US DOE.
14 Page 1 North American Active Rigs Canadian Rig Fleet Utilization Weekly Average Active Rigs 3, US WCSB,5 1, Active Rigs Total Rig Drilling Fleet 9, 1, , Jan- Jan-7 Jan- Jan-9 Jan-1 Jan-11 Jan-1 Jan-13 Jan-1 Jan-15 Jan-1 Jan- Jan-7 Jan- Jan-9 Jan-1 Jan-11 Jan-1 Jan-13 Jan-1 Jan-15 Jan-1 SOURCE: CERI, CAODC, Baker Hughes. SOURCE: CERI, CAODC. WCSB Active Rigs by Province Weekly Average Western Canada Active Rigs Weekly Average 7 SK AB BC 5-Year Avg Jan-9 Jan-1 Jan-11 Jan-1 Jan-13 Jan-1 Jan-15 Jan Week Number SOURCE: CERI, CAODC. SOURCE: CERI, CAODC. CERI Commodity Report - Natural Gas

15 Page 15 US Total Oil- and Gas-directed Active Rigs US Total Active Rigs, Oil-directed Gas-directed Gas-directed %,, 1, 1, 1, 1, 1, Jan-Jan-7Jan-Jan-9Jan-1Jan-11Jan-1Jan-13Jan-1Jan-15Jan-1 1% 9% % 7% % 5% % 3% % 1% %,5 Total Oil-directed GoM Gas-directed Onshore Gas-directed, 1,5 1, 5 Jan- Jan-7 Jan- Jan-9 Jan-1 Jan-11 Jan-1 Jan-13 Jan-1 Jan-15 Jan-1 SOURCE: CERI, Baker Hughes. SOURCE: CERI, Baker Hughes. US Gulf of Mexico Active Rigs 1 Oil-directed Gas-directed 1 Jan- Jan-7 Jan- Jan-9 Jan-1 Jan-11 Jan-1 Jan-13 Jan-1 Jan-15 Jan-1 SOURCE: CERI, Baker Hughes.


16 Page 1 1, ,,5, 3,5 3,,5, 1,5 1, 5 Canadian Working Gas Storage 5-Year Avg US Lower- Working Gas Storage 5-Year Avg Canadian Storage by Region 9 West East Mar-15 May-15 Jul-15 Sep-15 Nov-15 Jan-1 Mar-1 US Storage by Region,5 East Midwest Mountain Pacific South Central, 3,5 3,,5, 1,5 1, 5 Mar-15 May-15 Jul-15 Sep-15 Nov-15 Jan-1 Mar-1 SOURCE: CERI, Platt s Gas Daily. SOURCE: CERI, Platt s Gas Daily. SOURCE: CERI, Platt s Gas Daily. SOURCE: CERI, Platt s Gas Daily. CERI Commodity Report - Natural Gas


17 Page 17 WC_IJ_WD Western Canadian Storage Injections/Withdrawals 1 5-Year Avg Canadian Storage Injections/Withdrawals 15 5-Year Avg Eastern Canadian Storage Injections/Withdrawals 5-Year Avg SOURCE: CERI, Platt s Gas Daily. SOURCE: CERI, Platt s Gas Daily. SOURCE: CERI, Platt s Gas Daily.


18 Page US East Storage Injections/Withdrawals 5-Year Avg US Mountain Region Storage Injections/Withdrawals 5-Year Avg US Midwest Region Storage Injections/Withdrawals 3 5-Year Avg US Pacific Region Storage Injections/Withdrawals 5-Year Avg SOURCE: CERI, EIA. SOURCE: CERI, EIA. SOURCE: CERI, EIA. SOURCE: CERI, EIA. CERI Commodity Report - Natural Gas

19 Page US South Central Region Storage Injections/Withdrawals 5-Year Avg US Storage Injections/Withdrawals 5-Year Avg SOURCE: CERI, EIA. SOURCE: CERI, EIA.