Focusing on What Matters Most- Increasing In-Place Density
|
|
|
- Buddy Mills
- 5 years ago
- Views:
Transcription
1 Focusing on What Matters Most- Increasing In-Place Density OHMPA s Fall Asphalt Seminar Focus Remains the Same - Quality HMA Dec 1, 2016 Mark Buncher

2 FHWA Program: Enhanced Durability Through Increased In-Place Pavement Density High priority for FHWA Pavements Office in 2016 Premise: Big improvement to performance with minimal cost/ effort by using existing technologies and best practices to achieve better compaction AI: develop full-day workshop and deliver to States NCAT: Lit Review on how in-place density relates to performance 10 States: Field demo projects to improve density Full-day workshop coming to Ontario! Feb 6, 2017 Mississauga Convention Center More info soon from OHMPA
3 FHWA Program: Enhanced Durability of Asphalt Pavements through Increased In-Place Pavement Density AK HI WA OR NV CA ID AZ UT MT WY CO NM ND SD NE KS OK MN IA MO AR WI IL MS MI OH IN WV KY TN AL GA SC NY PA VA NC ME CT NJ DE MD DC TX LA Key: FL Durability Workshop Only (2017) Durability Workshop and Demonstration Project (2016) 3 PR
4 Topics during Full-day Workshop Definitions: air voids, density, compaction, durability, etc Link density to pavement durability How mix design affects compaction and durability Factors affecting compaction Compactive forces and rollers Best practices for roller operations Getting good density at longitudinal joints Tack coats Specifications, measurement, payment Improving compaction with technology
5 Today s Talk: Some Workshop Pieces
6 Evolution of Traffic Stress Interstate highways AASHO Road Test still widely used for pavement design legal truck load - 73,280 lbs. Legal load limit to 80,000 lbs % load increase 40-50% greater stress to pavement Radial tires, higher contact pressure FAST Act raising load limit to 120,000 lbs. (in select locations)

7 Led to Rutting in 1980s Courtesy of pavementinteractive.org

8 Which led to Superpave Fixed the rutting problem Gyratory compaction lowered binder contents Add in higher and higher recycled materials?
9 Durability Concerns Industry concerned with durability Premature cracking and raveling Need for more binder in the mix Many State agencies looking for ways to improve durability Minimum binder contents Optimize mix designs Balance rutting with fatigue Improved compaction has typically not been considered


10 Improved Compaction = Improved Performance A BAD mix with GOOD density out-performed a GOOD mix with POOR density for ride and rutting. WesTrack Experiment
11 Effect of In-Place Voids on Life Washington State DOT Study Percent Service Life In-situ Air Voids, % 93% 92% 91% 90% 89% Compaction Level
12 Note: This CO DOT study analyzed thinner HMA pavements than WA DOT study. Shows even faster deterioration as in-place density lowers.
13 FHWA Performance Based Mix Design Study Fatigue Cracking Rutting Design Air Voids For every 1% increase 40% increase 22% decrease Design VMA For every 1% increase 73% decrease 32% increase Compaction Density For every 1% lower in-place Air Voids 19% decrease 10% decrease Increasing Density Improves Both! Courtesy of Nelson Gibson
14 NCAT Report (2016) Literature Review on connecting in-place density to performance - 5 studies cited for fatigue life - 7 studies cited for rutting - A 1% decrease in air voids was estimated to improve the fatigue performance of asphalt pavements between 8.2 and 43.8%, to improve the rutting resistance by 7.3 to 66.3%, and to extend the service life by conservatively 10%.

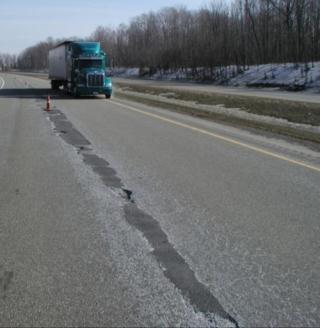
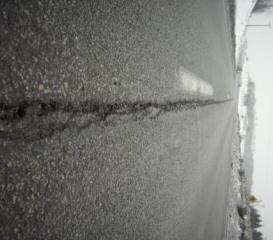
15 and then there s permeability Photo: Wes McNett Permeability at the Longitudinal joint

16 Permeability can be Catastrophic


17 Choosing a Gradation Finer Gradations More Compactable More Workable Less Permeable Requires better aggregate Higher binder contents Courtesy of NCAT

18 NCAT Permeability Study 125x10-5 cm/sec Finer NMAS mixes less permeable at equivalent air void levels! From NCAT Report 03-02


19 Reduce Permeability Design to a minimum lift thickness 3X NMAS on fine graded mixtures 4X NMAS on coarse graded mixtures Do not neglect future pavement preservation

20 Balance the Mix Design Smooth Quiet Ride Skid Resistance Strength/ Stability Rut Resistance Shoving Flushing Resistant Durability Crack Resistance Raveling Permeability DON T ATTACK ONE HALF AT THE EXPENSE OF THE OTHER HALF!!
21 Balanced Mix Design Approach General Procedure Design and test mix for Rutting Test mix for Cracking and/or Durability Performance Testing States that are using this approach Texas Louisiana New Jersey Illinois California Wisconsin
22 Two critical topics related to better in-place density and overall pavement durability Best Practices for Specifying and Constructing Longitudinal Joints Tack Coat Best Practices AI has developed half-day workshops on both of these critical topics and delivered to most States. Recorded workshops, and related info, can be viewed at:
23 Longitudinal Joints

24 Alaska Some States have more challenges than others!
 side Low Density Area Please note Cold side and Hot side, as they are terms used throughout this Workshop.")
25 We Know Unsupported Edge Will Have Lower Density Proper Overlap Sufficient Material for Roll-Down Cold (unconfined) side Hot (confined) side Low Density Area Please note Cold side and Hot side, as they are terms used throughout this Workshop.
26 The Pennsylvania LJ Example

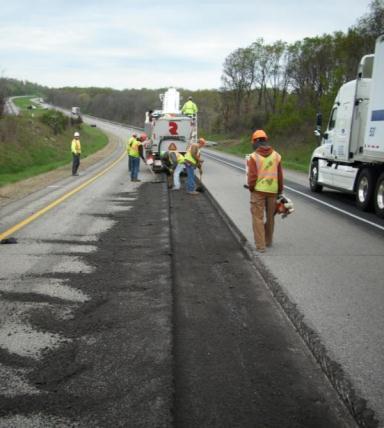
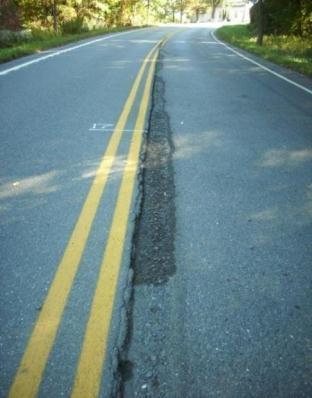
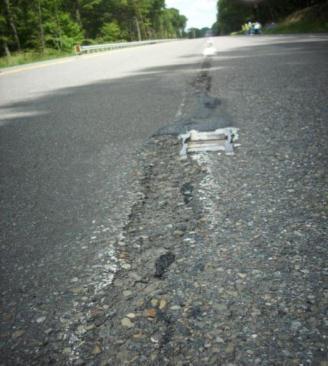
27 Joint Issues In PA
28 PA Story on Longitudinal Joint Density Article in NAPA s magazine, Asphalt Pavement, Sept/Oct Increasing density was viewed as key began measuring joint density method specification of best practices 2008 and continued gathering data on joints New joint density specification. Transition year with no bonuses or penalties bonuses and penalties on joint density
29 PA: How Did it Work? In-place Density Summary, Reported by PA DOT Year # Lots Avg. Roadway Density, %TMD Avg. Joint Density, %TMD begin measuring at Jt method spec method spec 2010 No data, transition to PWL spec PWL, LSL 89% PWL, LSL 89% PWL, LSL 89% PWL, LSL 90% PWL, LSL 90%
30 Percent Service Life PA: Increased Projected Life of Joints Due 100 to Improved Joint Density % 92% 91% 90% 89% Compaction Level

31 PA: Annual Statewide Totals on Incentives/Disincentives for Joint Density Year Incentive Payments Disincentive Payments 2011 $268K $99K 2012 $489K $63K 2013 $588K $25K 2014 $1,002K $127K Note: MI and CT have averaged over 91.5%, and AK over 92.0% density at the joint over recent construction seasons


32 Why Is Tack Coat So Important Bond All Layers to avoid: Slippage Delamination Shoving Increased rutting Difficulty in compaction Reduced fatigue life Up to 75% loss of life Tack ~1% of paving cost Poor Bond Exacerbated by: Thinner lifts Higher RAP/RAS Perpetual pavement after 8-10 yrs. Coring revealed debonding. MO Interstate
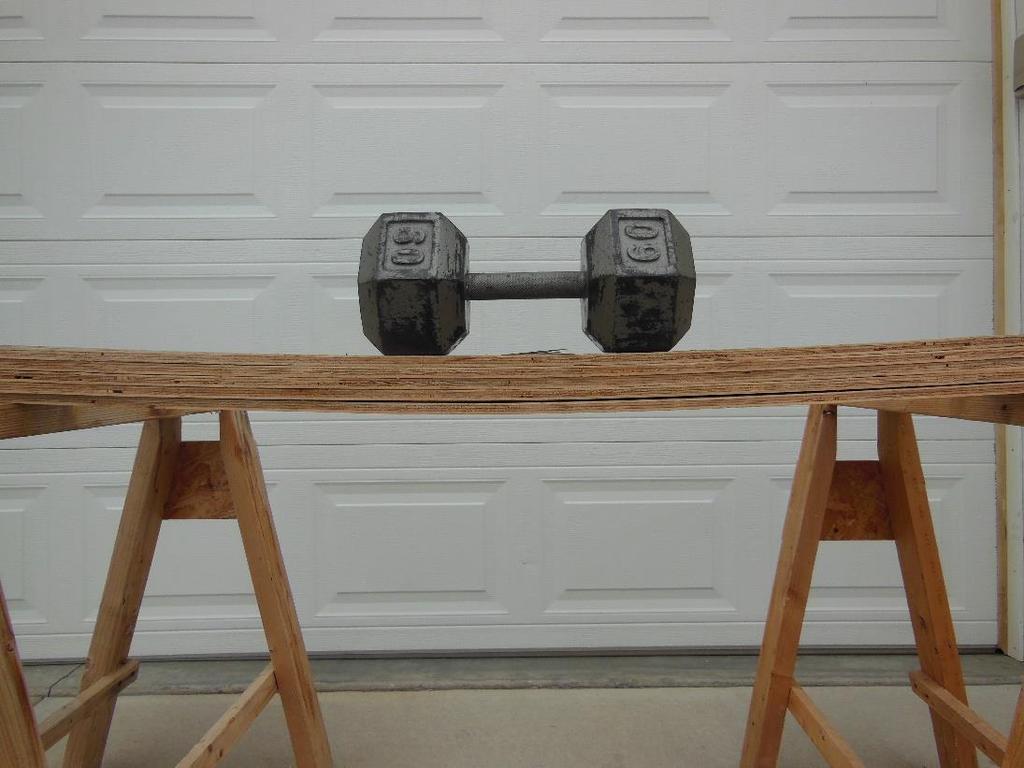
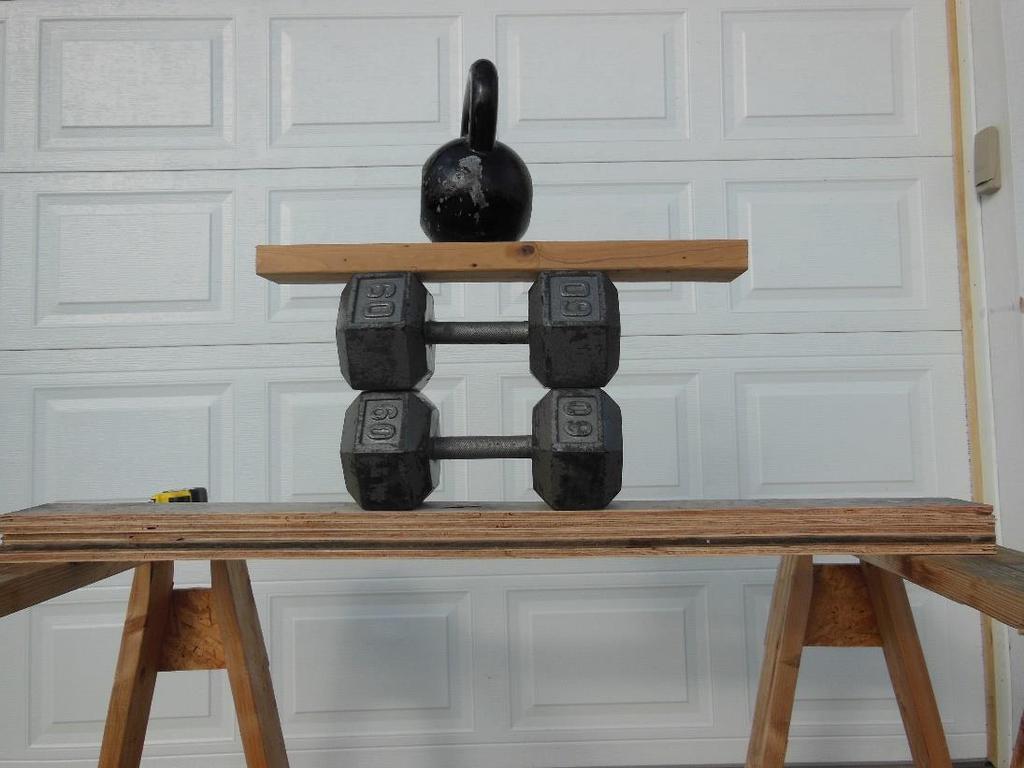


33 Bonded Demonstration ½ Deflection, 60lb Load ¼ Deflection, 160lb Load Unbonded Fully Bonded 3


34 Far too frequent practices...


35 Days later! Courtesy of Road Science

36 Successful Tack Coat The Ultimate Goal: Uniform, complete, and adequate coverage

37 Proper Tack Coat Application Specify and monitor adequate tack coat application Control dilution of emulsion Separate pay item? Alternate materials Low Tracking tack Modified materials Paving grade binders A well compacted pavement section will not perform if it is not properly bonded!!
38 Improving Quality Control with Intelligent Compaction
39 Intelligent Compaction Real-Time Feedback to Roller Operator with On-Board, Color-Coded Mapping using GPS Shows # of passes Improve roller patterns Improve temperature monitoring Make smart adjustments on-the-fly Identify weak support areas

40 Sakai IC Onboard Display Unit

41 Color-Coded On Board Display

42 Improved Rolling Patterns Before After IC roller
43 Bottom Line Increased Compaction = Increased Performance Better Return on Investment for the taxpayers More Durable Pavements = More Tonnage for the HMA Industry!!! Thank you!