Adapting to Climate Change
|
|
|
- Abraham Simmons
- 5 years ago
- Views:
Transcription


1 SESSION No. 8 Adapting to Climate Change Portland, United States Climate Action Plan 2015 Angus Duncan, President, Bonneville Environmental Foundation Chairman, Oregon Global Warming Commission
2 Oregon Global Warming Commission City of Portland Climate Action Plan
3 Million Metric Tons of Greenhouse Gases (CO2e) Progress Toward Oregon s Greenhouse Gas Reduction Goals Historical Greenhouse Gas Emissions Governor's Advisory Group on Global Warming (2004) Business as Usual Forecast 30 Greenhouse Gas Emissions from 2000 to Most Recent Data Available (2010) Current Business as Usual Forecast 20 Energy Efficiency (EE) and Conservation to Meet All New Load Growth EE + Maintain Full Impact of Renewable Portfolio Standard (RPS) to EE + Maintain RPS + Boardman Power Plant Replaced with Natural Gas & Renewables (50/50) in 2021 EE + Maintain RPS + Boardman Switch + Clean Fuels Program (LCFS) with 2015 Sunset Removed and 2050 Goal Emissions Reduction Trajectory
 31.5% Transportat ion of Goods & People (no light rail) 36.")
4 Oregon Greenhouse Gas Emissions 2010 (with electricity broken out from sectors) Industrial Processes & Other Energy 11.8% Other Residential & Commercial Activities 12.1% Livestock, Soil, & Crops 8.5% Electricity Use (all sectors) 31.5% Transportat ion of Goods & People (no light rail) 36.0% Cars = about ¼ of OR GHG Coal = about ¼ of OR GHG

5 PGE Boardman Coal Generator, Boardman, OR
6 MMT CO2 MMT CO Estimated coal-by-wire changes for PGE +Pacific Power Total (Pac+PGE) 2050 goal trajectory Baseline estimates from 2013 utility IRP projections Pac+PGE estimated total after coal reductions 2050 goal trajectory

7


8 City of Portland Climate Planning
9 Local carbon emissions have declined ahead of the national trend United States 8% As of 2014, local emissions had fallen by 21% since 1990, despite 31% population growth. Multnomah County 21%
10 Population and jobs have increased while carbon emissions have fallen Population Jobs Carbon emissions


11 70% of emissions come from cities, which are inherently more energy/carbon efficient...

12 Portland s Urban Growth Boundary concentrates development, increases density, protects bordering farm and forest.

13 Align Densities with Transit

14 Create 20 minute neighborhoods Areas in yellow have highest access to services/amenities; in purple, lowest

15 Buildings are 40% of our energy use... And half of 2050 s buildings have yet to be built. By then, all new buildings will be net zero carbon Picture of beautiful building


16 At least 50% of 2040 s vehicles will be all-electric.


17 While we re reducing carbon emissions, we are also preparing for the climate changes already coming. The Oregon Climate Change Adaptation Framework December 2010
18 State-Level Adaptation Agenda Water Fire Public Health Erosion / landslides Infrastructure Species, Ecosystem Change/Loss Ocean Acidification

19

20 : Summer heat gains 1 C to 4 C... Intensifying eastside drought Gain in annual and seasonal mean temperatures compared to

21 Oregon Climate Change Research Institute 2015

22

23

24

25

26 Chehalis I-5 Interchange December 2007


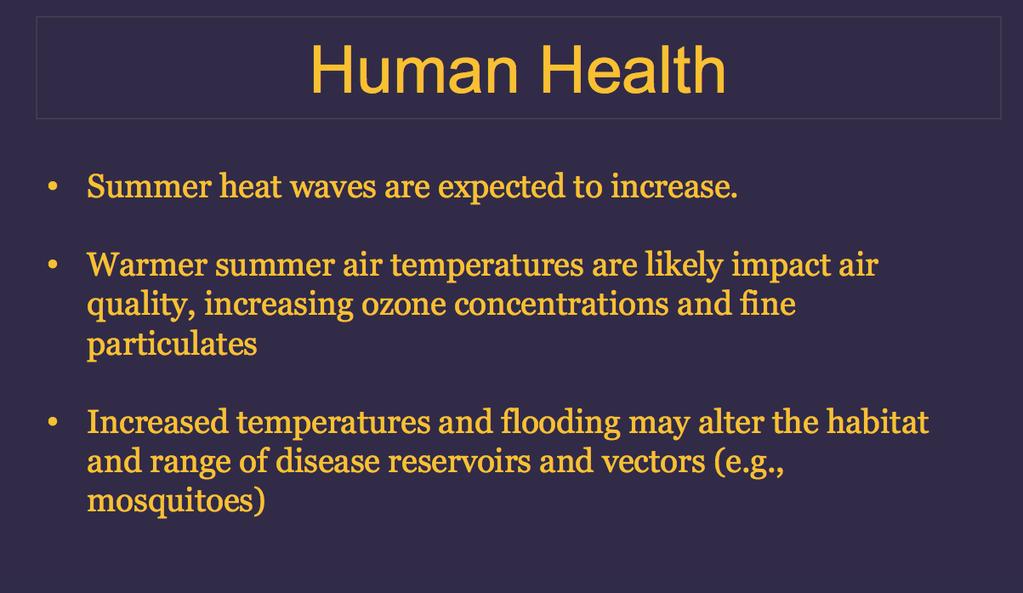
27

28 Canyon Creek Fire, August 2015

29
30 Oregon Adaptation Strategies-1 Revise flood plain, coastal erosion maps; reflect in zoning Revise forest land use maps for wildfire vulnerability; adjust allowed land uses; apply fuel reduction, controlled burn strategies Identify infrastructure at risk; re-engineer for resiliency and/or relocate Inventory water resources; regulate for and invest in water use efficiencies
31 Oregon Adaptation Strategies-2 Identify and protect refugia for at risk species, especially vulnerable watershed biota Identify at-risk human populations, especially for health effects, and devise strategies targeted to these communities
32 City of Portland Adaptation Strategies Resilient + green infrastructure Natural area protection (e.g., water flows, quality in urban waterways) Drought tolerant street trees, plantings for city parks Floodplain mapping and alignment with zoning Building codes for heat management Day-to-day + emergency health planning for heat, flooding, respiratory diseases 32

33
34


35 Health Impacts + Equity Higher, drier summers Warmer, wetter winters Increase in heat-related illness, especially for vulnerable populations Increase in respiratory diseases, such as asthma Changes in vector-borne diseases like West Nile virus


36 Key Recommendations Prioritize vulnerable communities
37 Portland s Urban Heat Island Indicator Urban Heat Air Pollution Adults over 65 Youth under 18 Persons below 50% Poverty Line Adults without a High School Degree Communities of Color BMI Language other than English spoken at home Adults over 65 living alone Voter turnout In-home air conditioning

38 Portland s Primary Risks Hotter, drier summer with more high-heat days High Temperatures

39 UHI Portland Afternoon (3pm)


40 Heat Vulnerability Existing Tree Canopy Heat Islands Where to prioritize tree plantings?
41 Adaptation Planning Proceeds Slowly Planning often limited to narrow circles within Federal, State, local government bureaucracies Needs identified but few investments yet in infrastructure protection, conservation of critical species and resources Needs identified but few changes in land, water, airshed management practices Public health planning furthest along
42 Emissions reductions are hard to come by; so is effective adaptation planning. Why? Politics Information / Validation Equity / free riders Absence of urgency / conventional vs. existential issues / discount rates

43 Questions