Maryam Bakhshi AvH Climate Protection Fellow Host: Dr. Behrooz Abdolvand MONA CONSULTANTS.
|
|
|
- Dustin Hunt
- 5 years ago
- Views:
Transcription
1 Maryam Bakhshi AvH Climate Protection Fellow Host: Dr. Behrooz Abdolvand MONA CONSULTANTS.
2 Introduction to Bioenergy Bioenergy is the energy contained in living or recently living biological organisms! Organic material containing bioenergy is known as biomass.

3 Biomass Resources


4 Types of Energy from Biomass
 77.")
5 Structure of RES Share in Total Energy Supply of the World 10.6% world total energy supply - 80 % total renewable energy supply Solid biomass has grown at 1.8% per year since 1990 Liquid biomass has grown at 84% annually Liquid Biomass 0.7% Renewable Municipal Solid Waste 1.20% Gas from Biomass 0.50% Solid biomass (Charcoal) 77.4% Combustible renewable and waste; 79,9 Wind; 0,2 Hydro; 16,4 Solar; 0,3 Geothermal; 3,2 Source: EIA

6 Percentage of final energy consumption generated from renewables in Germany Source: Renewable energy in figures, BMU 2012 / Volke Lenz, DBFZ presentation
7 Share of Biomass in Renewable Energy Resources in Germany: Biomass Share (%) Primary Energy Supply 61 Final Energy consumption 65.5 Electricity Generation 30 Heat Generation 91


8 Structure of Bio Energy in 2013 Germany (%) Bio Power; 38 Bio fuel; 9 Bio Heat; 53 Total : 1286 PJ Lenz et al., BWK, 05/2014

9 Structure of Bio fuels- Germany 2013 (%) Rapeseed Oil; 0,1 Bio Methane; 2 Bio Ethanol; 28 Total: 116 PJ Bio diesel; 69,9 Lenz et al., BWK, 05/2014


10 Lenz et al., BWK, 05/2014 Structure of Biopower in Germany 2013 (%) sewage gas; 3 Landfill gas; 1 Bio Waste; 10 Biogas; 60 Biogenic solid fuels; 25 Total: 45 TWh Liquid Biomass; 1


11 Lenz et al., BWK, 05/2014 Structure of Bio Heat in Germany 2013 (%) Solid fuel CHP; 13 Waste Incineration; 6 bio oil; 0,5 Biogas; 8 sewage gas; 1,3 Landfill gas; 0,2 solid fuel heating; 71 Total: 507 PJ


12 Bioenergy Promotion in Iran???
13 Domestic Energy Consumption = 44% of total Energy production Production Decreasing consumption by 1% per year Million Barrels Oil eq Current situation to be continued year 13
14 Primary Energy Supply Share of Sources (%) ( ) 120,00 100,00 80,00 Nuclear 60,00 40,00 20,00 0,00 Hydro Solid Biomass and Biogas Coal Natural Gas Oil
15 Primary Energy Supply Sources % ( ) Oil 40,00 35,00 30,00 25,00 20,00 15,00 10,00 5,00 Hydro Solid Biomass and Biogas Coal Natural Gas 0,00
16


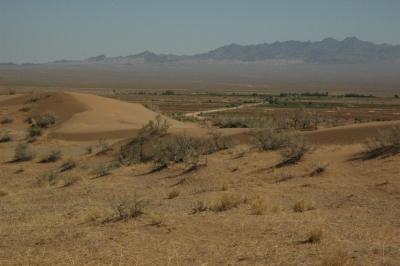
17 Iran Landuse Pattern Deserts 20% Woodlands 1% Cultivation Lands 10% Other 7% Forests 9% Rangelands 53%
18
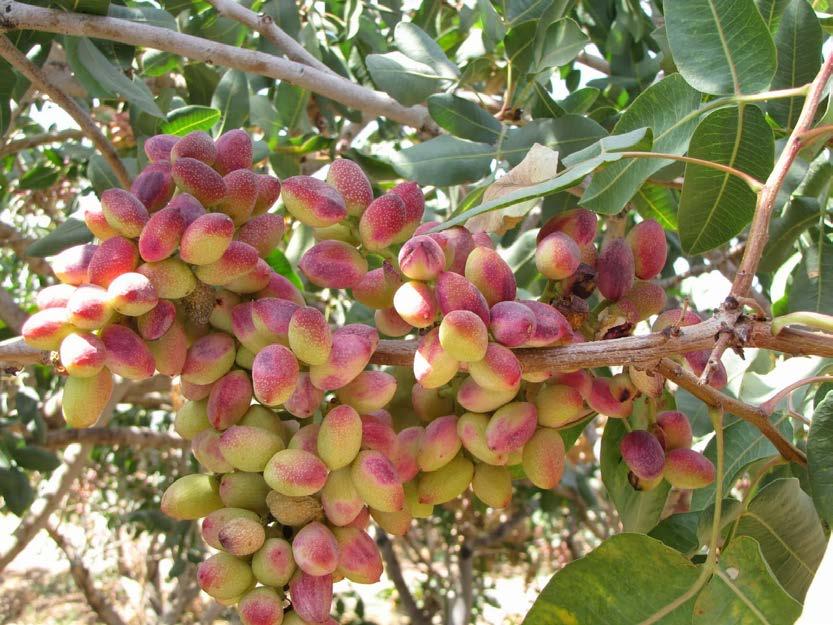
19
20
21 Bioenergy Advantages Diversification of Energy Sources Environmental and Health Benefits (waste management option) Economical Benefits : job creation, rural development Energy Security Benefits (Distributed Generation) Less distance between supply and demand (Electricity and Heat) CO2 Reduction/ CO2 Neutral Local Value Chains
22 Transparency Accountability Participation & Capacity Set objectives Potential Assessment Set Targets Impl. &Legal Directives Identify Constraints Identify Policy Mechanisms Bioenergy Promotion strategies Review Process
23 Classification Potential Assessment Biomass cannot be regarded as a single product but consists of an almost countless group of products that can be classified according to: Physical and chemical properties (moisture content, calorific value, etc.); Type (energy crop, by-product/residue, waste product); Sector of origin (agriculture, industry, waste processing sector); Potential energy applications (electricity, heat, CHP or transport fuel); Legal status (waste or product)
24 Category Class Subclass/examples Straw Agriculture Residues 1. Primary Agricultural Silage Biomass (Post harvest/in farm) Horticulture Residues Garden thinning Fruit waste Rice husk and sugarcane Bagasse Sugar and Candy Industries waste Nuts Shell 2. Secondary Agricultural Biomass (Processing Waste) 3. Primary Forestry Residues (Natural/Plantations) 4. Secondary Forest Biomass Solid Liquid Logging Residues Forest Fuel Sawmill Residues Residues from Wood (panel) Material Production Plant Oil industries waste and residues Fruit and Vegetables Processing Industries waste and residues Fodder and feed producing industries waste and residues Other Industrial organic waste Alcohol and Nectar Production Wastewater Slaughterhouse and Dairy Production Wastewater Meat Processing Wastewater Other Industrial Organic Wastewater Stump Residual Foliage Sawdust Wood Fuels Charcoal Residues from round wood processing Veneer and Plywood Production Residues Fiberboard Production Residues Particleboard Production Residues Laminate and Parquets Production Residues
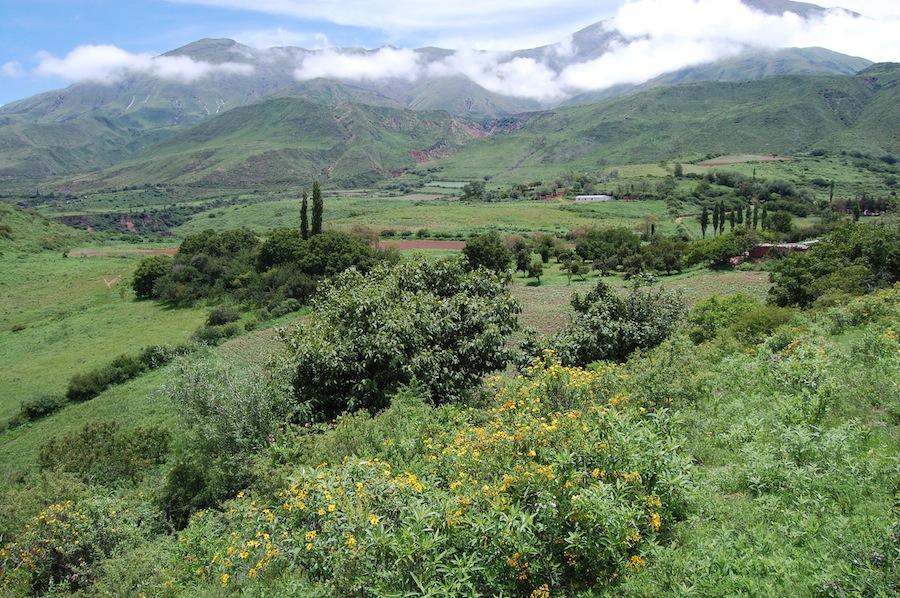
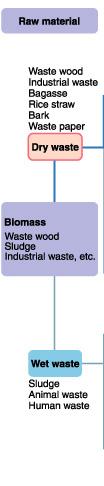
25 Biomass Resources Classification 1. Primary Agricultural Biomass (on-farm post harvest residues) 2. Secondary Agricultural Biomass 3. Primary Forestry Residues 4. Secondary Forest Biomass 5. Urban Waste 6. Manure 7. Energy Crops
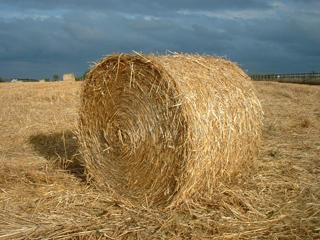
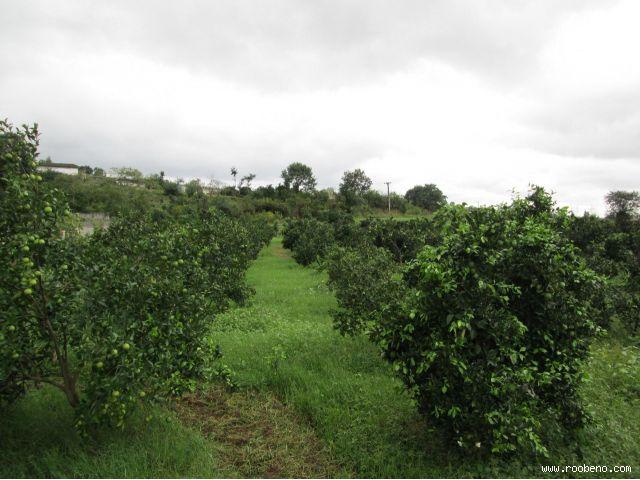
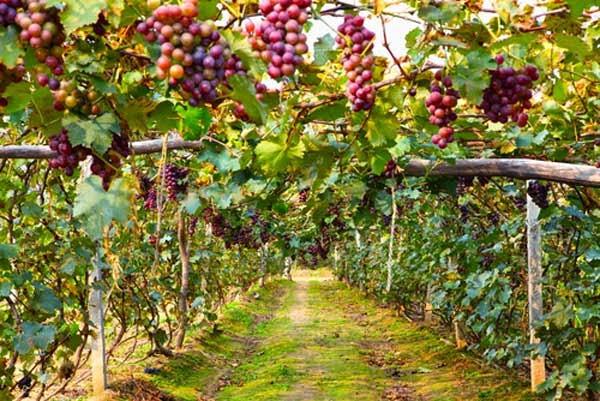
26 1. Primary Agricultural Biomass Primary residues Wheat, barely straw, sugarcane top, maize stalks; Horticulture: thinning,
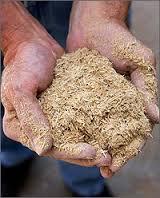
27 2. Secondary Agricultural Biomass Solid: Liquid:» Rice husk and sugarcane Bagasse» Sugar and Candy Industries waste» Nuts Shell» Plant Oil industries waste and residues» Fruit and Vegetables Processing Industries waste and residues» Fodder and feed producing industries waste and residues» Other Industrial organic waste» Alcohol and Nectar Production Wastewater» Slaughterhouse and Dairy Production Wastewater» Meat Processing Wastewater» Other Industrial Organic Wastewater
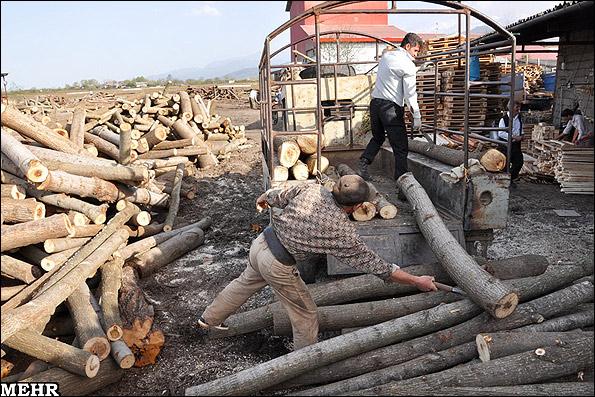
28 3.Primary Forest Biomass Logging Residues Residual Foliage Sawdust Forest Fuel Wood Fuels Charcoal
29 4. Secondary Forest Biomass Sawmill Residues Residues from round wood processing Residues from Wood (panel) Material Production Veneer and Plywood Production Residues Fiberboard Production Residues Particleboard Production Residues Laminate and Parquets Production Residues Wastes and Residues from Final Products Production Carpentries Door and Window Production Furniture Production waste and residuespulp and Paper Pulp and Paper Industry Black Liquor


30 WOOD CYCLE Charcoal, wood fuel Domestic Forests Imports Heat/ Electricity Residues Residues Sawmills and Logging Wood Materials Residues End-Products Production End- Products
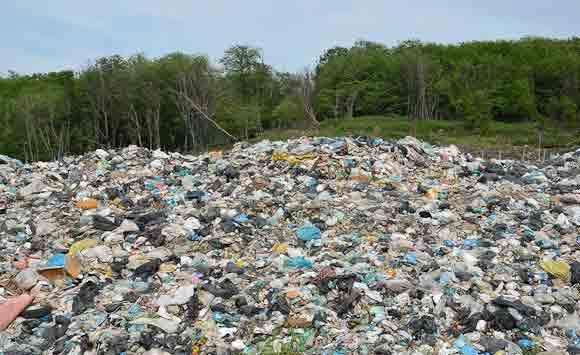
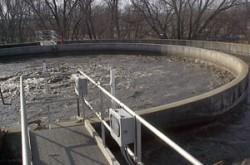
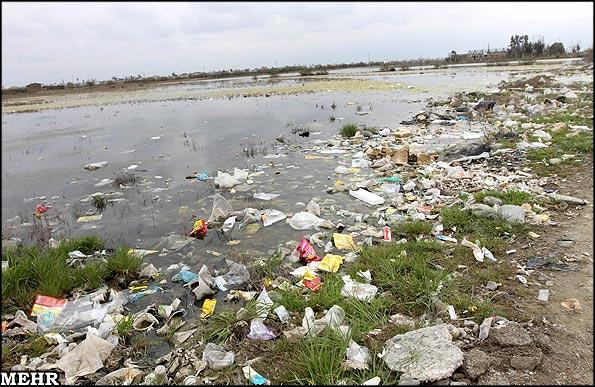
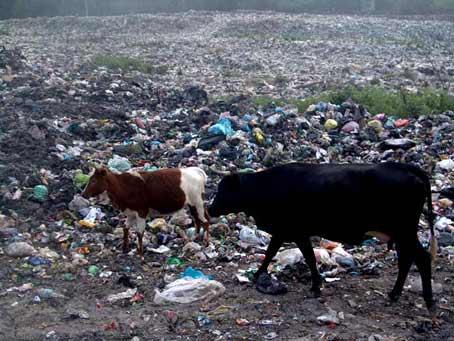
31 5. Urban Waste Municipal Wastewater Municipal Solid Waste
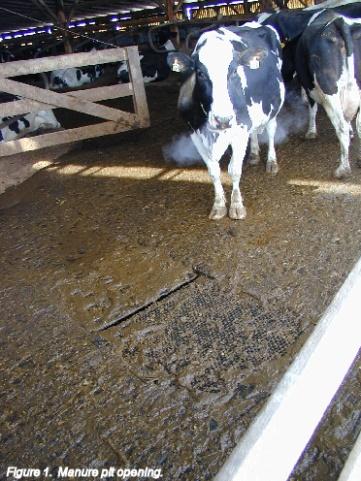
32 6. Manure Poultry Chicken Turkey Ostrich Livestock Cattle and Bull
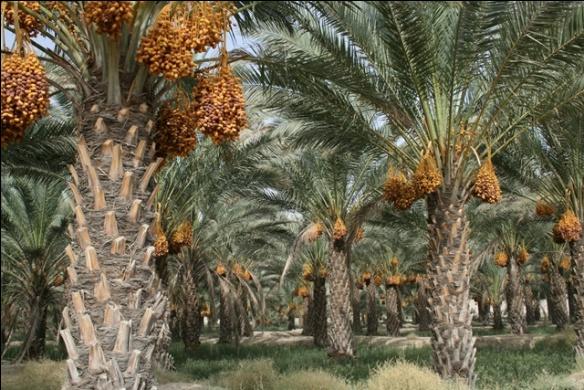
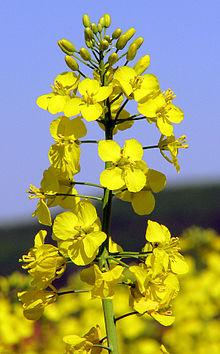
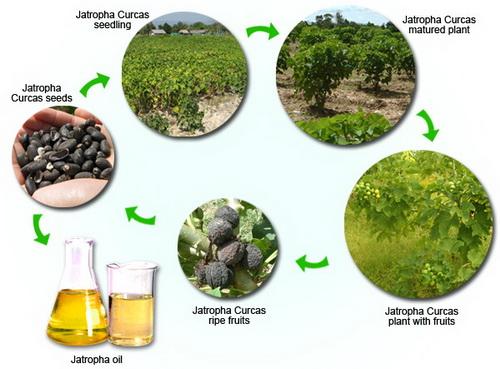
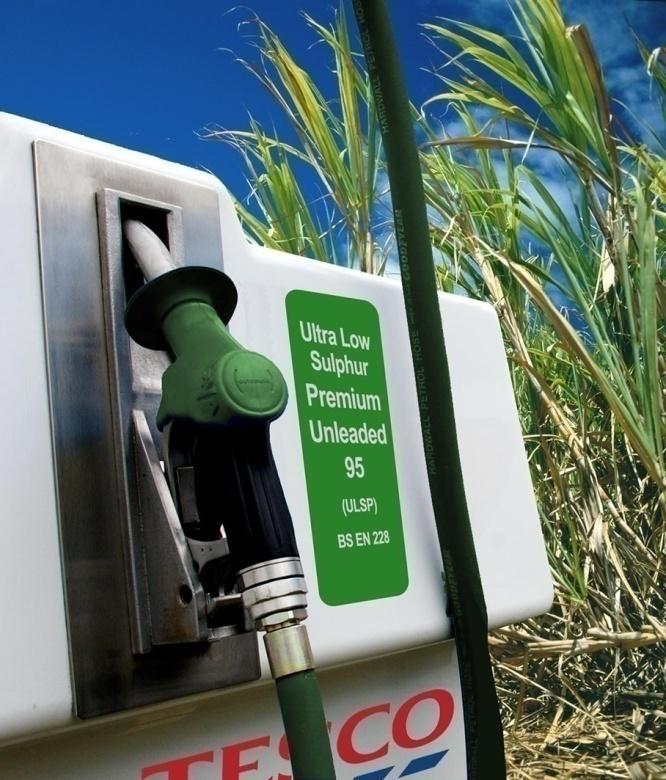
33 7. Energy Crops Energy Plants Cultivated on Arable Land Short Rotation Forest Plantations Agroforestry Energy Plants Cultivated on Degraded Lands Jatropha Switchgrass Miscanthus Algae

34 Biomass Potential Assessment
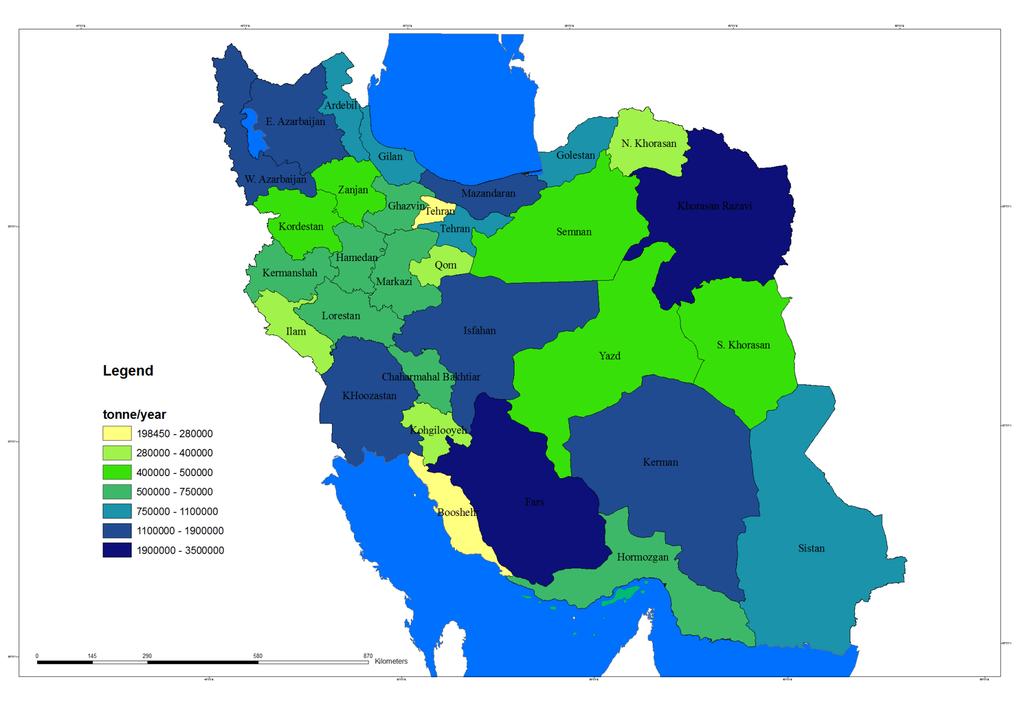
35 Wheat Production In IRAN Provinces Total Production: 12,307,969 ~12.3 M ton in
36 Basis of Methods (Example Straw/Grain) Straw yield related to grain yield 7 6 Straw yield (tonnes/ha) Grain yield (tonnes/ha)

37 Sugar Beet Production in Iran Provinces Total Production~ 5mton 37
38 Sugar Cane Production In 2012~ 3.2 million ton 38
39 Barely Production in Iran Provinces Total Production ~ 2Mton in
40 Rice Production in Iran Provinces Total Production: 2,736,842~ 3Mton in

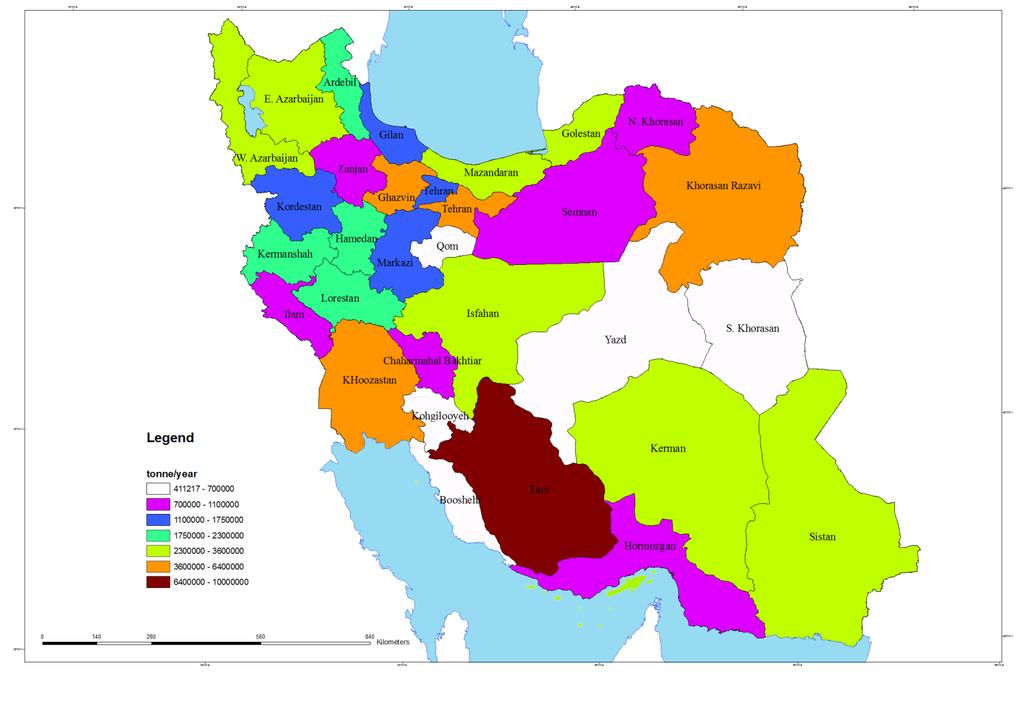
41 Agricultural Primary Residues

42 khalij-omani 20% hyrcani 15% arasbarani 3% irano-turani 24% Total Area: 14,000,000 ha Plantations: 20,000 ha zagrosi 38% 42

43 Forest Biomass Potential
44 Manure
45 Agricultural+Horticultural+ Manure+Forestry Biomass
46 Wastewater Energy Recovery
47 Technological Capacity The development of domestic industries and manufacturers is often desirable to support local growth and job creation, which can also lead to political acceptability of renewable energy programs
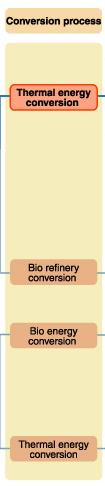
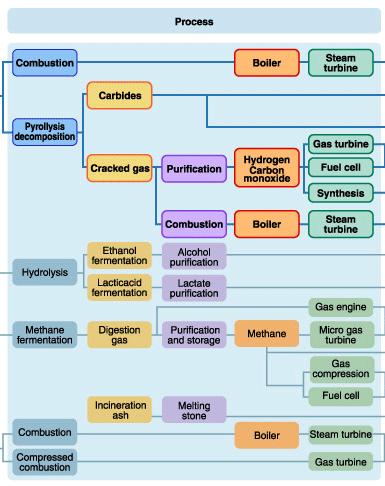
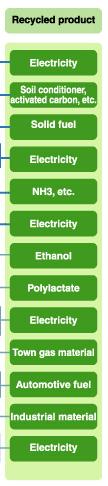
48 Biomass Conversion Technologies
49 Low capability Domestic Capabilities High capability Equipments Biomass Pretreatment Biomass Transportation Combustion No Ability Able to Operate Able to Assemble R&D and Pilot Able to Design, Manufacture and Install and Operate Shredder Sieve Dryer Conveyer feeder Furnace Boiler Instruments Instruments Air Feeders Gas Tubes fan Compresser Heat Recovery Economisers Exhaust Gas Cleaning Anaerobic Digestor Power Generation Cyclone Filter Scrubber Dust Chamber Bag Filter Electrostatic Scrubber Anaerobic Digestor turbine generator
50 Set objectives Transparency Accountability Participation & Capacity Potential Assessment Set Targets Impl. &Legal Directives Identify Constraints Identify Policy Mechanisms Review Process
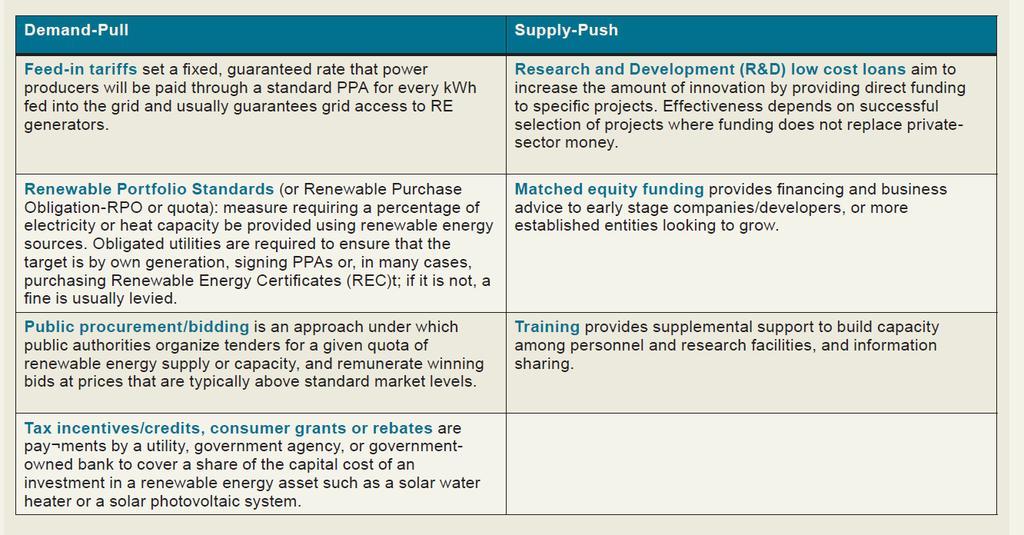
51 Providing Policy Mechanisms Preferred Policy Mechanism depends on the country objectives: 1. Objective: to increase manufacturing, supply-push policies (policies that support development and production conversion technologies 2. Objective: to increase installed capacities demand-pull policies(policies that increase support for the production of electricity)
52
53 Conclusion: Energy efficiency Investment Loans (Waste Management Options)- long payback time Feed in Tariff modification Plan Regionally Symbiosis Approach

54 MONA CONSULTANTS.