Linkages between Microbial Biomass, Litter Decomposition, and Salinity in Tidal Forested Wetlands
|
|
|
- Primrose Small
- 5 years ago
- Views:
Transcription


1 Linkages between Microbial Biomass, Litter Decomposition, and Salinity in Tidal Forested Wetlands Kathryn Pierfelice 1 Graeme Lockaby 1 Greg Noe 2 Ken Krauss 2 1 Auburn University 2 U.S. Geological Survey {


2 Background Functions and Services Salinity Decomposition? Microbes Nutrient Availability Production Research Interest Climate and Development Threats


3 Upper Middle Lower

4 Project Objective Quantify microbial biomass and litter decomposition dynamics along a salinification gradient.


5 Hypotheses Increasing Salinity
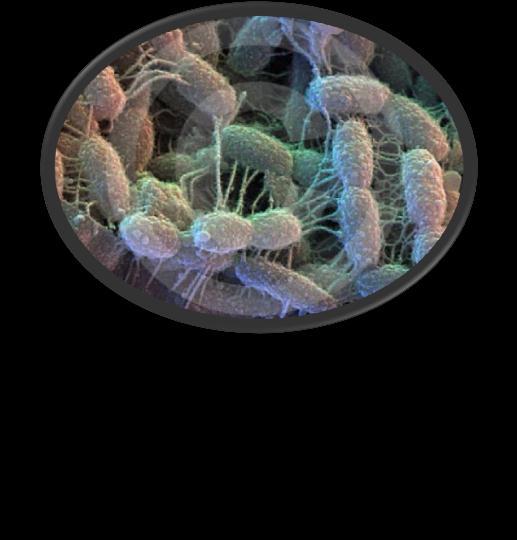
6 Investigation Strategy Site Characterization Microbial Biomass Litter Decomposition
 -")
 Sa")
 -Monthly measurements with data Hydrology -Data")
7 Methods- Site Soil - Samples gathered in September 2010 and sieved through 2mm mesh - Extractable P, K, Ca, Mg, Mn, Zn (Mehlich-1 extraction) - Perkin-Elmer 2400 series II analyzer (C and N) - LabFit AS-3000 ph analyzer (ph) Salinity -Data acquired directly from U.S.G.S. for all sites (2011) -Monthly measurements with data Hydrology -Data acquired directly from U.S.G.S. for the middle site (2010) Vegetation - Data acquired from Baruch Institute for overstory

8 Site Salinity Figure 1. Mean monthly porewater salinity for all three sites in 2011.
9 Site Hydrology Figure 2. Hydrology data for middle site, 2010.


10 Site Soil Measurements Figure 3. Site soil ph and percent soil C and N for each site (September 2010).
11 Site Soil Nutrient Site Ca Cd Cu Fe K Mg Mn Na Ni P Pb Zn ----mg/kg---- Upper 5425a 0.16a 2.24a 413a 247b 821b 219a 244b 1.38a 11.4b 1.31a 19.8a Middle 3099b 0.11b 2.40a 399a 313a 2029a 189ab 1372a 1.10a 17.6a 1.46a 15.3b Lower 3524b 0.07b 1.30b 129b 206b 1687a 111b 1717a 1.37a 10.7b 1.58a 11.3c Table 1. Soil nutrients for each site with letters representing significant differences among sites at p<0.05 (September 2010).


12 Site Vegetation Dominant Species Baldcypress (Taxodium distichum) Blackgum (Nyssa sylvatica) Upper Middle Lower
 ½ gallon soil (3 subsamples from each plot) Sieved")

13 Methods- Microbial Biomass Chloroform fumigation-extraction (Brooks, 1985 ;Vance, 1987) ½ gallon soil (3 subsamples from each plot) Sieved through 2 mm wire mesh Analyses performed <24hrs Determined microbial C and N Samples from Sept 2010-Dec 2011 Statistical analysis Proc GLM Alpha =.05

14 Results-Microbial Biomass Figure 4. Mean C and N microbial biomass for 2011, with letters representing significance at p<0.05.
15 Results- Microbial Biomass Figure 5. Seasonal microbial C and N for Different letters represent significances among sites for each season at p<0.05.

, top (5cm)")


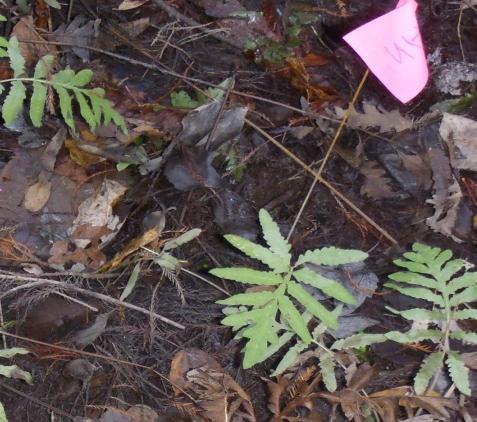
16 Methods- Litter Decomposition Raised traps Sort species by site 3 sets of 8x8 nylon bags Bottom (2 cm), top (5cm) Popsicle sticks Collected at weeks: 0,2, 4, 10, 16, 25, 36, and 48 Analyze for C, N, and P Statistical analysis (alpha=.05)

17 Results- Litter Decomposition Litter quality at time zero Variable Upper Middle Lower CN CP LignN Figure 6. Mass remaining in litter and popsicle stick bags after 30 weeks (March- December), and litter quality at time zero.
18 Results- Litter Decomposition Figure 7. N and P remaining (%) in litter through week 30 of the decomposition for each site.
19 Results- Litter Decomposition Figure 8. C/P and C/N ratios plotted against percent mass remaining.
20 Discussion As salinity increases microbial biomass will decline and decomposition will be inhibited Microbial biomass wanes as salinification increases Similar litter decomposition, despite litter quality differences Popsicle sticks suggest differences in microbe and edaphic influences among sites

21 Additional and Future Research Compare results with: Productivity measurements Nutrient limitations Quantify microclimate data Temperature Precipitation Identify microbial species Particulate loss issue


22 Special Thanks Dr. Graeme Lockaby (advisor) Co-authors Dr. Greg Noe Dr. Ken Krauss Committee Members Dr. William Conner Dr. Ken Krauss Dr. Jack Feminilla Funding provided by: In the lab and field Robin Governo Robert Price Jack Blackstock Meg Bloodworth
23 References Brooks, P.C., A. Landman, G. Pruden, and D.S. Jenkinson Chloroform fumigation and the release of soil nitrogen: A rapid direct extraction method to measure microbial biomass nitrogen in soil. Soil Biol. Biochem. 17: Vance, E.D., P.C. Brooks, and D.S. Jenkinson An extraction method for measuring soil microbial biomass C. Soil Biol. Biochem. 19: month Personal Contact Info: Kathryn Pierfelice kpierfelice@gmail.com (740)

24 Questions? Questions?