NACUBO 2010 Smart and Sustainable Campuses
|
|
|
- Ralph Harrell
- 5 years ago
- Views:
Transcription

1 NACUBO 2010 Smart and Sustainable Campuses Steve Tatge, University of Washington Tim Williams, ZGF Architects Chris Flint Chatto, ZGF Architects Strategies to Reduce the Carbon Footprint of Lab Buildings on Academic Campuses
2 Why Focus on Lab Buildings? Energy Reduction Strategies Measuring and Evaluating Savings Institutional Barriers to Implementation Lessons Learned Q&A Strategies to Reduce the Carbon Footprint of Lab Buildings on Academic Campuses


3 ZGF ARCHITECTS LLP


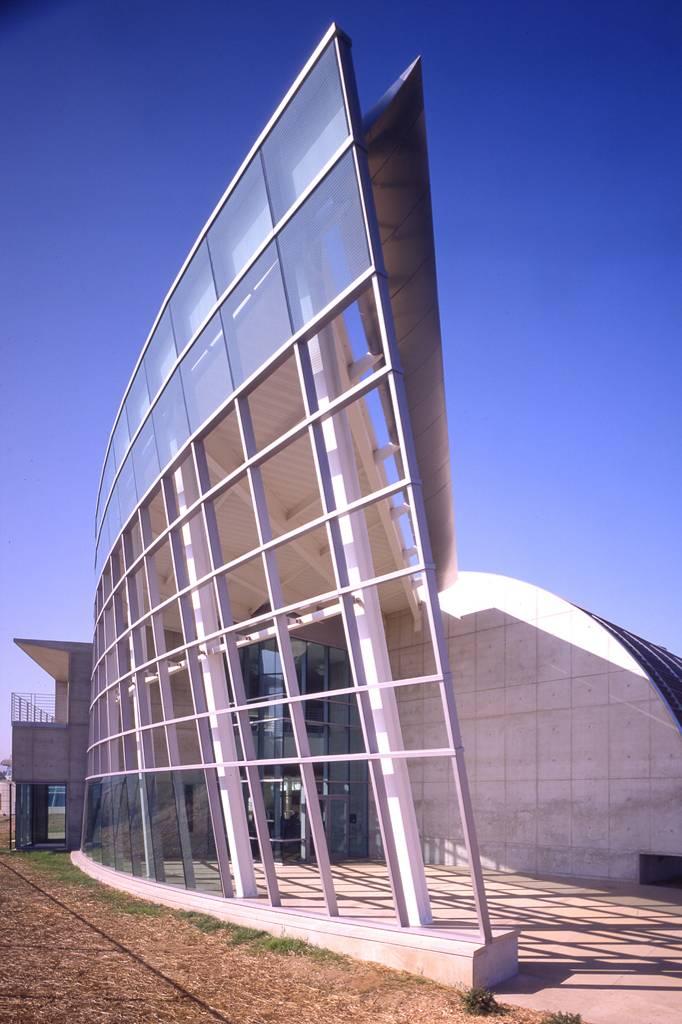
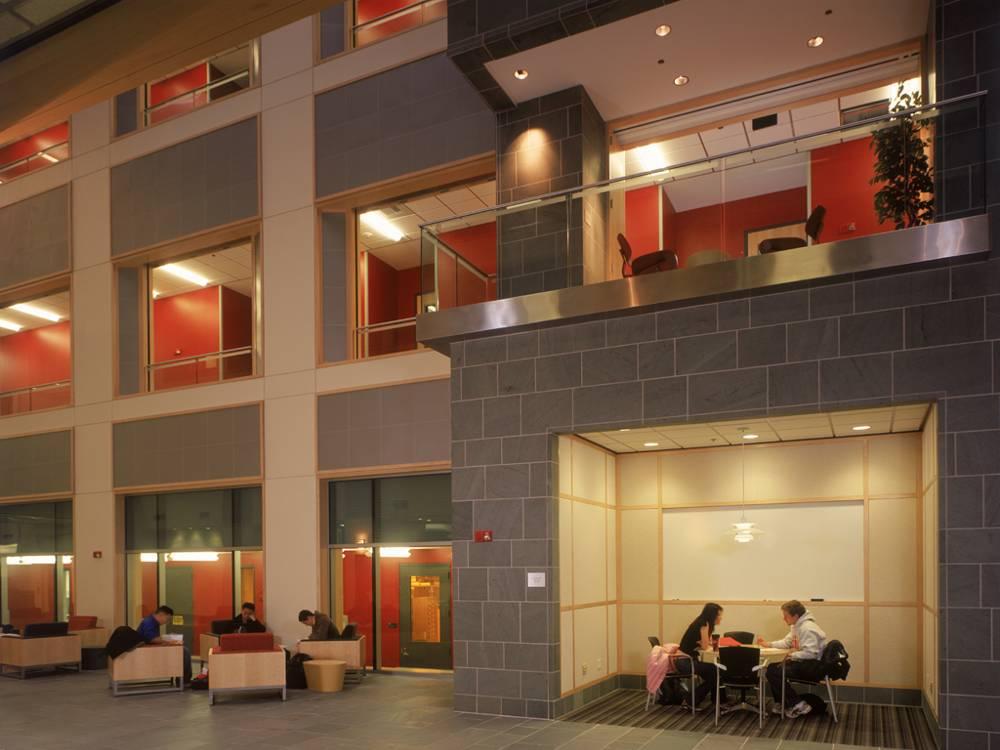
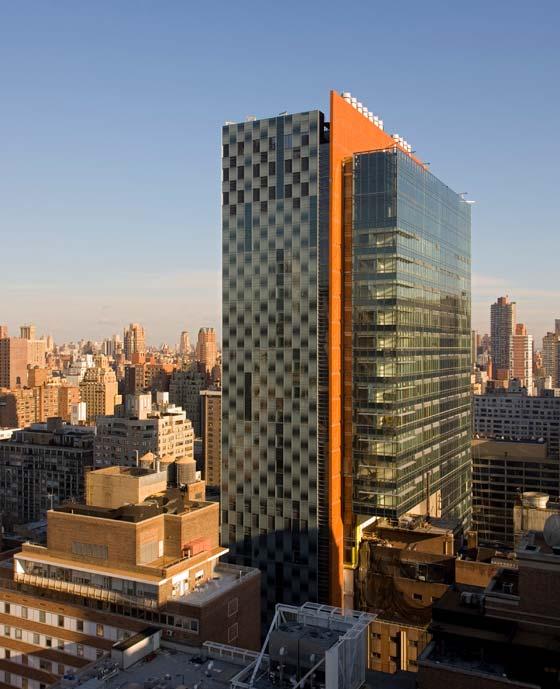
4 Duke University, Center for Interdisciplinary Engineering, Medicine and Applied Sciences Memorial Sloan-Kettering Cancer Center, Zuckerman Research Center Fred Hutchinson Cancer Research Center Twelve West UC Santa Barbara, Bren School of Environmental Science and Management Portland State University, NW Center for Engineering, Science & Technology Oregon Health & Science University, Biomedical Research Building Environmental Protection Agency (EPA) Region 8 Headquarters
5 SILVER CERTIFIED CERTIFIED PLATINUM Duke University, Center for Interdisciplinary Engineering, Medicine and Applied Sciences Memorial Sloan-Kettering Cancer Center, Zuckerman Research Center Fred Hutchinson Cancer Research Center Twelve West DOUBLE PLATINUM GOLD SILVER SILVER UC Santa Barbara, Bren School of Environmental Science and Management Portland State University, NW Center for Engineering, Science & Technology Oregon Health & Science University, Biomedical Research Building Environmental Protection Agency (EPA) Region 8 Headquarters
 98 of 100 points, ranked second, among Sierra Club Cool Schools Sustainability Accomplishments Over $65 Million avoided utility costs since 2001 100%")

6 Research #1 public university in U.S. for receiving federal research grants annually since 1974 and #2 recipient nationwide overall Sustainability Ratings Rated in top 6 U.S. Universities in Sustainability (AASHE 2007) One of 11 schools nationwide on Princeton Review s Green Honor Roll Rated in top 10 U.S. Universities in Sustainability (Forbes, 2008) 98 of 100 points, ranked second, among Sierra Club Cool Schools Sustainability Accomplishments Over $65 Million avoided utility costs since % renewable purchased electricity Over $5 Million recycled waste disposal cost avoidance 127 million car trips eliminated with U-Pass 76% participation in bus, carpool, vanpool, biking and walking 30% energy reduction through commissioning new buildings 25 awards for sustainability, conservation, environmental leadership, transportation management University of Washington

7 11 UW LEED-Certified Projects Including 7 Gold 22 UW Registered Projects (certification pending) Over 50 LEED-accredited professionals on staff LEED Silver is mandated for all statefunded University of Washington major projects UW LEED Projects


8 UW Carbon Initiatives & Building Stock Signatory to the American College and University Presidents Climate Commitment March 2007 Performed an inventory of greenhouse gas emissions attributable to the University Completed a carbon reduction plan Operates over 20 million gross square feet of space Owns 527 buildings, leases another 175 at 3 campuses and numerous field facilities 48% of the total square footage on the Seattle Campus is airconditioned, with laboratories and classrooms most commonly being air-conditioned Office space is approximately 25% of all space on campus, and is the largest single category of space Laboratory space is over 17% of total space UW Carbon Initiatives & Building Stock
9 Why Focus on Lab Buildings? Strategies to Reduce the Carbon Footprint of Lab Buildings on Academic Campuses


10 OFFICE LAB 90% of difference is energy usage Environmental impact of laboratories
11 Lab Benchmarking: Target Finder / CBECS
12 Lab Benchmarking: Target Finder / CBECS

13 Typical Office Building Total Site Energy Use Intensity BTU/sf-yr for various laboratories in the Labs21 Benchmarking Database Lab Benchmarking: Labs21

14 Lab Benchmarking: ZGF
15 Labs Other bldg types % SF on UW campus % estimated energy use
16 Project Goals Provide instrumentation space to support future high sensitivity measurement in the rapidly evolving field of molecular engineering Address campus needs for modern lab space, as research requirements for advanced labs have expanded faster than the current infrastructure can support House flexible research lab spaces designed to bring different fields together, attracting eight new interdisciplinary faculty hires to join approximately 30 other faculty from bioengineering, chemical engineering, electrical engineering, materials science and engineering, biochemistry, chemistry, and microbiology Phase 1 Phase ,000 40,000 60,000 80, ,000 Project Goals Gross Square Feet Lab Misc Office


17 Project Location


18 Phase 2 Phase 1 Site Plan
19 Energy Reduction Strategies & Measuring and Evaluating Savings Strategies to Reduce the Carbon Footprint of Lab Buildings on Academic Campuses


20 10 BIG HITS 1 GET WITH THE PROGRAM 2 LAYOUT RATIONALLY 3 ZONE APPROPRIATELY 4 PUSH THE ENVELOPE 5 STRUCTURE FOR DAYLIGHTING 6 SCRUTINIZING THE AIR CHANGES 7 DROP THE PRESSURE DROP 8 GET REAL WITH PLUG LOADS 9 JUST SAY NO TO REHEAT 10 CALL THE COMMISSIONER

21 1 GET WITH THE PROGRAM PROGRAMMING IS THE FIRST CHANCE TO INFLUENCE OPERATING COSTS
22 Programming: Climate Analysis

23 Programming: Opportunites Energy Studies in Buildings Laboratory

24 Program Analysis


25 Program Analysis

26 Program Analysis: Daylight
27 2 LAYOUT RATIONALLY LAYOUT OF SERVICING NEEDS ARE AS INTEGRAL AS LAYOUT OF ARCHITECTURE OR STRUCTURE


28 Layout


29 P G AHU SG Layout
30 3 ZONE APPROPRIATELY SEPARATE DIFFERENT USES, SET LEVELS OF CONDITIONING AND CONTROL ACCORDINGLY

31 Zoning


32 Scheme 1: office on west Zoning

33 Scheme 2: office on east Zoning

34 Zoning Air-tight lab/office boundary
35 4 PUSH THE ENVELOPE DESIGN TO CAPITALIZE ON CLIMATIC FORCES


36 Climate: Annual Temperature Bins
37 Climate: Annual Temperature Bins
38 Climate: Wind


39 Climate: Adaptive Comfort Range
40 Peak load: July 10 th, 10am (Temp = 73F) Climate: Load Reduction


41 Façade opacity 40.8% red. Glass type 34.1% red. Overhangs 51.6% red. Total 81.1% reduction (vs. 81.7% goal) Climate: Reducing Solar Gain

42 Climate: Operable Window Strategy
43 Natural Ventilation: Integrated Systems
44 5 STRUCTURE FOR DAYLIGHTING HIGHER WINDOW HEAD HEIGHTS, UPTURNED BEAMS = LOWER LIGHTING COSTS


45 Peak load: July 10 th, 10am (Temp = 73F) Daylight: Load Reduction


46 Daylight factor (%) Annual Electric Savings Daylight factor Avg Target illum. (fc) over space % 15.9% 30.0% % 23.9% 37.5% Annual Electric Savings Peak condition (July 10th, 10am) Daylight factor Avg Target illum. (fc) over space % 46.0% 67.0% % 69.0% 78.5% Assumes.95w/SF, 6am-9pm schedule, year-round, no occupancy controls or adjustments Daylight: Load Reduction
47 6 SCRUTINIZE THE AIR CHANGES QUESTION AIR CHANGE RATE REQUIREMENTS AND THEIR MOTIVATIONS

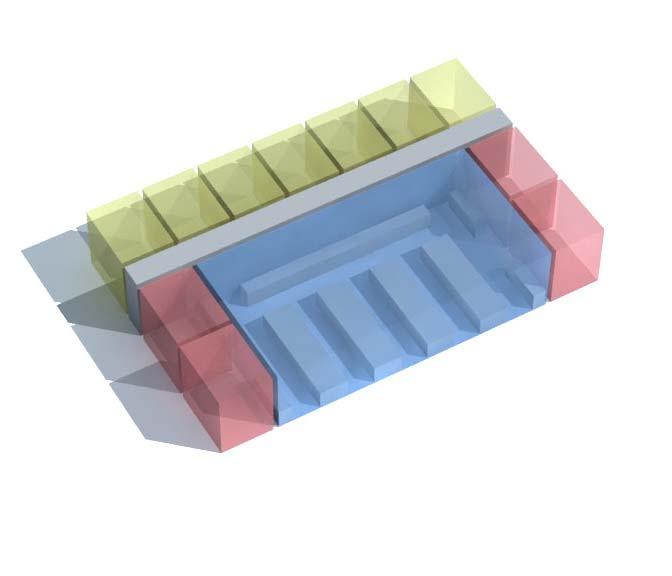
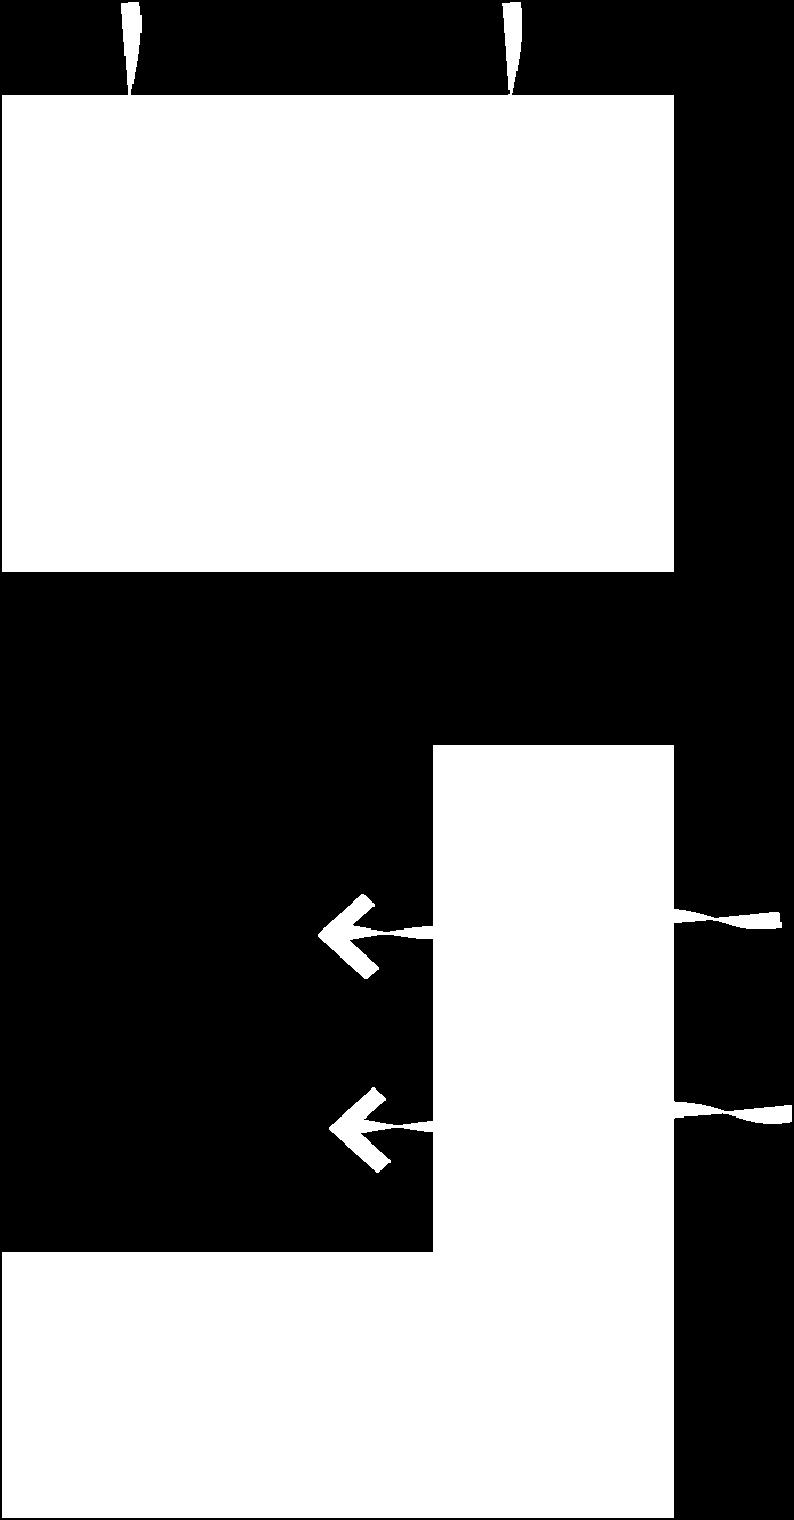
48 Ventilation Effectiveness


49 6 ACH 10 ACH Ventilation Effectiveness: Age of Air


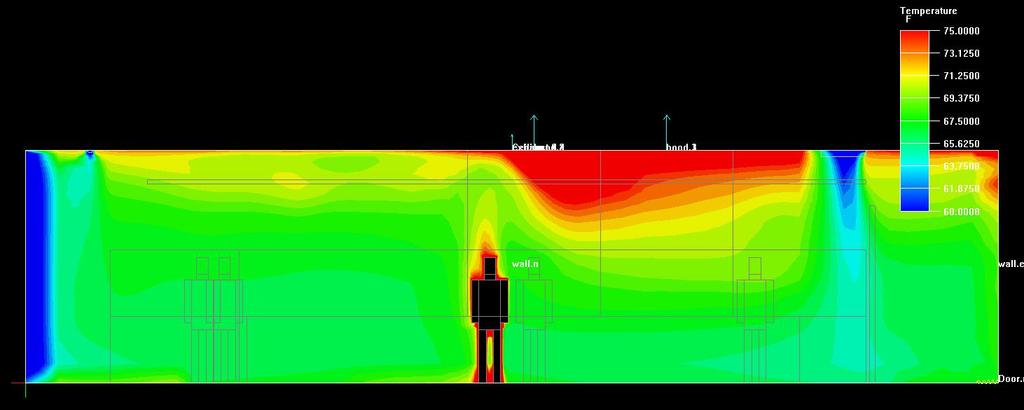

50 6 ACH 6 ACH 10 ACH Ventilation Effectiveness: Temperature 10 ACH


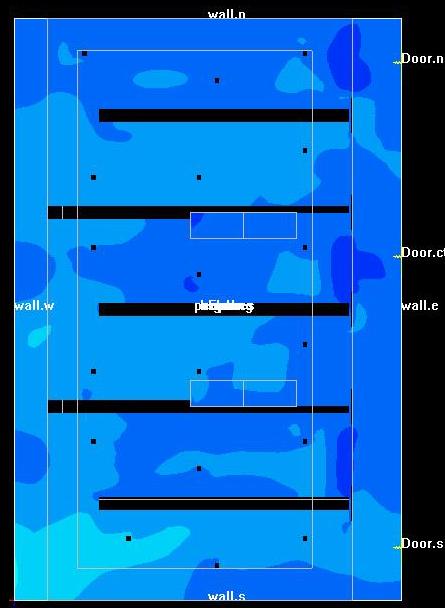
51 Office infiltration: Open window in office, open door to lab, neutral pressure between office and lab Lab exfiltration: 35 MPH wind on lab side with 1 crack on lab wall Ventilation Effectiveness: Pollutants
52 10 CALL THE COMMISSIONER ENSURE THAT THE BUILDING OPERATES AS IT WAS INTENDED


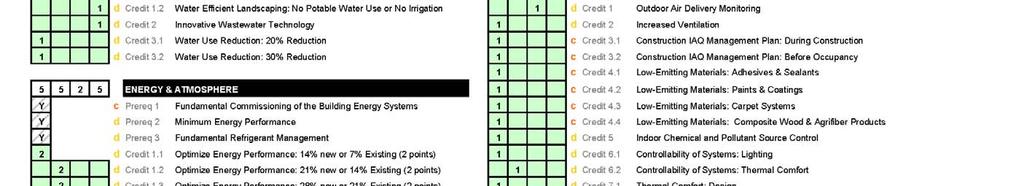

53 LEED Scorecard
54 Predicted Energy Savings
55 10 CALL THE COMMISSIONER Commissioning is especially cost-effective in laboratories Key: Diameter is equal to percent of annual energy savings (labs average ~7%) Source: Mills, et al., Building Commissioning: A Golden Opportunity for Reducing Energy Costs and Greenhouse Gas Emissions, Commissioning
56 Institutional Barriers to Implementation Strategies to Reduce the Carbon Footprint of Lab Buildings on Academic Campuses

57 Building Stock: 60% of built before 1970; only 94 buildings post Perception: Natural Ventilation vs. A/C- 80% are comfortable 80% of the time Funding: Private vs. publicly funded projects Metering: Who gets the utility bill? Policy: Who gets to say No? The Result: Likely LEED Gold, but. Denny Hall built 1895 Balmer Hall built 1962 PACCAR Hall complete Fall 2010 Mackenzie Hall built 1960 University of Washington


58 Users keep Track of Actual Temperatures User Acceptance of Change Standards and Practices Environmental Health and Safety Practices Project Schedules Accountability through Energy Metering Flexibility and Unknown Demands Barriers to Implementation


59 Life Safety: Welcome to the Ventilation Safety Committee. Innovation: Don t want to be the first and maybe not the second, either Certainty: The need for data, and lots of it Timeliness: On their schedule- not the project s The Result: A move away from standards towards performance-based criteria The Vision The Reality Institutional Barriers- EH&S
60 Not Easy to Implement Requires: Committed Team That means you too! Integrated Design Strategies, not after thoughts Appropriate modeling and analysis Change in the Status Quo Aggressive Load Reduction
61 Lessons Learned Strategies to Reduce the Carbon Footprint of Lab Buildings on Academic Campuses
62 Lessons Learned Create the Right Team Do the Work to Document Possible Savings Start the Conversation Early with EH&S Start the Analysis Effort Early
63 Integrated Team University of Washington ZGF Architects LLP Affiliated Engineers, Inc. SOLARC Architecture and Engineering (energy modeling & early natural ventilation concepts) Seattle City Light (local utility, helped fund energy model and provides energy conservation incentives) BetterBricks Integrated Design Lab (utility-supported specialists consulting on many energy conservation features) Hoffman Construction (contractor, provided cost estimation) Summary
64 Post Occupancy Survey Results Percent of Occupants Satisfied Overall Building Thermal Comfort Acoustic Quality Office Layout Air Quality Benchmark EPA PLU BREN PSU Lighting Analysis in conjunction with the UC Berkeley Center for the Built Environment Post Occupancy

65 Questions?
66 Steve Tatge, University of Washington Tim Williams, ZGF Architects Chris Flint Chatto, ZGF Architects Strategies to Reduce the Carbon Footprint of Lab Buildings on Academic Campuses