Biomass Energy training curriculum J. de Koff, R. Nelson, A. Holland, T. Prather, S. Hawkins
|
|
|
- Donald Leonard
- 5 years ago
- Views:
Transcription


1 Biomass Energy training curriculum J. de Koff, R. Nelson, A. Holland, T. Prather, S. Hawkins This curriculum was developed through a Southern SARE grant and collaboration between Tennessee State University, the University of Tennessee, extension.org, and USDA-Rural Development. The objective of this curriculum is to provide training on biomass energy to extension agents and local officials so that they may deliver this information to their stakeholders.
2 Collaborators: Jason de Koff, Ramona Nelson, Adia Holland, Tim Prather, Sue Hawkins Cover design: Brett Seybert Funding was provided through the Southern Sustainable Agriculture Research and Education (SARE) Program Tennessee State University 3500 John A. Merritt Blvd. Nashville, TN TSU (A) Tennessee State University does not discriminate against students, employees, or applicants for admission or employment on the basis of race, color, religion, creed, national origin, sex, sexual orientation, gender identity/expression, disability, age, status as a protected veteran, genetic information, or any other legally protected class with respect to all employment, programs and activities sponsored by Tennessee State University. The following person has been designated to handle inquiries regarding non-discrimination policies: Tiffany Cox, Director, Office of Equity and Inclusion, tcox9@tnstate.edu, or Justin Harris, Assistant Director, Office of Equity and Inclusion, jharri11@tnstate.edu, 3500 John Merritt Blvd., McWherter Administration Building, Suite 260, Nashville, TN 37209, The Tennessee State University policy on nondiscrimination can be found at This curriculum and supporting documents can be accessed online (in full and as separate modules) at These training resources [the curriculum, not the references and additional resources] are freely available for educational purposes under the terms of Creative Commons Attribution-NonCommercial-NoDerivatives 4.0 International License. Attribution: Biomass Energy Training Curriculum by Jason de Koff, Tennessee State University, funded by Southern SARE. If you wish to adapt these curriculum materials for your own educational purposes, please contact the Curriculum Author for permission and files: Jason P. de Koff, Ph.D. (615) jdekoff@tnstate.edu
3 Part I: Introduction to Biomass Energy Environmental effects of bioenergy feedstocks Learning objectives: Participants will be able to explain the environmental effects of bioenergy feedstocks Participants will be able to describe how a life cycle analysis works Materials: PowerPoint slides Environmental effects of bioenergy feedstocks Lesson guide: Use the notes in this lesson guide to present information for each presentation slide. Questions found at the end of this lesson guide can be used to test participants knowledge at the end of the presentation. This can be combined with clickers to improve audience engagement and create discussion. An evaluation of the presentation can be found in this lesson guide following the lesson questions. Topics: Life cycle assessment CO 2 release in different feedstock production Algae production for bioenergy Water requirements for different feedstocks Future focus for bioenergy feedstocks 21


4 Slide 1 Topics will include life cycle assessment, CO 2 release in different feedstock production, algae production for bioenergy, water requirements for different feedstocks and the future focus for bioenergy feedstocks. Slide 2 The Renewable Fuels Standard is a mandate established by the federal government to help create an incentive for biofuel production. This mandate requires increasing amounts of biofuels to be used for transportation fuels. It is expected that by 2022, about 36 billion gallons of transportation fuel will come from biofuels each year. This is expected to decrease oil imports by $41.5 billion by Cellulosic ethanol and advanced biofuels use are mandated to increase over time (even if it has to be imported). Advanced biofuels are those that rely on newer technology and may also include biodiesel production. Slide 1 Slide 2 Slide 3 U.S. fuel consumption is dominated by fossil fuels at 83% of total consumption (37% Petroleum, 25% Natural Gas, 21% Coal) with nuclear energy at 9% and renewable energy at 8%. To manage risk involved in the volatility of this market, it is important to diversify our energy sources. When we manage risk we can look to something like a retirement plan which shows the number of sources involved to prevent major risks from having a significant impact. Slide 3 22

5 Slide 4 Life cycle assessments take into account everything from the production of the crop to its processing into fuel. So you can follow the amount of energy required throughout the whole process as well as other things like carbon dioxide production and carbon storage. Much of this is done with modelling. Slide 4 TAKE A BREAK FROM THE SLIDES TO DO THE ACTIVITY (below): Tracking carbon throughout the lifecycle of cellulosic ethanol; from growing switchgrass to conversion to use of the fuel. 1. Cut out each equation on the dotted line below. 2. Provide participants with images of process and chemical equations so that they can match each equation with the its process from start to finish. The correct sequence is: (I) with (A), (C), (E), or (F) (K) with (B) (L) with (D) (J) with (A), (C), (E), or (F) (N) with (A), (C), (E), or (F) (M) with (G) (O) with (A), (C), (E), or (F) (P) with (H) 23
6 (A) (B) (C) (D) 25
7 (E) (F) (G) (H) 27

8 (I) Planting 29
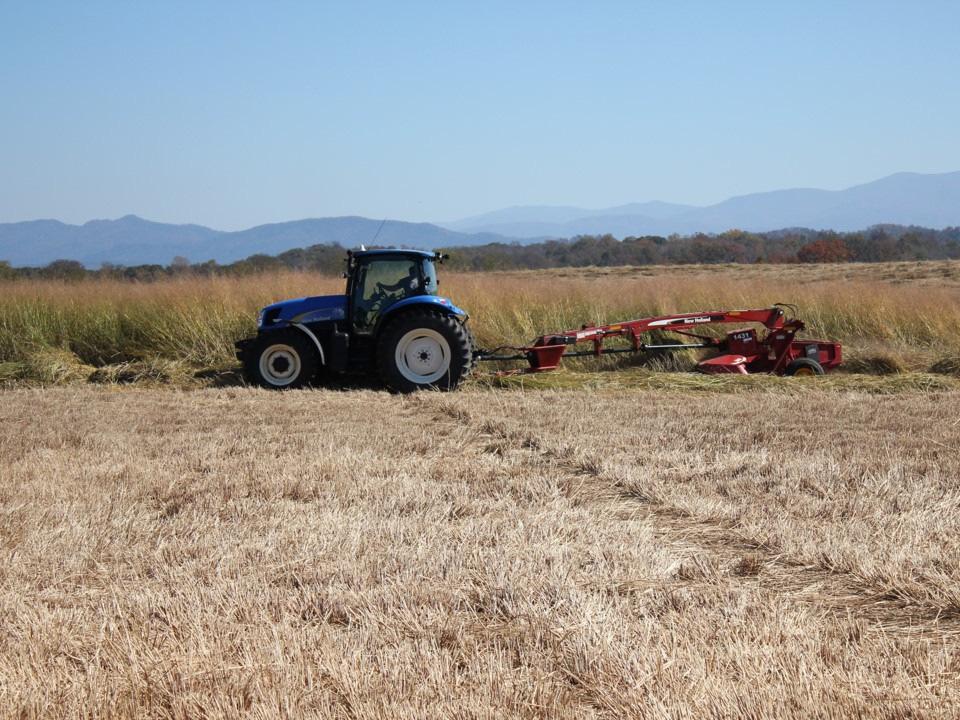
9 (J) Harvesting 31

10 (K) Plant production (after first season of growth) 33

11 (L) Fertilizer application 35

12 (M) Cellulosic ethanol production 37

13 (N) Baling and transportation to biorefinery 39

14 (O) Transportation of ethanol to gas station 41

15 (P) Driving with ethanol 43
 to get back to its original form. This is why it is considered a nonrenewable resource.")

, a tall cool season perennial with forage adapted to wet areas, and corn/soybean rotation under no-till (C/S NT) produce the most (Adler et al. 2007).")
16 Slide 5 The cycling time is also important when comparing different life cycle characteristics. In the carbon example, when fossil fuels are used the carbon that is released takes a long time (geologic time) to get back to its original form. This is why it is considered a nonrenewable resource. In the case of ethanol from plant materials, the cycling time is much shorter (within a season) for the carbon that is released to end up within plant material again. Slide 5 Slide 6 One study performed a life cycle assessment where they took into account all the different ways that carbon dioxide is released during the production of bioenergy from different feedstocks. This slide compares the carbon dioxide emissions produced from the creation of chemicals (fertilizers/pesticides) to grow these crops. In this case reed canarygrass (RC), a tall cool season perennial with forage adapted to wet areas, and corn/soybean rotation under no-till (C/S NT) produce the most (Adler et al. 2007). Slide 7 This slide shows a comparison in the carbon dioxide emissions produced from the fuel required to run the agricultural machinery used to grow and harvest these crops. In this case, hybrid poplar and corn/soybean rotations under no-till produce the most (Adler et al. 2007). Slide 6 Slide 7 45


17 Slide 8 After all components were integrated into the model, it was observed that, in comparison to the life cycle of gasoline and diesel, the ethanol and biodiesel produced from crops reduced GHG emissions. In the end, switchgrass and hybrid poplar were best at these reductions. What are these other components? Yield and conversion rate, release and uptake of N2O and methane (Adler et al. 2007). Slide 9 Algae has been identified as a potential biofuel product because it does not compete with food crops and it has higher energy yields on a per area basis than terrestrial crops. It also has less potential to contribute to eutrophication and can be cultivated on marginal land using freshwater or saltwater. The microalgae can be grown in large systems, then dried and the oils that they produce can be extracted and converted to biodiesel. How do other factors involved in their production compare with other feedstocks? Slide 10 This slide compares the energy required to produce one functional unit of energy (Clarens et al. 2010). Slide 8 Slide 9 Slide 10 46

18 Slide 11 This slide shows the greenhouse gas emissions from the production of one functional unit of energy. The three crops actually create a carbon sink while the energy production from algae releases carbon. If you note, corn is a better sink in this article than switchgrass while in the previous study it was the opposite. Everyone s model is going to be different, some with have attributes that others do not or use different data sources which can make the Slide 11 overall output different. That is why it is very important to see what makes up each model. This one did not take into account the conversion to fuel but estimated energy based on the biomass itself. Slide 12 This slide shows the water required to produce of one functional unit of energy. As can be expected, algae has a huge water requirement since this is the medium in which the algae can grow and survive. So is using algae for biofuel production not a viable option? There are options but they require planning. To reduce greenhouse gas emissions, carbon dioxide can be used from flue gas produced from a coal power plant. Normally carbon dioxide is bubbled into the system adding to cost and Slide 12 greenhouse gas production but if you use a waste project, it reduces both. To reduce water consumption, energy, and GHG, using wastewaters from wastewater treatment plants are an option that could prove viable. This of course requires planning in the construction of algae growth ponds near these facilities. 47
, clean drinking water will become an issue for human consumption and ecosystem maintenance.")


19 Slide 13 Speaking of water, what is the water footprint of other bioenergy feedstocks? The water footprint is important because as world population increases (to 9.2 billion in 35 years), clean drinking water will become an issue for human consumption and ecosystem maintenance. Currently, about 86% of the world s freshwater resources are used for the agricultural production of food and fiber. We Slide 13 don t want to add energy production to this burden. Therefore, it is very important to identify those feedstocks that make the most the water available. Slide 14 The table shows a comparison of different feedstocks and the amount of water they require per energy unit. Rapeseed canola is identified as the highest water user in this list but this is most likely a spring-type variety which grows during the summer months. In Tennessee, we are looking at growing a winter variety which presumably would not use as much water. The study did not take into account the energy required for production so this underestimates the water footprint (Gerbens-Leenes et al. 2009) Slide 14 Slide 15 So based on some of the environmental effects of different biofuel feedstocks, what do we do? If we start producing biofuel feedstocks on cropland what happens? Food prices go up because the supply goes down. We want to be both energy secure and food secure so this will not work. Also, when prices go up, other countries will start producing these food crops and in many cases will clear land for ag production which has its own environmental concerns, particularly in certain areas of the world. This causes release of C from the soil contributing to GHG emissions. The resulting release of Slide 15 carbon dioxide from burning or decomposing biomass and oxidizing humus can negate any greenhouse gas benefits of biofuels for decades to centuries. 48

20 Slide 16 Therefore, it is important to focus on feedstocks that are going to cause the least environmental impact from the perspective of things like water usage, land use, and carbon dioxide production. 1. Perennial plants like switchgrass can be utilized to produce cellulosic ethanol or combusted to produce electricity. These plants minimize erosion because they only have to be planted once, their deep root systems help store carbon in the soil, they are efficient users of water and nutrients. Degraded lands like CRP land could be used. Slide If corn is already being grown, the crop residues can be used as a bonus crop for the production of biofuels. The key is how much can be removed that will maintain soil carbon and prevent soil erosion. These values vary depending on soil type, U.S. region and tillage practices and can range from 25-70% removal rate. 3. Forested areas can be managed where material removed from the thinning process and material left over after tree harvests can be used for biofuel production. 4. Double crops, like winter canola, can be grown in the winter season in between conventional row crops. These crops can help keep soil in place during the normal winter fallow period and can allow more corn stover removal. Mixed cropping systems allow food and energy crops to be grown at the same time. 5. Municipal wastes (paper, cardboard, yard waste, plastics) can be converted to liquid fuels. Most of these won t adversely alter water usage or N/P release by growing these feedstocks (double and mixed cropping systems might). Economic factors will improve with technology. 49


21 Slide 17 A group of scientists tried to account for these concerns and tried to model what might occur if some of these considerations were implemented. This slide shows their graphic of the current situation where we have grassland for forage production and cropland for food and fiber production with a sizeable amount of idle land. Slide 18 By incorporating the suggestions we talked about previously, we can see that all idle land is used with the majority of it being devoted to producing cellulosic crops for ethanol production. Slide 17 There is greater carbon dioxide production due to an increase in fermentation for the production of ethanol. Remember, however, that this carbon dioxide is coming from plants which is more renewable than fossil fuels which have a much longer carbon cycle. Slide 18 According to the study, by implementing some of these ideas, they estimated that they could use less than 30% of total U.S. cropland, pasture, and range and produce 400 billion liters of ethanol annually without decreasing domestic food production or agricultural exports. This would also reduce U.S. greenhouses by 738 million tons carbon dioxide equivalent per year or over 10% of total U.S. annual emissions while increasing soil fertility and promoting biodiversity. The study incorporated the use of double crops, cellulosic perennials, and corn stover but not wood. 50


22 Test their Knowledge - Questions for the audience Q: Considering the CO2 produced by the creation of chemicals (including fertilizers and pesticides) used to grow these crops, of the reed canarygrass, the corn/soybean with notill, switchgrass, and hybrid poplar, which two produce the most CO2? A: Reed canarygrass and corn/soybean produce the most and switchgrass and hybrid poplar produce less. Q: Considering the CO2 produced by the fuel requirements to run the agricultural machinery used to grow these crops, of the reed canarygrass, the corn/soybean with notill, switchgrass, and hybrid poplar, which two produce the most CO2 and which two? A: Corn/soybean and hybrid poplar produced the most. Q: Which bioenergy crops had the greatest effect in reducing GHG? A: switchgrass and hybrid poplar Q: Why is algae being considered as a bioenergy crop? A: Does not compete with food crops, has a higher yield per acre than terrestrial crops, can be cultivated on marginal land using fresh or salt water, has less potential to contribute to eutrophication Q: What makes algae less desirable as a biofuel crop? A: higher energy requirements, higher GHG emissions, higher water usage Currently, about _86_% of the world s freshwater resources are used for the agricultural production of food and fiber. It is important to identify feedstocks that make the most of available water. Q: The two most important priorities for choosing biofuel feedstocks: A: 1. Choose those that produce lower life cycle CO2. 2. Choose those that do not compete with food production. Plant perennial crops on degraded lands abandoned from agriculture use. Use crop residues to produce ethanol or electricity. Use sustainably harvested wood and forest residues. Use double cropping and mixed cropping systems. 51
23 Evaluation Please give us your feedback regarding this activity. Your feedback will help us improve the activities you attend in the future. Name of Activity: Environmental effects of bioenergy feedstocks Date of Activity: A. Instruction Strongly Disagree Disagree Somewhat Disagree Somewhat Agree Agree Strongly Agree 1. The specialist was well prepared The specialist presented the subject matter clearly B. General Learning and Change 1. I have a deeper understanding of the subject matter as a result of this session I have situations in which I can use what I have learned in this session I will change my practices based on what I learned from this session Strongly Disagree Disagree Somewhat Disagree Somewhat Agree Agree Strongly Agree C. Specific Learning How much did you / do you know about these subjects? Very little Before this program I knew Little Some Much Very Much Very little Now I know. Little Some Much Very Much 1. What a life cycle assessment is Differences in biomass energy feedstocks related to carbon dioxide production and, water use 3. Potential feedstocks or ways to produce feedstocks that will not compete with food production D. Specific Practices To what degree did you / will you do the following? Very little Before this program I did Little Some Much Very Much In the future I will realistically do. Very Little Some Much Very little Much 1. Support activities related to expanding biomass energy production Seek information related to biomass energy Grow biomass energy crops E. Satisfaction with Activity 1. I would recommend this program to others Strongly Disagree Disagree Somewhat Disagree Somewhat Agree Agree Strongly Agree F. Other comments? Thank you for completing this survey!