Status of Salinity Network Workgroup (Q Meeting) April 18, 2013
|
|
|
- Jason Norman
- 5 years ago
- Views:
Transcription
1 Status of Salinity Network Workgroup (Q Meeting) April 18, 2013 Chair: Rick Copeland (FDEP) Co-Chair: Dave DeWitt (SWFWMD)
2 Why Have a Salinity Network? Since 1998, Florida has had below normal rainfall Water levels in wells generally decreased; on a statewide basis

3 Water level in a monitoring well ( )

4 Why? Lake that has gone dry

5 Why? Lake going dry

6 Specific Conductance in a Monitoring well ( )
7 Why? South Florida drinking water faces saltwater threat (Sun Sentinel: September 11, 2011) Cedar Key Wells Suffer Saltwater Intrusion (Citrus County Chronicle: June 21, 2012) All of these events are related
8 Salinity Network Workgroup (SNW) Under the umbrella of the Florida Water Resource Monitoring Council (Council) Audience General Public Policy Makers Scientists Network of Existing Networks Success is in our ability to cooperate
9 Mission (Abridged) to assist in the management, protection, preservation, and restoration of Florida s ground-water and surface-water resources, facilitated by the Council and the monitoring entities of the state Emphasis on the encroachment of saline water into our freshwater resources: Spring flows, SW flows, GW levels, Saline analytes such as Na, Cl, SC
10 Major Participants (To Date) NWFWMD SRWMD SJRWMD SWFWMD SFWMD USGS USACE DEP DACS LAKEWATCH Broward Co Ala Co Miami-Dade Co Collier Co Palm Beach Co
11 Recent Action Items 1. Assist the Council as needed 2. Develop Indices for: GW Levels (GWL) and GW Quality (GWQ) 3. Develop a glossary of terms and acronyms for the SNW
12 Completed and Now Updating GW Monitoring Catalog Sites Well data By Aquifer and Aquifer System Water Level and Quality data On hold until WIN Database operational SNW will deliver well data, upon request of Council
13 One Objective Develop and use indices to evaluate the status and trends of saltwater encroachment Uniform among monitoring entities Easy to understand by the general public, policy makers and the scientific community. Indices used to assist in evaluating the threat of encroachment to water supplies, and to determine its cause.
14 Other Objectives (To be considered at a Later Date) Evaluate the best GW sampling methodologies for saline water given its physical properties, and Develop SOPs for them
15 Indices GW Level Index 1. Why - Because lowering GWL increases potential for encroachment (horizontally and vertically) 2. Easy to produce & to understand GW Quality Index 1. In beginning stages 2. Much more complex than GWL Index

16 Ghyben-Herzberg Relationship

17 Saltwater, Freshwater, and Transition Zone


18 Complex GW System (Northeast Florida)

19 Example of Saltwater Intrusion in Complex System


20 Chloride Concentrations in Floridan Aquifer System

21 GWL Declines in the FAS (1990)
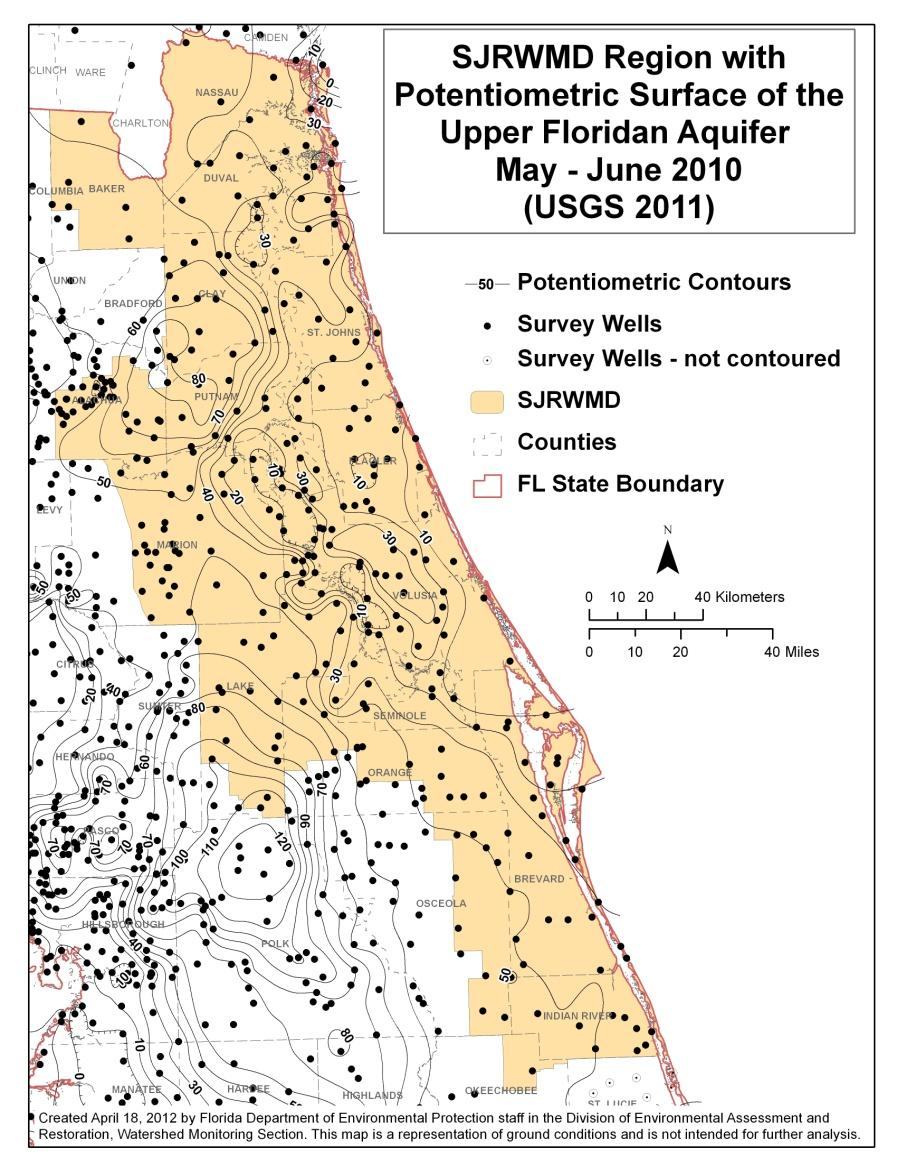
22 GWL Pilot Study Decided on Percentile Ranking [Percentile Ranking Index (PRI)] Pilot Study Generate a PRI Map Spring 2010: Upper Floridan aquifer (UFA) Purpose To overcome obstacles If so, periodically produce PRI maps for aquifers, and at various scales Possibly Produce side-by-side potentiometric maps with PRI maps
23

24

25

26
27 Major Issues PRI methods differ among WMDs If a statewide PRI map is generated, it may be slightly different from the analogous PRI map produced by a WMD For a statewide map, verbiage must make this clear to its readers.
28 Issues: Resolved and Unresolved Adopted PRI method: in Excel PR(x) = [# obs < x / (n-1)] 100 Will Compare PRIs (Excel, Hydstra) FDEP to supply example data Participants will calculate PRIs SNW then compares results Virtually no differences (as of yesterday)
29 Issues: Resolved and Unresolved Prefer POR: Accept up to 1985 Referred to as (313 wells) (Ala, SF, FDEP - no wells) (449 wells) (Ala, SF, FDEP - no wells) ( 605 wells) (Ala, SF, FDEP - included) Two Pilots? A B Present (Ala, SF, FDEP included) Compare results and then make final decision
30 Issues Contin Recorders vs Discrete Samples How do we treat Continuous recorder data? We will compare PRs Daily, with M, Q, and Biannual data, where data are available Min # obs for selected POR? (100)
31 Issues In Final Document, Clarify purpose of the PRI analysis Overall status of GW levels within aquifer Will discuss areas of low PRIs in text Avoid conflicting with assessments routinely being reported by WMDs for hydrologic conditions
32 GWQ Index In beginning stages Much more complex than GWL Index
33 GW Levels in Monitoring Well
34 Chloride Concentrations in Monitoring Well ( )

35 Conductivity profile in well
36 Rick Copeland Questions?