Optimising Energy Use in Water Treatment Sustainable Solutions
|
|
|
- Rodney Lang
- 5 years ago
- Views:
Transcription
1 Optimising Energy Use in Water Treatment Sustainable Solutions Water for Power and Industry Kieran Healey SCI 28 th October 2010

2 Contents 1. Industry drivers for energy optimisation 2. Sustainable solutions how to assess 3. Carbon footprint 4. The new Water Impact Index -WII 5. Conclusions 6. Questions..
3 1 Industry drivers for energy optimisation


4 Industry drivers 4


5 The water/energy relationship Fossil Fuels Energy Generation GHG Emissions Climate Change Impact on freshwater resources Changing precipitation patterns Water Scarcity Water Quality Increased water demand 5
6 2 Sustainable solutions how to assess

7 Water Use in Power Generation Seawater desalination Cooling tower Rain water collecting Industrial water production Scrubbing Wastewater Treated wastewater discharge or reuse To WWTP Boiler house Wastewater treatment plant Other water sources: Surface water Groundwater Boiler feed water production To WWTP Mineral sludge treatment and recovery Condensate polishing To WWTP


8 Technology selection water treatment & reuse Water Scarcity & Safety Competition over abstraction Climate threats Irregular quality Salinity Exhaustion of water resources Accidental contamination Production needs Increases in production Continuous and safe water supply Avoid production shutdown Compliance with Regulation Limitations of water intake Discharge limits No discharge possible Low carbon Measures Technology Selection Economic Implications Water consumption costs Discharge fees Capex & Opex Power cost inflation Future GHG emissions costs Technology preference Existing equipment Site restrictions Raw water quality Treated water quality Experience Corporate Image Environmental guidelines Shareholder expectations Public opinion Corporate image Environmental Implications GHG emission targets Carbon trading schemes Water use impact
9 Key technologies for water reuse Clarification: Actiflo Filtration: Filtraflo Large/Concrete Filters, Multiflo, Multimedia Filters, Recyclo Biological treatment: Biosep / Biosep Pack, Biostyr, MBBR Membrane filtration systems: Microfiltration / Ultrafiltration / Nanofiltration / RO, Uflex Ion exchange systems: Duo Eclipse, Rapide Strata ZLD concepts: Crystallizer, Evaled, Ceramem Disinfection: UVStar, ClO 2, ozone Metal recovery systems: Recon Compact, Hardtac, Metclean, Auroclaim OPUS, CEDI-LXTechnologies GAC filtration or biofiltration for color, organic and micro-pollutants removal Low-pH or High-pH RO for acidic or basic baths recycling
10 Sustainable solutions How do we select the most energy efficient, sustainable technology? Decision Making Process Based on Sustainability 10

11 2 3 Carbon footprint


12 Carbon footprint levels Water Treatment Chemical Supply Equipment supply Process Optimisation Solutions Provision


13 Life cycle assessment

14 LCA environmental impacts Global warming Fossil fuels depletion Acidification Smog Ozone layer depletion Eutrophication Toxicological pollutants Habitat destruction Desertification Land use Minerals depletion Etc.

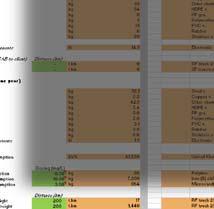
15 Carbon footprint assessment Perimeter n Emission factor Carbon Footprint = Ai * EFi Units Construction m 2 /m 3 /tonnes Operation kwhr/d Maintenance- 5/10/20 years i 1 Activity data kgco 2 e/unit Emission Factor Data Bases ICE, UKWIR, ADEME, Eco Invent, AUDCC, VWS Specific Factors


16 Bottom up concept Embodied Carbon Operational Carbon Cumulative Carbon Life cycle Non Traded price of carbon Discount rate Damage rate increase Maintenance Carbon Whole Life Carbon Cost Life Cycle Costs (Capex + Opex) Whole Life Carbon Cost Total Cost for Cost Benefit Analysis

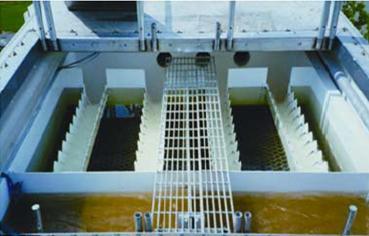
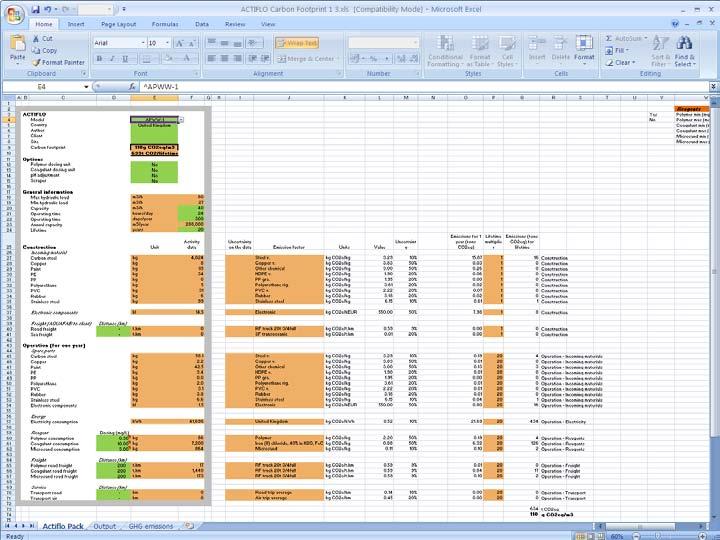


17 Standard equipment carbon calculation tools Clarification: Actiflo 17
18 Solutions evaluation

19 EOLIA TM decision support tool Top down concept Enables treatment configurations to be evaluated in terms of energy and GHG emissions Identification of process hot spots Effect of integration of new technology Can be used to as an optimisation tool for existing operations Quick evaluation of numerous treatment options based on local conditions

20 Water treatment modules Clarification Coagulation Flocculation Settling Flotation Filtration Sand filter GAC filter Dual filter Membranes Prefiltration Microfiltration Ultrafiltration Manofiltration RO Water Transfer Intake pumping Distribution net work Consumables Production GHG Credit Disinfection/ - Thermal Oxidation - Electric Ozonation UV radiation Chlorination Chemical PAC Remineralisation Neutraliastion - Flue gases treatment - Waste Storage Thermal distillation Multi-stage flash Multi effects MVC Other Treatment steps Ion exchange Electrodialysis Biological 20
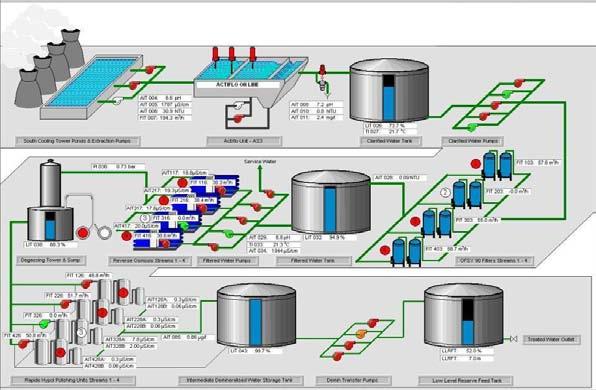
21 Water treatment system Electricity Electricity, chemicals Electricity, chemicals Electricity, heat chemicals, spare parts Electricity, chemicals Electricity Raw water in water resource Intake pumping Clarification Filtration Advanced treatment processes Disinfection Distribution Liquid effluents Electricity Liquid effluents Potable water delivered to users Sludge treatment Liquid effluents
22 LCA: System studied INVENTORY INPUT FLOWS: Fossil fuels Minerals Background processes Production of chemicals Production of concrete Production of electricity Ecoinvent Foreground ound processes INVENTORY OUTPUT FLOWS: Emissions to air Raw water In water resource Intermediary input flows Construction Operation Intake pumping Water treatment Water distribution Emissions to water Emissions to soil Technical modeling of VWS processes Decommissioning Potable water LCA system Liquid effluents

23 User interface
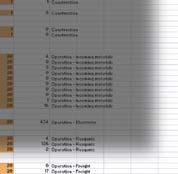
24 GHG emission output Contribution of each stage in % of the total GHG emissions Electricity production for intake and distribution 60% 40% 20% 0% Electricity production for water treatment Coagulant production Ozone production GAC/PAC production Chlorine production Liquid discharge from water treatment Plant and piping network construction
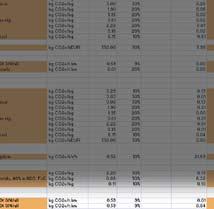
25 Solution comparison GHG emissions of the potable water supply system in kg CO 2 -eq/m 3 of potable water 0,1 0,1 0,05 0,05 0 Pretreatment using enhanced ozonation, sand and granular activated carbon filtration 0 Pretreatment using clarification, dual filtration and UF membrane process Electricity production for pretreatment Ozone production UF membrane production and renewal Coagulant production Granular activated carbon production Plant and piping network construction

26 4 The new Water Impact Index - WII

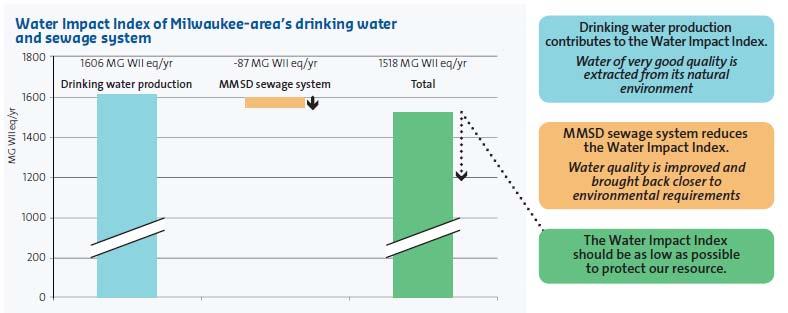
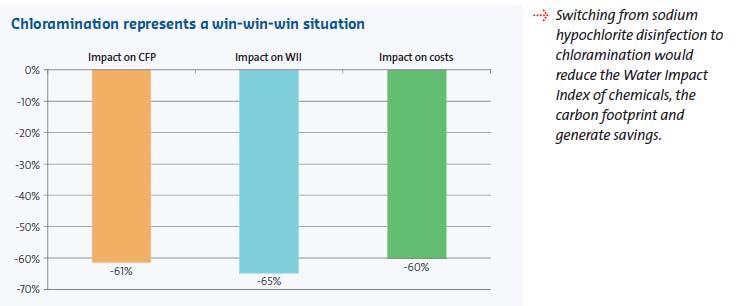
27 Water Impact Index 27


28 Water Impact Index 28


29 Water footprint development Following on from our experience with carbon foot print Environmental indicator more in line with core business Interlinked with carbon footprint 29

30 First carbon water analysis 30

31 Water system evaluated 31

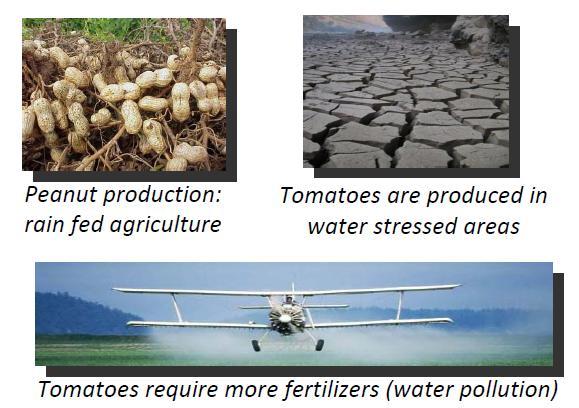
32 Carbon - Water Impact assessment 32

33 Carbon - Water Impact assessment 33

34 Conclusions Provision of water treatment solutions to the meet the future requirements of Industry will require not only an innovative use of technology, but also an innovative approach to technology selection to ensure a sustainable solution Optimisation of energy use and reduction of GHG emissions in water treatment is intertwined with water use Veolia Waters combined carbon footprint and water Impact Index tools can be used to determine water treatment solutions that create minimal environmental impact Coupled with conventional economoc analysis they provide a multi criteria analysis to achieve a «best in class» decision making process
35 Thank You for your Attention Any Questions Please!