CHAPTER 16 LAND USE 16.1 ENVIRONMENTAL SETTING/AFFECTED ENVIRONMENT YUBA REGION
|
|
|
- Roberta Robertson
- 5 years ago
- Views:
Transcription
1 CHAPTER 16 LAND USE Counties and incorporated cities regulate land use within the Sacramento Valley. This section presents an overview of land use conditions in the Sacramento Valley, with specific attention to land uses that potentially could be affected by implementation of the alternatives considered in this EIR/EIS. Potential effects on land use, management and planning include: Changes to uses of existing lands that would alter the use of those lands, such as changes in levels or types of activities; Direct effects on adjacent land uses, such as those that could occur from placing incompatible land uses together; Removal or retirement of agricultural land from production; The potential for conflicts with lands owned or managed by local, state, or federal governments; and Changes in water temperature that would impact crop yield or productivity ENVIRONMENTAL SETTING/AFFECTED ENVIRONMENT The land use and land management practices that are currently in place, and which may be influenced by implementation of the Proposed Project/Action and alternatives, are described below. Project study area regions include the Yuba Region, the CVP/SWP Upstream of the Delta Region, and the Delta Region. The land use information provided below is organized by region, and identifies those areas where land use activities could potentially be affected by the alternatives considered in this EIR/EIS YUBA REGION The local study area for land use and land management activities in the Yuba Region is Yuba County. Agriculture is the most extensive land use in Yuba County and the most significant component of the county's economy. Approximately 278,943 acres, or 68 percent of the total county area, are comprised of agricultural croplands and pasture. The value of agricultural land is not limited to the provision of food, fiber and jobs. Agricultural land also provides open space, which has both psychological and aesthetic benefits, and provides important wildlife habitat. The importance of agricultural land preservation can, therefore, be viewed from both an economic and environmental perspective. Yuba County recognizes the importance of agricultural land and the need to place an emphasis on its preservation. The county's desire to preserve its most valuable farmland and to support the economic viability of the agricultural economy is reflected in goals, objectives, policies and implementation strategies in the Yuba County General Plan. The General Plan is not intended to restrict existing, new, or expanding agricultural operations. In fact, agricultural operations including, but not limited to, the raising of livestock, all soil cultivation and related activities to crop production, harvesting, and processing, and timber management and harvesting are Draft EIR/EIS Page 16-1
2 considered uses by right 1 in all Yuba County General Plan designations and zoning districts that permit agriculture (County of Yuba 1996). Farmland maps are created by the Farmland Mapping and Monitoring Program (FMMP), under the direction of the U.S. Department of Agriculture (Figure 16-1). In 2000, total Prime Farmland was measured at 44,486 acres, or 1,299 acres less than the 1998 total. A considerable amount of land in Yuba County is used for rice production. Rice is cultivated in the majority of the Member Unit service areas, typically on clay or other poorly drained soils with impervious layers. These soil types are fairly impermeable to water, which increases their water use efficiency for rice production. Rice is an aquatic crop requiring almost continuous flooding until the time of harvest. Fields for rice crops typically are initially flooded during April or May and then irrigated through August, which accounts for the peak in agricultural water diversion volumes during this time period. Rice farmers require warmer water during the spring and summer for germination of seeds and growth of rice (i.e., 65 F from approximately April through mid-may, and 59 F during the remainder of the growing season) (DWR 2001). Generally, water temperatures above 60 F to 65 F are reported to be suitable for rice production (Mutters et al. 2003a). Research indicates that an entire crop may be lost as a result of exposure to as little as 4 days (100 hours) of water temperatures below 55 F during the early part of the growing season, and about 60 percent yield reduction may occur as a result of exposure to as little as 8 days (200 hours) of water temperatures below 60 F (Mutters et al. 2003a). Reduced water temperatures early in the growing season can cause delayed or failed germination, reduced growth rates, reduced or delayed tillering, panicle sterility, or seed head blanking (Williams and Wenning 2003). Yield reduction associated with cold water has been reported to be most pronounced when cold water exposure occurs early during the growing season (6 weeks to 7 weeks after planting) (Mutters et al. 2003a; Mutters et al. 2003b). However, reproduction, which occurs slightly later, reportedly also is affected by reduced water temperatures (Mutters et al. 2003b). Water applied to rice paddies is diverted from the main diversion canals via turnouts. The temperature of water entering the paddy tends to be the coldest water temperature in the field, and effects of cold water on rice yield tend to be localized near the field irrigation inlet, although effects have been observed in adjacent checks where cold water has seeped though the dividing levees (Mutters et al. 2003b). Rice production within checks tends to be affected by cold water temperatures in a predictable pattern of distribution of varying severity of effect. Because rice plants may be more susceptible to the effects of water temperature during the early phases of development when rice plants transition from growth to reproduction (Mutters et al. 2003b), which generally occurs prior to July 31, the analytical time period utilized for assessing potential water temperature-related impacts on agricultural production, represented by changes in rice production, is May 1 through July 31. Water temperature data at Daguerre Point Dam for this evaluation period are presented in Chapter 9. 1 Land uses permitted in a zoning district are classified in one of two ways, either as special uses or uses by right. Special use permits allow certain land uses in a given zoning district that require more in-depth studies than uses permitted "by right" in a zoning district. Special uses generally require an application to, and approval from, the City Council or other governing agency. Uses by right do not require special permission, although, in some instances, an individual may be required to submit a site plan or follow designated regulations (City of Radford Website 2007). Draft EIR/EIS Page 16-2


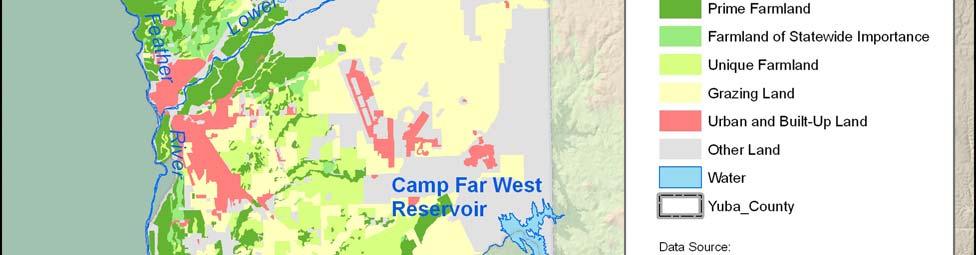
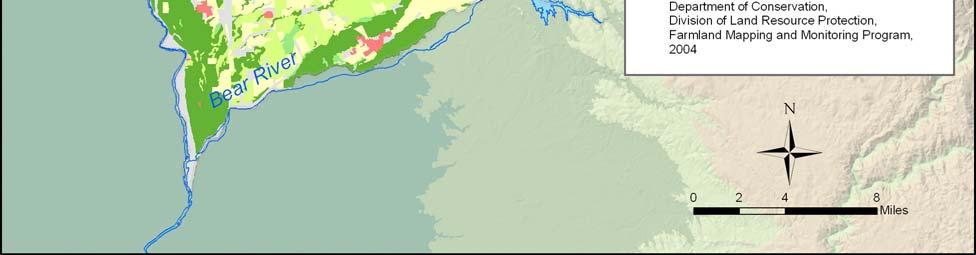
3 Figure Yuba County Farmland Designations Draft EIR/EIS Page 16-3
4 CVP/SWP UPSTREAM OF THE DELTA REGION Counties located upstream of the Delta that are adjacent to the water bodies and facilities in this region (i.e., Shasta and Oroville reservoirs and the Feather River and Sacramento River corridors) include Shasta, Butte, Sutter, Colusa, Tehama, Yolo, and Sacramento. Land use in these counties is primarily of an agricultural nature (e.g., livestock grazing, irrigated crop production, and orchard and vineyard operations). Almost 80 percent of the irrigated land in California is located in the Central Valley. Water deliveries for agriculture average about 22.5 MAF per year, with the CVP providing about 25 percent, the SWP about 10 percent, local surface water rights about 30 percent, and groundwater about 35 percent. Farmers in irrigation districts that receive CVP supplies also use other supplies such as groundwater. Use of non- CVP sources varies annually because of changes in weather and crop market conditions (Reclamation Website 2004). Actions associated with the Proposed Project/Action and alternatives could make additional water supplies available to Reclamation and DWR for delivery to CVP and SWP contractors during drier conditions when deficiencies may occur. However, no changes to existing land uses upstream of the Delta are anticipated, other than the potential for regional growth discussed in Chapter 18, which will likely occur whether or not the Proposed Project/Action or an alternative is approved and implemented. Because a portion of water from the Yuba Accord Alternative would be provided to the EWA Program to supplement CVP/SWP water supplies during drier conditions, it would improve CVP/SWP operational flexibility and federal and state water contractor supply reliability in deficiency years. Although Reclamation and DWR could choose to deliver all or a portion of the supplemental transfer water that would be provided by YCWA under the Proposed Project/Action and alternatives to federal or state water project contractors, the amounts delivered would not exceed the water delivery amounts and entitlements authorized in existing CVP/SWP water purchase contracts. Therefore, there would be no changes to land uses within the CVP/SWP Upstream of the Delta Region resulting from the alternatives evaluated in this EIR/EIS and, thus, further evaluation of such potential changes is not necessary DELTA REGION As described above, actions associated with the Proposed Project/Action and alternatives could make additional water supplies available to Reclamation and DWR for delivery to CVP and SWP contractors during drier conditions when deficiencies may occur. Although Reclamation and DWR could choose to deliver all or a portion of the supplemental transfer water this would be provided by YCWA under the Proposed Project/Action and alternatives to federal or state water project contractors, the amounts delivered would not exceed the water delivery amounts and entitlements authorized in existing CVP/SWP water purchase contracts. Therefore, land uses within the Delta Region and south of the Delta would not change as a result of implementing an alternative evaluated in this EIR/EIS. Because no such changes are anticipated, further evaluation of such potential changes is not necessary REGULATORY SETTING The following discussion, derived from the EWA Final EIS/EIR (Reclamation et al. 2004), describes state and federal land management programs that promote the preservation of agricultural lands in California. Draft EIR/EIS Page 16-4
5 FEDERAL CONSERVATION RESERVE PROGRAM The Conservation Reserve Program is a federal program administered by the Farm Service Agency. This voluntary program offers annual rental payments, incentive payments and annual maintenance payments for certain activities, and cost-share assistance to establish approved vegetative cover on eligible cropland. To be eligible for placement in the Conservation Reserve Program, land must be: (1) cropland, including field margins, planted or considered planted to an agricultural commodity during at least 4 of the 6 crop years from 1996 to 2001, and physically and legally capable of being planted in a normal manner to an agricultural commodity; or (2) certain marginal pastureland that is enrolled in the Water Bank Program or suitable for use as a riparian buffer or similar water quality purposes. WETLANDS RESERVE PROGRAM The Wetlands Reserve Program is a voluntary program offering landowners the opportunity to protect, restore, and enhance wetlands on their property. The U.S. Department of Agriculture Natural Resources Conservation Service provides technical and financial support to help landowners with wetland restoration. The goal of the Natural Resources Conservation Service is to achieve the greatest wetland functions and values, along with optimum wildlife habitat, on every acre enrolled in the program. The Wetlands Reserve Program offers landowners an opportunity to protect wildlife and establish long-term conservation and wildlife practices. In California, this program has focused on the restoration of a variety of wetland types throughout the state, including seasonal wetlands, semi-permanent marshes, vernal pools along the perimeter of the Central Valley, riparian corridors, and tidally influenced wetlands STATE WILLIAMSON ACT The California Land Conservation Act of 1965, commonly referred to as the Williamson Act, enables local governments to enter into contracts with private landowners for the purpose of restricting specific parcels of land to agricultural or related open space use. In return, landowners receive property tax assessments that are much lower than they otherwise would be because they are based on farming and open space uses as opposed to full market value. Local governments receive an annual subvention of forgone property tax revenues from the state via the Open Space Subvention Act of Of California s 58 counties, 52 have adopted the Williamson Act program. Currently, Yuba County has not adopted the Williamson Act program. CALIFORNIA FARMLAND CONSERVANCY PROGRAM The California Farmland Conservancy Program is a voluntary program that seeks to encourage the long-term, private stewardship of agricultural lands through the use of agricultural conservation easements. The California Farmland Conservancy Program provides grant funding for projects that use and support agricultural conservation easements for protection of agricultural lands. An agricultural conservation easement is a voluntary, legally recorded restriction that is placed on a specific property used for agricultural production. The goal of an agricultural conservation easement is to maintain agricultural land in active production by Draft EIR/EIS Page 16-5
6 removing development pressures from the land. Such an easement prohibits practices that would damage or interfere with the agricultural use of the land. Because the easement is a restriction on the property, the easement remains in effect even when the land changes ownership. FARMLAND MAPPING AND MONITORING PROGRAM The FMMP, established in 1982, produces maps and statistical data used for analyzing changes in California s agricultural resources. Every two years, the maps are updated using aerial photographs, a computer mapping system, public review, and field reconnaissance. The twoyear period is called an update cycle. FMMP rates agricultural land according to soil quality and irrigation status, and designates the best quality land as Prime Farmland. The FMMP land use categories are as follows: Prime Farmland Land with the best combination of physical and chemical features to sustain long-term production of agricultural crops. This land has the soil quality, growing season, and moisture supply needed to produce sustained high yields. Land must have been used for production of irrigated crops at some time during the two update cycles prior to the mapping date. Farmland of Statewide Importance Land similar to Prime Farmland that has a good combination of physical and chemical characteristics for the production of crops. This land has minor shortcomings, such as greater slopes or less ability to store soil moisture than Prime Farmland. Land must have been used for production of irrigated crops at some time during the two update cycles prior to the mapping date. Unique Farmland Land with lesser quality soils used for the production of the state s leading agricultural crops. This land is usually irrigated, but might include nonirrigated orchards or vineyards, as found in some climatic zones in California. Land must have been cropped at some time during the two update cycles prior to the mapping date. Farmland of Local Importance Land of importance to the local agricultural economy, as determined by each county s board of supervisors and a local advisory committee. Grazing Land Land on which the existing vegetation is suited to the grazing of livestock. Urban and Built-up Land Land occupied by structures with a building density of at least one unit to 1.5 acres, or approximately six structures to a 10-acre parcel. Water Water areas with an extent of at least 40 acres. Other Land Land that does not meet the criteria of any other category. INTERIM FARMLAND MAPPING CATEGORIES Farmed areas that lack modern soil survey information or for which there is expressed local concern about farmland status use the following interim farmland mapping categories in place of FMMP land use categories: Irrigated Farmland Cropped land with a developed irrigation water supply that is dependable and of adequate quality. Land must have been used for irrigated Draft EIR/EIS Page 16-6
7 agricultural production at some time during the two update cycles prior to the mapping date. Non-irrigated Farmland Land on which agricultural commodities are produced on a continuing or cyclic basis using only stored soil moisture LOCAL YUBA COUNTY GENERAL PLAN Adopted in 1996, the Yuba County General Plan contains a comprehensive plan for growth and development in Yuba County through 2015 (County of Yuba 1996). The General Plan includes the Element and Diagram, together with the Circulation and Open Space Elements, which together constitute the policy statements, designations and diagrams that support longrange planning and physical development in Yuba County. The Element of the General Plan has an overall goal of achieving and maintaining a balance among the conservation, development, and utilization of planned open space and natural resources. Overall, General Plan projections estimate that the population in Yuba County will increase to approximately 95,000 and will have an associated accommodation of approximately 34,000 total housing units by The General Plan also recognizes land use and planning changes occurring in association with the City of Wheatland, and states that the county shall cooperate with the cities of Marysville and Wheatland in land use and infrastructure planning and coordination of services essential to creating an environment in which economic development can occur. CITY OF WHEATLAND GENERAL PLAN Initially adopted in 1980, the City of Wheatland General Plan has subsequently undergone several updates (e.g., 1986 Element, the 1986 Circulation Element, and the 2004 Housing Element). The City of Wheatland recently completed an update to its General Plan, which identifies new land use and circulation designations for the city and surrounding planning area (Raney Planning & Management, Inc. Website 2006). The General Plan establishes a long-term vision for the physical evolution of the City of Wheatland and outlines policies, standards, and programs to guide day-to-day decisions concerning the city s development through General Plan projections estimate the city s population will increase from 3,000 in 2004 to approximately 30,100 in The City of Wheatland relies on the groundwater aquifer underlying the city for its municipal water supply. Consistent with the goals (to ensure a safe and adequate water supply for existing and future development) of the General Plan, YCWA has received approval and funding for a Yuba/Wheatland In-Lieu Groundwater Recharge and Storage Project, anticipated to begin construction in Although unrelated to the Proposed Yuba Accord, the Wheatland Project will extend the YCWA surface water delivery capabilities to the Wheatland area by providing additional conveyance facilities (see Chapter 5). Currently, all of the Wheatland area relies on groundwater. CITY OF MARYSVILLE GENERAL PLAN Adopted in 1985, the City of Marysville General Plan includes growth projections through The Marysville Housing Element, a part of the city s General Plan, was released in May 2005, and contains housing projections for the City of Marysville through The city generally is Draft EIR/EIS Page 16-7
8 located on lands over the North Yuba Subbasin, and domestic water service in the city is obtained entirely from groundwater and provided by the California Water Service Company, a privately owned utility. According to the 2005 housing element update, extension of water supply services to developing sections of the city can be accomplished through However, if a significant amount of development occurs outside of existing areas of the city, then demand for water could exceed the water supply capacity. In such an event, the plan recommends that the city carefully reexamine the potential effects of proposed developments on water system capacity ENVIRONMENTAL IMPACTS/ENVIRONMENTAL CONSEQUENCES Potential changes associated with the Proposed Project/Action and alternatives would directly alter both the timing and magnitude of storage volumes in New Bullards Bar Reservoir and flows in the lower Yuba River, with subsequent potential impacts to land use. Quantitative analysis of flows and temperatures has been conducted for the Yuba River system, and data from those analyses are used in this evaluation of impacts. Qualitative evaluations in this section discuss overall land use, potential land use conversions, including agricultural land, and local and project planning objectives within Yuba County IMPACT ASSESSMENT METHODOLOGY Implementation of the Proposed Project/Action or one of the alternatives evaluated in this EIR/EIS may result in changes to land use within the Yuba Region, including conversion of farmland. Baseline information for land use and important farmland were obtained from the FMMP in Geographic Information System format. Information on land use types and designations within Yuba County also were obtained from the Yuba County General Plan. Qualitative evaluations in this section discuss the potential changes in land use within Yuba County. The analysis evaluates any permanent conversion of agricultural land to other uses under the Proposed Project/Action and alternatives relative to the bases of comparison. Other potential land use impacts, such as inconsistency with general plans and policies, and incompatibility with adjacent existing land uses, were evaluated by reviewing the Yuba County General Plan. Rice yields are potentially affected by irrigation water temperatures diverted at Daguerre Point Dam, as water temperature is a very important factor in the productivity of rice. Yuba Project operations may potentially affect water temperatures at Daguerre Point Dam, where water for agricultural users is diverted from the lower Yuba River. Changes in water temperatures at Daguerre Point Dam could affect water temperatures at the agricultural diversions from the Main Canal (for additional information on potential water temperature changes expected to occur in the lower Yuba River, see Section ) IMPACT INDICATORS AND SIGNIFICANCE CRITERIA FOR LAND USE Impact indicators and significance criteria utilized in this evaluation were determined from city, county and agency land use general plans for the Yuba Region. The CEQA Guidelines Environmental Checklist Form also provided general guidance in the identification of circumstances that may result in impacts on the environment related to land use. The impact indicators and significance criteria for land use are presented in Table Draft EIR/EIS Page 16-8
9 Table Impact Indicators and Significance Criteria for Impact Indicator Land use designations Compatibility with surrounding land uses and regional character Farmland and agricultural acreage Protected lands Local and regional planning objectives; project planning objectives Agricultural impacts resulting from changes in water temperature Significance Criteria Alteration of the existing or planned designated land uses of an area. Change of the type or intensity of land uses resulting in incompatibility with existing surrounding land uses or incompatibility with the regional character. Substantial permanent reduction in agricultural acreage in a region or permanent conversion of any lands categorized as Prime Farmland, Farmland of Statewide Importance, or Unique Farmland under FMMP or Prime Farmland under the Williamson Act. Substantial permanent conversion of lands through the Farmland Conservancy or other land protection programs Conflict with adopted environmental plans and goals of local jurisdiction, as stated in its general, community, or other planning policy materials. Change in monthly mean water temperature ( F) at Daguerre Point Dam, relative to the basis of comparison, of sufficient magnitude and frequency to substantially affect agricultural production, for any given month of the evaluation period over the 72-year simulation period. As discussed in Chapter 4, CEQA and NEPA have different legal and regulatory standards that require slightly different assumptions in the modeling runs used to compare the Proposed Project/Action and alternatives to the appropriate CEQA and NEPA bases of comparison in the impact assessments. Although only one project (the Yuba Accord Alternative) and one action alternative (the Modified Flow Alternative) are evaluated in this EIR/EIS, it is necessary to use separate NEPA and CEQA modeling scenarios for the Proposed Project/Action, alternatives and bases of comparisons to make the appropriate comparisons. As a result, the scenarios compared in the impact assessments below have either a CEQA or a NEPA prefix before the name of the alternative being evaluated. A detailed discussion of the different assumptions used for the CEQA and NEPA scenarios is included in Appendix D. As also discussed in Chapter 4, while the CEQA and NEPA analyses in this EIR/EIS refer to potentially significant, less than significant, no and beneficial impacts, the first two comparisons (CEQA Yuba Accord Alternative compared to the CEQA No Project Alternative and CEQA Modified Flow Alternative compared to the CEQA No Project Alternative) presented below instead refer to whether or not the proposed change would unreasonably affect the evaluated parameter. This is because these first two comparisons are made to determine whether the action alternative would satisfy the requirement of Water Code Section 1736 that the proposed change associated with the action alternative would not unreasonably affect fish, wildlife, or other instream beneficial uses ENVIRONMENTAL IMPACTS/ENVIRONMENTAL CONSEQUENCES COMMON TO ALL SCENARIOS AND COMPARISONS : Changes in annual surface water deliveries that could result in potential impacts to existing land use designations Land use designations within the Yuba Region would be susceptible to change if there were a substantial shift in water deliveries to agricultural lands in the region, or if there were some other disruption to water supply in the area. Table 16-2 shows the total average annual surface water delivery for each of the scenarios being analyzed. Draft EIR/EIS Page 16-9
10 Table Average Annual Surface Water Delivery (TAF), Yuba Region Scenario Annual Average Surface Water Delivery CEQA Existing Condition CEQA No Project Alternative CEQA Yuba Accord Alternative CEQA Modified Flow Alternative NEPA No Action Alternative NEPA Yuba Accord Alternative NEPA Modified Flow Alternative With the exception of the CEQA Existing Condition, the average annual surface water delivery among all of the alternatives varies by less than 3 percent, less than an amount that will trigger a change in land use designation as a result of change in water supply. Thus, no change in land use designation is anticipated for any of the scenario comparisons, and impacts to land use designations would be less than significant for all of these comparisons : Changes in annual water deliveries and instream flow conditions that could result in potential impacts to the compatibility with surrounding land uses and regional character As described in Impact , changes in average annual surface water deliveries within the Yuba Region under any of the scenarios being analyzed will be less than 3 percent, less than the amount that would be likely to trigger any change in type or intensity of agricultural land use as a result of water supply. Additionally, no element of the Yuba Accord or Modified Flow Alternatives requires or mandates any change from existing land use patterns as a perquisite for the alternative. Thus, no change in compatibility with surrounding land uses is anticipated for any of the scenario comparisons, and impacts resulting in changes in compatibility with surrounding land uses will be less than significant for all of these comparisons : Changes in annual water deliveries that could result in potential impacts to farmland and agricultural acreage As described in Impact , changes in average annual surface water deliveries within the Yuba Region are not anticipated to be sufficient to prompt a substantial change in farmland or agricultural acreage, nor would any changes in water deliveries be of sufficient magnitude to cause a substantial shift in crop patterns or rotation. It is possible that the Yuba Accord or Modified Flow Alternatives may provide slightly more certainty in water deliveries than the No Project/No Action Alternatives, and may therefore represent a greater chance of retaining farmland and agricultural use patterns. However, no substantial change in farmland and agricultural use patterns is anticipated for any of the scenario comparisons, and impacts to farmland and agricultural acreage will be less than significant for all of these comparisons : Changes in annual water deliveries that could result in potential impacts to the conversion of lands to protected lands As described in Impact , changes in average annual surface water deliveries within the Yuba Region are not anticipated to be sufficient to prompt a substantial change in farmland or agricultural acreage. Additionally, no aspect of the Yuba Accord Alternative or the Modified Flow Alternative requires or is likely to cause the conversion of land to some level of protected status. There is no reason to assume any conversion of land to some level of protected status would be more likely to occur under one of the action alternatives than under the No Project/No Action Alternatives; thus the action alternatives relative to the bases of comparison would have less than significant impacts on the conversion of land to protected status. Draft EIR/EIS Page 16-10
11 : Changes in annual water deliveries and instream flow conditions that could result in potential impacts to local and regional planning objectives None of the scenarios evaluated has substantial conflicts with adopted environmental plans or goals of the local jurisdictions within the Yuba Region; consequently none of the scenario comparisons is anticipated to have conflicts with adopted environmental plans or goals and impacts to local and regional planning objectives will be less than significant for all of these comparisons ENVIRONMENTAL IMPACTS/ENVIRONMENTAL CONSEQUENCES OF THE CEQA YUBA ACCORD ALTERNATIVE COMPARED TO THE CEQA NO PROJECT ALTERNATIVE Impact : Agricultural impacts resulting from changes in water temperature Table 16-3 provides a comparison of average monthly water temperatures for the Yuba River at Daguerre Point Dam based on modeling of 71 years of hydrologic record. Although the temperature at Daguerre Point Dam (the point of diversion of agricultural irrigation water for most of the irrigation demands in the Yuba Region) is not a precise proxy for temperatures of irrigation water as delivered to the fields, the point of diversion is the last location where any of the alternatives under consideration potentially impact agricultural water temperatures. Table CEQA Yuba Accord Alternative Compared to the CEQA No Project Alternative, Summary Statistics of Long-term Average Water Temperatures ( F) Long-term Average Water Temperature, and Average Water Temperature by Water Year Type in the Yuba River at Daguerre Point Dam Under the CEQA Yuba Accord Alternative and CEQA No Project Alternative Conditions Apr May Jun Jul Full Simulation Period CEQA Yuba Accord Alternative CEQA No Project Alternative Difference Wet CEQA Yuba Accord Alternative CEQA No Project Alternative Difference Above Normal CEQA Yuba Accord Alternative CEQA No Project Alternative Difference Below Normal CEQA Yuba Accord Alternative CEQA No Project Alternative Difference Dry CEQA Yuba Accord Alternative CEQA No Project Alternative Difference Critical CEQA Yuba Accord Alternative CEQA No Project Alternative Difference Draft EIR/EIS Page 16-11
12 As can be seen from Table 16-3, the CEQA Yuba Accord Alternative would produce average monthly temperatures that would differ only slightly (less than 1 F) from those under the CEQA No Project Alternative, and most of the temperature shifts would be less than 0.5 F up or down. Because these temperature changes are estimated at the river, actual temperature shifts at the field should be of lower magnitude due to attenuation of differences during transport. Overall, the temperature changes are not expected to have a noticeable impact on agricultural production, and impacts on agricultural production resulting from changes in water temperature are not anticipated to unreasonably affect land use under the CEQA Yuba Accord Alternative, relative to the CEQA No Project Alternative ENVIRONMENTAL IMPACTS/ENVIRONMENTAL CONSEQUENCES OF THE CEQA MODIFIED FLOW ALTERNATIVE COMPARED TO THE CEQA NO PROJECT ALTERNATIVE Impact : Agricultural impacts resulting from changes in water temperature Table 16-4 provides a comparison of average monthly water temperatures for the Yuba River at Daguerre Point Dam based on modeling of 71 years of hydrologic record. Table CEQA Modified Flow Alternative Compared to the CEQA No Project Alternative, Summary Statistics of Long-term Average Water Temperatures ( F) Long-term Average Water Temperature, and Average Water Temperature by Water Year Type in the Yuba River at Daguerre Point Dam under CEQA Modified Flow Alternative and CEQA No Project Alternative Conditions Apr May Jun Jul Full Simulation Period CEQA Modified Flow Alternative CEQA No Project Alternative Difference Wet CEQA Modified Flow Alternative CEQA No Project Alternative Difference Above Normal CEQA Modified Flow Alternative CEQA No Project Alternative Difference Below Normal CEQA Modified Flow Alternative CEQA No Project Alternative Difference Dry CEQA Modified Flow Alternative CEQA No Project Alternative Difference Critical CEQA Modified Flow Alternative CEQA No Project Alternative Difference As can be seen from Table 16-4, the CEQA Modified Flow Alternative would produce average monthly temperatures that would differ only slightly (maximum 1.3 F) from those under the Draft EIR/EIS Page 16-12
13 CEQA No Project Alternative, and most of the temperature shifts would be less than 0.5 F up or down. Because these temperature changes are estimated at the river, actual temperature shifts at the field should be of lower magnitude due to attenuation of differences during transport. Overall, the temperature changes are not expected to have a noticeable impact on agricultural production, and impacts on agricultural production resulting from changes in water temperature are not anticipated to unreasonably affect land use under the CEQA Modified Flow Alternative, relative to the CEQA No Project Alternative ENVIRONMENTAL IMPACTS/ENVIRONMENTAL CONSEQUENCES OF THE CEQA YUBA ACCORD ALTERNATIVE COMPARED TO THE CEQA EXISTING CONDITION Impact : Agricultural impacts resulting from changes in water temperature Table 16-5 provides a comparison of average monthly water temperatures for the Yuba River at Daguerre Point Dam based on modeling of 71 years of hydrologic record. Table CEQA Yuba Accord Alternative Compared to the CEQA Existing Condition, Summary Statistics of Long-term Average Water Temperatures ( F) Long-term Average Water Temperature, and Average Water Temperature by Water Year Type in the Yuba River at Daguerre Point Dam under CEQA Yuba Accord Alternative and CEQA Existing Condition Apr May Jun Jul Full Simulation Period CEQA Yuba Accord Alternative CEQA Existing Condition Difference Wet CEQA Yuba Accord Alternative CEQA Existing Condition Difference Above Normal CEQA Yuba Accord Alternative CEQA Existing Condition Difference Below Normal CEQA Yuba Accord Alternative CEQA Existing Condition Difference Dry CEQA Yuba Accord Alternative CEQA Existing Condition Difference Critical CEQA Yuba Accord Alternative CEQA Existing Condition Difference As can be seen from Table 16-5, the CEQA Yuba Accord Alternative would produce average monthly temperatures that would differ only slightly (less than 1 F) from those under the CEQA Existing Condition, and most of the temperature shifts would be less than 0.5 F up or Draft EIR/EIS Page 16-13
14 down. Because these temperature changes are estimated at the river, actual temperature shifts at the field should be of lower magnitude due to attenuation during transport. Overall, the temperature changes are not expected to have a noticeable impact on agricultural production, and impacts on agricultural production resulting from changes in water temperature are anticipated to be less than significant for the CEQA Yuba Accord Alternative, relative to the CEQA Existing Condition ENVIRONMENTAL IMPACTS/ENVIRONMENTAL CONSEQUENCES OF THE CEQA MODIFIED FLOW ALTERNATIVE COMPARED TO THE CEQA EXISTING CONDITION Impact : Agricultural impacts resulting from changes in water temperature Table 16-6 provides a comparison of average monthly water temperatures for the Yuba River at Daguerre Point Dam based on modeling of 71 years of hydrologic record. Table CEQA Modified Flow Alternative Compared to the CEQA Existing Condition, Summary Statistics of Long-term Average Water Temperatures ( F) Long-term Average Water Temperature, and Average Water Temperature by Water Year Type in the Yuba River at Daguerre Point Dam under CEQA Modified Flow Alternative and CEQA Existing Condition Conditions Apr May Jun Jul Full Simulation Period CEQA Modified Flow Alternative CEQA Existing Condition Difference Wet CEQA Modified Flow Alternative CEQA Existing Condition Difference Above Normal CEQA Modified Flow Alternative CEQA Existing Condition Difference Below Normal CEQA Modified Flow Alternative CEQA Existing Condition Difference Dry CEQA Modified Flow Alternative CEQA Existing Condition Difference Critical CEQA Modified Flow Alternative CEQA Existing Condition Difference As can be seen from Table 16-6, the CEQA Modified Flow Alternative would produce average monthly temperatures that would differ only slightly (less than 1 F) from those under the CEQA Existing Condition, and most of the temperature shifts would be less than 0.5 F up or down. Because these temperature changes are estimated at the river, actual temperature shifts at the field should be of lower magnitude due to attenuation of differences during transport. Draft EIR/EIS Page 16-14
15 Overall, the temperature changes are not expected to have a noticeable impact on agricultural production, and impacts on agricultural production resulting from changes in water temperature are anticipated to be less than significant for the CEQA Modified Flow Alternative, relative to the CEQA Existing Condition ENVIRONMENTAL IMPACTS/ENVIRONMENTAL CONSEQUENCES OF THE CEQA NO PROJECT/NEPA NO ACTION ALTERNATIVE COMPARED TO THE CEQA EXISTING CONDITION/NEPA AFFECTED ENVIRONMENT As discussed in Chapter 3, the key elements and activities (e.g., implementation of the RD-1644 Long-term instream flow requirements) for the CEQA No Project Alternative would be the same for the NEPA No Action Alternative. The primary differences between the CEQA No Project and NEPA No Action alternatives are various hydrologic and other modeling assumptions (see Section 4.5 and Appendix D). Because of these differences between the No Project and No Action alternatives, these alternatives are distinguished as separate alternatives for CEQA and NEPA evaluation purposes. Based on current plans and consistent with available infrastructure and community services, the CEQA No Project Alternative in this EIR/EIS is based on current environmental conditions (e.g., project operations, water demands, and level of land development) plus potential future operational and environmental conditions (e.g., implementation of the RD-1644 Long-term instream flow requirements in the lower Yuba River) that probably would occur in the foreseeable future in the absence of the Proposed Project/Action or another action alternative. The NEPA No Action Alternative also is based on conditions without the proposed project, but uses a longer-term future timeframe that is not restricted by existing infrastructure or physical and regulatory environmental conditions. The differences between these modeling characterizations and assumptions for the CEQA No Project and the NEPA No Action alternatives, including the rationale for developing these two different scenarios for this EIR/EIS, are explained in Chapter 4 2. Although implementation of the RD-1644 Long-term instream flow requirements would occur under both the CEQA No Project and the NEPA No Action alternatives, the resultant model outputs for both scenarios are different because of variations in the way near-term and longterm future operations are characterized for other parameters in the CEQA and NEPA assumptions. As discussed in Chapter 4, the principal difference between the CEQA No Project Alternative and the NEPA No Action Alternative is that the NEPA No Action Alternative includes several potential future water projects in the Sacramento and San Joaquin valleys (e.g., CVP/SWP Intertie, FRWP, SDIP and a long-term EWA Program or a program equivalent to the EWA), while the CEQA No Project Alternative does not. Because many of the other assumed conditions for these two scenarios are similar, the longer-term analysis of the NEPA No Action Alternative compared to the NEPA Affected Environment builds upon the nearer-term analysis of the CEQA No Project Alternative compared to the CEQA Existing Condition. 2 For modeling purposes related to CEQA analytical requirements, OCAP Study 3 (2001 level of development) is used as the foundational study upon which the modeling scenarios for the CEQA No Project Alternative and the CEQA Existing Condition were developed. For modeling purposes related to NEPA analytical requirements, OCAP Study 5 (2020 level of development) is used as the foundational study upon which the modeling scenarios for the NEPA No Action Alternative was developed. Draft EIR/EIS Page 16-15
16 Because the same foundational modeling base (OCAP Study 3) was used to characterize nearterm conditions (2001 level of development) both the CEQA No Project Alternative and the CEQA Existing Condition, it was possible to conduct a detailed analysis to quantitatively evaluate the hydrologic changes in the Yuba Region and the CVP/SWP system that would be expected to occur under these conditions. Building on this CEQA analysis, the analysis of the NEPA No Action Alternative compared to the NEPA Affected Environment consists of two components: (1) an analysis of near-term future without project conditions quantified through the CEQA No Project Alternative, relative to the CEQA Existing Condition; and (2) a qualitative analysis of longer-term future without project conditions (the NEPA No Action Alternative) CEQA NO PROJECT ALTERNATIVE COMPARED TO THE CEQA EXISTING CONDITION Impact : Agricultural impacts resulting from changes in water temperature Table 16-7 provides a comparison of average monthly water temperatures for the Yuba River at Daguerre Point Dam based on modeling of 71 years of hydrologic record. Table CEQA No Project Alternative Compared to the CEQA Existing Condition, Summary Statistics of Long-term Average Water Temperatures ( F) Long-term Average Water Temperature, and Average Water Temperature by Water Year Type in the Yuba River at Daguerre Point Dam under CEQA No Project Alternative and CEQA Existing Condition Apr May Jun Jul Full Simulation Period CEQA No Project Alternative CEQA Existing Condition Difference Wet CEQA No Project Alternative CEQA Existing Condition Difference Above Normal CEQA No Project Alternative CEQA Existing Condition Difference Below Normal CEQA No Project Alternative CEQA Existing Condition Difference Dry CEQA No Project Alternative CEQA Existing Condition Difference Critical CEQA No Project Alternative CEQA Existing Condition Difference The second analytical component cannot be evaluated quantitatively due to the differences in the underlying baseline assumptions for OCAP Study 3 and OCAP Study 5. Draft EIR/EIS Page 16-16
17 As can be seen from Table 16-7, the CEQA No Project Alternative would produce average monthly temperatures that differ slightly (less than 2 F) from those under the CEQA Existing Condition, with temperature shifts of less than 1.0 F down and as much as 1.7 F up in some year classes. Because these temperature changes are estimated at the river, actual temperature shifts at the field should be of lower magnitude due to attenuation of differences during transport. Overall, the temperature changes are not expected to have a noticeable impact on agricultural production; especially considering that the larger temperature shifts are towards warmer temperatures that are more favorable to agriculture. As a result, impacts on agricultural production resulting from changes in water temperature are anticipated to be less than significant for the CEQA No Project Alternative, relative to the CEQA Existing Condition NEPA NO ACTION ALTERNATIVE COMPARED TO THE NEPA AFFECTED ENVIRONMENT In the Yuba Region, the primary difference between the NEPA No Action Alternative and the NEPA Affected Environment would be the changes in lower Yuba River flows associated with the implementation of the RD-1644 Long-term instream flow requirements, to replace the RD Interim instream flow requirements. These also are the primary differences that would occur in the Yuba Region between the CEQA No Project Alternative and the CEQA Existing Condition. The potential effects to land use that were evaluated in the quantitative analyses that is presented in Section above for the CEQA No Project Alternative relative to the CEQA Existing Condition (see also Appendix F4, 2 vs. 1) therefore also used for comparison of the NEPA No Action Alternative relative to the NEPA Affected Environment, and are not repeated here. As discussed above, the analysis of the NEPA No Action Alternative includes several additional proposed projects in the project study area that are not included in the CEQA analysis. However, these other proposed projects would not affect hydrologic conditions in the Yuba Region. The NEPA No Action Alternative considers 2020 level of development in the Sacramento Valley. In general, the types of change associated with a future level of demand that could affect land uses in Yuba County include increased agricultural land conversion. However, future land uses in Yuba County through 2013 are specified in the Yuba County General Plan. The General Plan is a comprehensive plan for growth and development in Yuba County and applies to all of the unincorporated area of the county outside of the cities of Marysville and Wheatland, which have their own general plans. The Yuba County General Plan states that on the valley floor, lands that are the least productive for agricultural purposes will be committed to development while higher value agricultural land (which includes along the Feather River, Bear River, and in Reclamation District 10) will be protected from encroachment and preserved for future generations of farmers (County of Yuba 1996). The Yuba County General Plan describes that, although agriculture will continue to play a significant role, overall agricultural land acreage will be reduced around Marysville, Linda, Olivehurst, Wheatland, and elsewhere. Yuba County previously evaluated potential environmental impacts associated with conversion of agricultural lands to other, urbanized uses in its General Plan EIR and determined that resource development in the county will be carried out in a manner sensitive to the environment and compatible with neighboring uses. Therefore, the NEPA No Action Alternative, relative to NEPA Affected Environment, is not anticipated to Draft EIR/EIS Page 16-17