WIND FLOW MODELING IN BUSINESS!!
|
|
|
- Jessie Lindsey
- 5 years ago
- Views:
Transcription

 Limited WindSim")
1 WIND FLOW MODELING IN BUSINESS!! Do more sophisticated models produce more accurate wind resource estimates???? Mytrah Energy (India) Limited WindSim User Meeting June 2014
2 As we ago along. MYTRAH : A short profile of the company Flow of a typical Energy Assessment Overlook of Uncertainty analysis ; Why it is important? Improving the quality of assessment & practices to reduce the uncertainty Case Study : Assessing the impacts of uncertainty Summary 2 WindSim User Meeting June 2014
 42 Oct'11 5 Mahidad (GJ) 25.2 Oct'11 6 Sinner (MH) 12.6 Sept'12 7 Vajrakarur (AP) 63 Dec'12 Total 309.9 New SPVs 8 Vagarai (TN) 100.5 9 Savalsung (KA) 100.3 10 Burgula (AP) 37.")
3 Mytrah Portfolio and Location Sl. No Site (State) Capacity (MW) COD FULLY OPERATIONAL 1 Chakla (MH) 39 Feb' Jamanwada (GJ) Kaladongar (RJ) 52.5 Aug Mar'12 4 Mokal (RJ) 42 Oct'11 5 Mahidad (GJ) 25.2 Oct'11 6 Sinner (MH) 12.6 Sept'12 7 Vajrakarur (AP) 63 Dec'12 Total New SPVs 8 Vagarai (TN) Savalsung (KA) Burgula (AP) 37.4 Partially operational Partially operational Fully Operational 3 WindSim User Meeting June 2014
4 Wind Resource in MYTRAH Wind monitoring, EYA, PMA, TDD, Forecasting etc., More than 150 wind monitoring campaigns are in operation in 7 states All the sophisticated software s in the market Data base and on-line monitoring In house tools and standard procedures Real time turbine operational data management and power curve guarantee test 200m wind mast installation and LIDAR a R&D project, 4 WindSim User Meeting June 2014
5 Wind Flow Modeling Linear Models Suitable for more simple flat terrains Moderate flat sites with moderate uncertainty Poorly predict flow separation in complex terrain Inaccuracy of prediction and uncertainty increases as the terrain complexity increases Limitations are more in complex terrain CFD Models Navier Stokes solvers are developed in the last decade through CFD codes Simulate turbulent atmospheric boundary layer flows over steep complex terrain Reduced uncertainty in complex terrain Wind variety of turbulence models to calculate local speed ups 5
6 Approach Input Concurrent wind data of 4 wind mast at 80m Surveyed contour and roughness map of same area for all flow models Flow Models Linear Models CFD Models Comparison Comparison of wind speed predicted error Uncertainty associated with P-values of different model 6 WindSim User Meeting June 2014


7 Test Site Mast-4 Mast-3 Mast-2 Mast-1 7 WindSim User Meeting June 2014

8 Mast Location Mast-4 Mast-3 Mast-2 Mast-1 8 WindSim User Meeting June 2014
9 Wind speed - comparison Results Reference: Mast-2 CFD-1 Linear Model CFD % 6.43% 6.00% 5.00% 5.30% 4.00% 3.00% 2.00% 1.00% 2.10% 1.93% 1.19% 1.43% 0.00% -1.00% -2.00% -0.30% Mast-3 Mast-4 Mast % -0.98% 9 WindSim User Meeting June 2014
10 Wind speed - comparison Results Reference: Mast % CFD-1 Linear Model CFD % 4.00% 3.30% 3.00% 2.00% 1.00% 0.77% 1.50% 1.56% 1.10% 1.93% 2.32% 0.00% -1.00% Mast-4 Mast-2 Mast % -2.00% 10 WindSim User Meeting June 2014
11 Wind speed - comparison Results Reference-Mast-3 CFD-1 Linear Model CFD % 1.00% 1.02% 0.00% -1.00% -0.96% 0.05% Mast-4 Mast-2 Mast % -1.55% -3.00% -2.53% -2.17% -2.22% -4.00% -3.75% -5.00% -4.70% 11 WindSim User Meeting June 2014
12 Wind speed - comparison Results Reference: Mast-4 CFD-1 Linear Model CFD % 5.50% 4.00% 3.36% 2.00% 1.80% 1.96% 1.50% 1.50% 1.20% 2.27% 0.00% -2.00% -4.00% -6.00% Mast-2 Mast-1 Mast % 12 WindSim User Meeting June 2014
13 Assessment & Uncertainty ; the certain things A number of uncertainties are always inherent in the analysis and effects of these are to be considered on the likelihood of achieving the central estimate energy yield prediction Degree of confidence of an energy estimate will fall with in a specified range ( essential for a sound financial model) Uncertainty assessment is important to minimize the financial risk associated with the project & to quantify the future annual energy production we need a metric. Depending upon the lender and the market experience different metrics are used to size the debt. P 50 ( Central estimate) - 50% chance of exceeding the estimate P 90-90% chance of exceeding the estimate Lenders are moving from P50 to P99!!! For the same P50 a WRA with higher uncertainty means a lower loan! No general rules or global standard values! 13
14 Uncertainty ; Main categories Wind Measurement ( Instrument accuracy, Interference of Mast, Data Quality ) Long term climate conditions ( Period of measured data, Availability and consistency of long term data, Correlation between met stations etc.) Future Wind Variability ( Climatic changes, inter annual wind speed variations etc.) Vertical Extrapolation ( Shear!) Flow modelling ( Quality of inputs, representativeness of the mast, model quality & error etc.) Plant Performance and Losses ( Availability assumptions, wake models etc.) 14

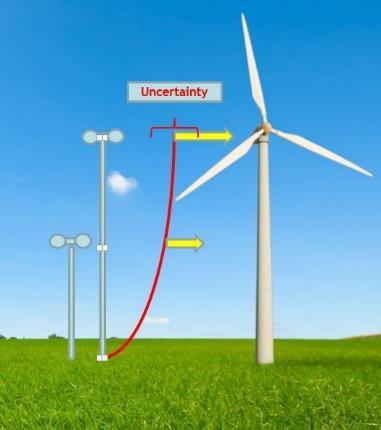


15 Certain uncertainties! 9 Mean wind speed [m/s]
16 Case Study Complex site of 100MW capacity HH mast installed at four locations across the site. IEC complaint, no data gap ; 1year measurement for all the 4 masts. Data cleaned for shadow sectors and erroneous values Advanced flow modelling tools were used along with conventional ones. 16
17 Scenario 1:Single Mast Vs Linear Model Vs 100MW Uncertainties (%) Historical wind speed variability Anemometry 2 Topographic model 6 Wake loss model 3 Correlation 0 Power curve 1.5 Vertical extrapolation 0 Map & direction 1 Loss factor assumption 3 P50 / P75 Ratio Mast-2 Mast-1 Mast-4 Mast-3 17
18 Scenario 2:Single Mast Vs CFD model Vs 100MW Uncertainties (%) Historical wind speed variability 6 Anemometry 2 Topographic model 2.5 Mast-4 Wake loss model 3 Correlation 0 Power curve 1.5 Vertical extrapolation 0 Mast-3 Map & direction 1 Loss factor assumption 3 Mast-2 Mast-1 P50 / P75 Ratio

19 Scenario 3:Multiple Masts Vs Linear Model Vs 100MW Uncertainties (%) Historical wind speed variability 6 Anemometry 2 Topographic model 4.5 Wake loss model 3 Correlation 0 Power curve 1.5 Vertical extrapolation 0 Map & direction 1 Loss factor assumption 3 P50 / P75 Ratio Mast-2 Mast-1 Mast-4 Mast-3 19

20 Scenario 4:Multiple Masts Vs CDF Model Vs 100MW Uncertainties (%) Historical wind speed variability 6 Anemometry 2 Topographic model 1.5 Mast-4 Wake loss model 3 Correlation 0 Power curve 1.5 Vertical extrapolation 0 Mast-3 Map & direction 1 Loss factor assumption 3 Mast-2 Mast-1 P50 / P75 Ratio


,mast anatomy, flow models and surveyed map will reduce uncertainty.")
21 Probability To conclude. A sound resource assessment & Uncertainty analysis is key for a sound financial model. CFD models are sophisticated and advanced with a better user interface; user capability matters. Time consuming & high computational capability required when compared to classical linear model Uncertainty in WRA will have an impact on the project financial model Better TI and shear understanding! Proper Location (s),mast anatomy, flow models and surveyed map will reduce uncertainty. Most of the investment in WRA will pay off later The numbers(p75,p90 & P99) really matters P99 P90 P75 P50 Energy Yield 21
22 Questions 22
23 Thank You Kiran Nair

24 24