Europe and Energy Security: The Coming Winter and Beyond
|
|
|
- Frederica Peters
- 5 years ago
- Views:
Transcription


1 Europe and Energy Security: The Coming Winter and Beyond Dr. Theresa Sabonis-Helf National War College October 2014 The opinions expressed in this brief are solely those of the author and do not represent the official position of the US Government, Dept of Defense, or National Defense University
2 Energy Security consists of: Reliability Affordability Environmental Friendliness According to the International Energy Agency
3 Primary Energy Regional Consumption Pattern 2013 Primary energy regional consumption pattern 2013 (Percentages) Percentage coal hydro nuclear Non-hydro renewables nat. gas oil BP Statistical Review of World Energy 2014 BP 2014


4
5 Natural Gas World Proven Reserves and Production 2013 *(excludes gas that is flared or reinjected) Country Reserves (TCM) Reserves (TCF) % of total 2013 world proven reserves % of total 2013 world production* Iran 33.8 tcm tcf 18.2% 4.9% Russia 31.3 tcm tcf 16.8% 17.9% Qatar 24.7tcm tcf 13.3% 4.7% Turkmenistan 17.5 tcm tcf 9.4% 1.8% USA 9.3 tcm 330 tcf 5% 20.6% Saudi Arabia 8.2 tcm tcf 4.4% 3.0% UAE 6.1 tcm tcf 3.3% 1.7% Nigeria 5.1 tcm tcf 2.7% 1.1% Algeria 4.5 tcm tcf 2.4% 2.3% Australia 3.7 tcm tcf 2.0% 1.3% ] Data from BP Statistical Review of World Energy June 2014, British Petroleum, tables on Natural Gas Proved Reserves (at end of 2013) and Natural Gas Production (at end of 2013) in trillion cubic meters and trillion cubic feet, page 20.

6 The European Gas Crisis Jan Russia-Ukraine disputes in Mar 2005, Jan 2006, Jan 2007 and late 2008 lead to brief, temp. gas reductions. 31 Dec. 2008: New Year s Eve negotiations between Ukraine and Russia over debt and gas price break down. Jan. 2009: Russia cuts back gas supply by Ukraine s share on three major pipelines. 12 countries left without power, 6 additional countries affected. Image and data from The Daily Mail, 8 January Jan 2009: Gas supply fully restored.
7 European Nation % Imported from Russia 2012 Total Volume Consumed 2012* Bulgaria 100% 2.5 BCM Estonia 100% N/A Finland 100% 2.7 BCM Latvia 100% N/A Lithuania 100% 3.0 BCM Sweden 100% 1.0 BCM Czech Rep. 80.5% 7.4 BCM Turkey 70.0% 40.7 BCM Slovakia 63.3% 4.4 BCM Slovenia 57.4% N/A Greece 54.8% 3.7 BCM Poland 54.2% 14.9 BCM Austria 52.2% 8.1 BCM Hungary 49.5% 9.2 BCM Belgium 43.2% 15.2 BCM Germany 39.9% 70.5 BCM European Dependence on Russian Natural Gas 2012 Total volumes from BP Statistical Review of World Energy June 2014, page 25. EU percentages imported from Russia, from Michael Ratner et al, p. 10, figure 2. States whose volumes are not represented are very small markets
8 European Dependence on Russian Natural Gas 2012 Gazprom exports to Europe in 2012 were 151 billion cum almost 1/3 of Gazprom s total production. By law, Gazprom sells 70% of its product inside Russia, reserving only 30% for international export. Total volumes from BP Statistical Review of World Energy June 2014, page 25. EU percentages imported from Russia, from Michael Ratner et al, p. 10, figure 2. States whose volumes are not represented are very small markets
9 For the Kremlin: Both are in trouble. Russia s energy power is visibly in decline. Oil is the more important economic commodity Russia produced 10.7 million bbls/day in 2013 No single oil company (although Transneft transports 88% of crude) Russia exports ¾ of its oil production Tax revenues from oil amount to $70/bbl. Natural Gas is the more important political commodity Russia produced BCM in 2013 More tightly controlled by the state Russia exports1/3 of gas production Russia is a gas transit state (30) LNG has a new legal category favoring Rosneft and Novatek Russia Total Oil Production : million bbl/day 2012: 10.4 million bbl/day Russia Natural Gas Production : 18,900 bcf 2012: 23,776 bcf

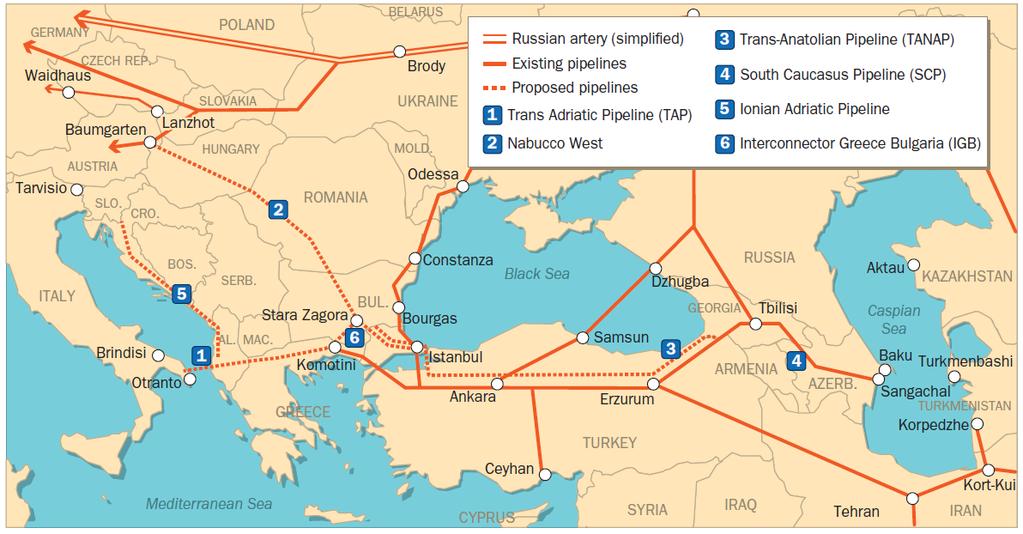
10 Russian-European Natural Gas Networks Russia exported 151 BCM of gas to Europe in 2012 Capacity of pipelines across Ukraine: 97 BCMA Capacity of pipelines across Belarus: 38 BCMA Capacity of Nordstream pipeline: 55 BCMA Total Russian export capacity: 190 BCMA Data from EIU October 2014, Map from Stratfor Oct 2014
11 European Dependence on Russian Natural Gas European Nation % Imported from Russia 2012 Total Volume Consumed 2012* Total Volume Consumed 2013 (% Change from 2012) Bulgaria 100% 2.5 BCM 2.4 BCM (-3.1%) Estonia 100% N/A N/A Finland 100% 2.7 BCM 2.6 BCM (-6.7%) Latvia 100% N/A N/A Lithuania 100% 3.0 BCM 2.4 BCM (-18.3%) Sweden 100% 1.0 BCM 1.0 BCM (-1.8%) Czech Republic 80.5% 7.4 BCM 7.6 BCM (+3.2%) Turkey 70.0% 40.7 BCM 41.1 BCM (+1.1%) Slovakia 63.3% 4.4 BCM 4.9 BCM (+11.5%) Slovenia 57.4% N/A N/A Greece 54.8% 3.7 BCM 3.2 BCM (-11.5%) Poland 54.2% 14.9 BCM 15.0 BCM (+1.1%) Austria 52.2% 8.1 BCM 7.6 BCM (-5.9%) Hungary 49.5% 9.2 BCM 7.7 BCM (-16.2%) Belgium 43.2% 15.2 BCM 15.1 BCM (-0.4%) Germany 39.9% 70.5 BCM 75.3 BCM (+7.0%) Total volumes from BP Statistical Review of World Energy June 2014, Consumption BCM table page 25. EU percentages imported from Russia, from Michael Ratner et al, p. 10, figure 2. Turkey percentages calculated by the author from BP data. States whose volumes are not represented are very small markets
12 Gas prices $/Mmbtu Gas Prices: ($ per million BTU) Germany Japan United States United Kingdom BP Statistical Review of World Energy 2014 BP 2014
13 Major Gas Trade Movements 2013 Major gas trade movements 2013 Trade flows worldwide (billion cubic metres) Trade flows worldwide (billion cubic metres) Total LNG (2008): BCM Total LNG (2010): BCM Total LNG (2012): BCM Total LNG (2013): BCM World Bank: Pipelines are more economical than LNG up to distances of 3500 km. In 2013, LNG accounted for 31.4% of world gas trade Source: Includes data from Cedigaz, CISStat, FGE MENAgas Service, IHS CERA, PIRA Energy Group. BP Statistical Review of World Energy 2014 BP 2014 BP Statistical Review of World Energy 2014 (Adapted)
14
15 Russia and Bulgaria signed a final investment decision in November 2012 on South Stream. All possible routes came through Bulgaria, the only geographically and politically suitable location for the pipe to return to land. Russia offered Sofia the steepest discount of any European state. Construction began on the Bulgarian section in Nov Data from Stratfor, 16 Nov 2012 and 16 Jan 2014; Image from Gazprom.com

16 South Stream is seen as a violation of the Third Energy Package: which insists on separating ownership of gas production from ownership of gas transit/distribution. Gazprom would own 50% of the line, except in Serbia where it would own 51%. Data from Stratfor, 16 Nov 2012 and 16 Jan 2014; Image from Gazprom.com
17 Balkan Dependence on Russian Natural Gas 2012/2013 European Nation % Imported from Russia Total Volume Consumed Total Volume Produced Storage Capacity Serbia 99%*** 2.89 BCM 0.56 BCM No storage capacity Bosnia & Herzegovina >90% 0.24 BCM No production No storage capacity Macedonia >90% No production No storage capacity Croatia none** BCM 0.6 BCM storage Slovak Republic* 92% BCM 2.7 BCM storage Bulgaria* 89%** BCM 0.3 BCM storage Greece* 62% No storage capacity Romania* 24%** BCM storage Turkey* 65% BCM storage Albania, Kosovo and Montenegro report no natural gas consumed. * Designates country for which 2013 data were used. Total volumes from BP Statistical Review of World Energy June 2014, Consumption BCM table page 25. EU percentages imported from Russia, calculated using BP Statistical Review of World Energy June 2014, Trade Movements tables page 28. Kosovo, Montenegro and Albania report no natural gas consumed. ** designates data from the Economist; ***designates data from the Energy Delta Institute
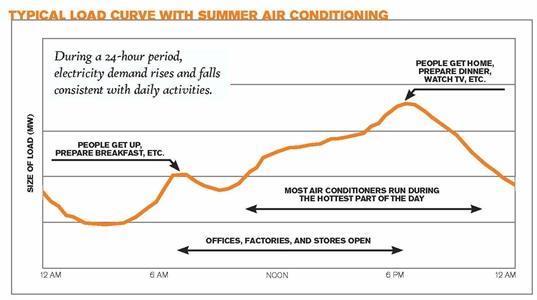
18 What to do about Winter? Bulgaria working towards interconnectors to Serbia and to a planned LNG terminal in Greece. Germany currently using only about 30 bcm of its 55 from Nordstream Ukraine still lacks meters at the points where pipelines enter from Russia. (Gas Facts) Even if EU mobilizes all available alternatives, there would still be a 30 BCM shortfall, making EU likely to help pay Ukraine s bill. Europe uses 31% of its gas to make electricity Data from The Economist, Conscious uncoupling, April 5, 2014
19 More Energy Facts for the EU Europe has some infrastructure for LNG: it imported 86.5 BCM in 2011, but only 45.7 BCM in 2013 of LNG but no new supply, Japan demand is up, and high price has led to rising coal demand. 1st US plant to export will be Sabine (TX-LA border), with a capacity of 2 BCMA, est. start 2015 Romania and Bulgaria sit on a shared shale gas basin. Romania has issued permits for fracking, Bulgaria has banned it. Lithuanian FLNG-4 BCMA terminal, Independence anchored at at Klaipeda 27 October 2014 (initial 0.5 BCMA). Capacity to export to the Baltics in place by end 2015, could supply 90% Baltic consumption (<5 BCMA). Data from The Economist, Conscious uncoupling, April 5, 2014 and Reuters, We can survive without Russian gas now, says Lith. President Oct 21, 2014
 *Bulgaria-Turkey interconnector (77 km, 3 BCMA) *Bulgaria-Greece interconnector (185 km, 3 BCMA) *Storage Expansion at Chiren")
20 Proposed: (*designates EU Key Projects 2013) Bulgaria-Romania interconnector (25 km, BCMA) *Bulgaria-Turkey interconnector (77 km, 3 BCMA) *Bulgaria-Greece interconnector (185 km, 3 BCMA) *Storage Expansion at Chiren up to 1 BCM Map from Gas Centre of the UNECE
21 Key Indicators (2012) Bulgaria Romania Population 7.31 million million Electricity 2550 Kwh 2600 Kwh consumption/capita GDP Billion USD Billion USD Energy/Electricity exports 2.25 GWh none Share of Total Primary Energy Supply 2012 Country Coal Oil Nat Gas Nuclear Hydro Biofuels/ Waste Bulgaria 36.3% 20.3% 12.9% 21.7% 1.5% 5.9% 1.5% Romania 21.7% 23.9% 30.9% 8.6% 3.0% 11.3% 0.7% Geotherm/ solar/ wind
22
 http://www.nationmaster.com/graph/ene_ele_con_percapenergy-electricity-consumption-per-capita 1.")
23 How much electricity do we use? Per Capita Annually Bulgaria: 2550 kwh per capita Global Average: 3,308.7 kwh per capita (weighted average) European Union 5, kwh per capita United States # 11-12, kwh per capita (2008) Billion people still lack access to a grid.
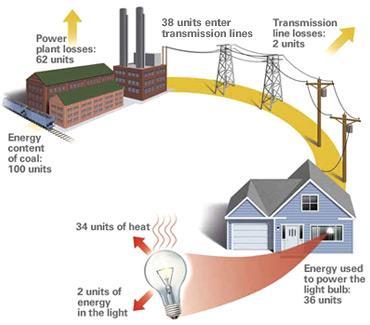
24 Typical Inefficiencies
25 Map from Gazprom, data from RT, 1 Sept 2014, image and data from Reuters, 21 May 2014 Power of Siberia (Russia-China) Gas Pipeline $500 Billion Natural Gas Deal signed May 21, 2014 Ground-breaking took place on September 2, ,968 km line ( world s largest fuel network ) will carry 38 BCMA to China.
 will carry 38 BCMA to China.")
 Gas delivery to begin 2019 Russia exported 162 BCMA to Europe (2013) Turkmenistan is contracted by")
26 Power of Siberia (Russia-China) Gas Pipeline $500 Billion Natural Gas Deal signed May 21, 2014 Ground-breaking took place on September 2, ,968 km line ( world s largest fuel network ) will carry 38 BCMA to China. Construction is to cost over $70 Billion Price? ($400 vs $360 per 1000 cum) Gas delivery to begin 2019 Russia exported 162 BCMA to Europe (2013) Turkmenistan is contracted by China for 65 BCMA by 2020 Map from Gazprom, data from RT, 1 Sept 2014, image and data from Reuters, 21 May 2014
27 What does man fear? The cold and the dark. We make it warm, we make it light - unnamed oilman in Kazakhstan interviewed by Seymour Hersch
28 Further Reading: (on energy) Daniel Yergin, The Quest, 2012 Brenda Shaffer & Taleh Ziyadov, Eds., Beyond the Resource Curse, 2012 (on energy in Eurasia) Jan H. Kalicki and David L. Goldwyn, Energy & Security: Second Edition, 2013 Thane Gustafson, Wheel of Fortune: 2012 Marshall Goldman, Petrostate, 2010 Steve LeVine, The Oil and the Glory, 2007 Adam Stulberg, Well-Oiled Diplomacy, 2008 (data sources) US Dept. of Energy, Energy Information Administration: International Energy Agency: BP Statistical Review of World Energy:

29 Russian Weakness? Or Russian Strength? Twin European Fears: Russia continues and intensifies the pattern of manipulation of energy supply for political reasons OR Russia continues to pursue incompetent policies at home that reduce its ability to supply European gas into the medium term future. The latter is the greater danger, exacerbated by European policies that seek (in part) to address the former danger.