Energy Efficiency Policies for the SEMED/Arab Region. Introduction to Policy Development Working Session. 16 April 2013
|
|
|
- Berenice Matthews
- 5 years ago
- Views:
Transcription

1 Energy Efficiency Policies for the SEMED/Arab Region Introduction to Policy Development Working Session 16 April 2013 Grayson Heffner and Sara Bryan Pasquier
2 Agenda The Big Picture The role of energy efficiency policies in overcoming barriers to energy efficiency Organization of the policy development sessions

3 Energy demand will continue to grow but the growth rate can be managed
4 Vehicles per thousand people Middle East and North African car ownership will double in 20 years PLDV ownership in selected markets in the New Policies Scenario United States European Union China India Middle East World Starting from a very low base, car ownership in non-oecd countries is set to grow considerably, driven by China. The extent of growth will determine future oil demand.
5 Energy intensity has worsened in Middle East and Africa regions United States European Union Japan Africa Middle East Latin America E. Europe/Eurasia China World toe per thousand dollars of GDP ($2011, MER) These regional trends are counter to the global trend
6 Middle East and North Africa account for about two-thirds of total fossil-fuel subsidies IEA World Energy Outlook 2011

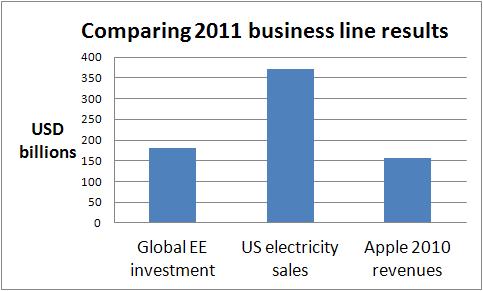
7 Global investment in energy efficiency Source: 2011 estimates, WEO 2012
8
9 Total Final Energy Consumption (TFC) across countries in SEMED (+1) region Tunisia 9% Morocco 16% Lebanon 5% Jordan 6% Egypt 64%
10 TFC by consuming sector - Egypt Non-specified (other) 2% 0% Agriculture/forestry 7% Non-energy use 14% Industry 26% Commerce and public services 3% Residential 22% Transport 26% 0%
11 TFC by consuming sector - Tunisia Agriculture/forestry 6% Commerce and public services 8% 0% 0% Non-energy use 3% Industry 28% Residential 27% Transport 28% 0%
12 TFC by consuming sector - Jordan Agriculture/forestry 4% Non-specified (other) 3% 0% Non-energy use 3% 0% Commerce and public services 8% Industry 22% Residential 22% Transport 38% 0%
13 TFC by consuming sector - Morocco Non-specified (other) 2% 0% Non-energy use 4% Agriculture/forestry 18% Industry 23% Commerce and public services 4% Transport 28% Residential 21% 0%
14 TFC by consuming sector - Lebanon Commerce and public services 6% 0% 0% Non-energy use 2% Nonspecified (other) 6% Industry 16% Residential 26% Transport 44% 0%
15 Barriers to improved energy efficiency Barrier Examples Market failures Energy price subsidies Agency problems, when benefits are split amongst several parties (e.g., renter-occupied housing), reducing the motivation to act Project size Financial Perceived risk Transaction costs Low capacity within the financial sector Lending terms (period, interest rate, collateral requirements) Information Lack of awareness Consumer indifference Regulatory and Energy tariffs that discourage EE investment institutional Institutional bias Competing Technical Lack of affordable or suitable EE technologies Measuring savings Capacity to identifying and implementing EE projects Project performance risk
16 IEA survey of energy efficiency barriers 70% 65% 60% 50% 40% 46% 46% 46% 38% 30% 20% 27% 23% 23% 23% 19% 19% 10% 0% End-user awareness, low energy prices, financing, and implementation capacity are commonly cited
17 IEA survey of energy efficiency barriers
18 Policies and interventions Information and education Advice and assistance Information and product labelling Capacity building Economic instruments Fiscal incentive Financial measures Market-based instruments Regulatory instruments Building codes & appliance standards Energy management requirements Energy savings obligations Technology development Enabling frameworks Legislation Funding Institutional arrangements Implementing agencies Public-private partnerships
19 Matching policies to barriers - examples Barrier Limited Information Perceived Risk Price or market distortion Technology and capacity shortfalls Transaction Costs Access to financing Policy Appliance labeling Awareness and education campaigns Public sector procurement Guarantee facilities Appliance standards Industry formation Creating EE delivery agencies Audit requirements Project preparation facilities Revolving funds Public-private partnerships
20 Enabling frameworks and institutional arrangements Frameworks & Arrangements Energy Efficiency Laws & Decrees National Energy Strategies and Plans Apex Agency for Energy Policy Egypt Jordan Kuwait Lebanon Morocco Tunisia EE Specialist Agency Results Monitoring Capacity Capacity Programs EE Regulations Financial Arrangements Academic & Research Capacity Industrial Associations Source: Tapping a Hidden Resource, World Bank 2009
21 Questions to consider when formulating energy efficiency policies Will it work? How much will it cost? Who will pay? How long will it take? Will there be unintended impacts or interference with other policies? Does the capacity exist to implement?
22 Policy Development Session
23 Form small groups organized by sector Industry Buildings Transport Cross-sectoral
24 Sequence of group discussion 1. Energy efficiency improvement opportunities Discuss and agree the major energy savings opportunities within the region Identify any major differences across countries 2. Barriers to scaling-up energy efficiency Discuss and agree the major barriers in your sector Identify any major differences across countries 3. Consider the policy recommendations put forward by the IEA and WEC and others Which of these are being implemented or considered? Any others that might be appropriate to the region? Which are not appropriate to the region? Why? Identify any major differences across countries
25 Sequence of group discussion (con.) 4. Develop additional, regional potential policies Discuss additional policies especially applicable to the SEMED/Arab region or your country Identify any major differences across countries 5. Rank-order the potential policies Work as a group to select the most important and less important potential policies Were there major differences across countries? 6. Prepare to report-out your results Work with your assigned rapporteur Your presentation should cover each step of your work process, policy recommendations, and major differences across countries

26 Group Discussion Resources Source: Tapping a Hidden Resource, World Bank 2009
27 Consuming Sector Insights Manufacturing: 13 percent of regional GDP and 17 percent of exports. Most energy-intensive manufacturing industries are cement, steel, fertilizers, and glass, consuming 25 percent of the energy and contributing a significant share of GDP Buildings: Buildings are estimated to be responsible today for at least 40 percent of energy use in the region Transport: No region of the world has a transport sector that is more energy intensive. Measures to bring down energy intensity in the transport sector could include fuel price increases, demand management, greater investment in public transport, measures to improve vehicle fuel economy, and integrated transport and urban planning. Agriculture: Nearly half (45.7 percent) of the region s cultivated areas are irrigated, a fact that has huge implications for energy consumption and water-resource management. Source: Tapping a Hidden Resource, World Bank 2009
28 Transport energy savings opportunities Sector Passenger vehicles Motorcycles and scooters Trucks and inland freight Air and maritime Public transportation Rail Efficiency measure Barriers Policy recommendation Rank Three transportation efficiency modalities - avoid/reduce, shift, and improve
29 Buildings and tertiary energy savings opportunities Sector Efficiency Measure Barriers Policy recommendations Rank Street lighting Office lighting Heating, ventilation and air conditioning Commercial refrigeration, freezing, cooking Small and medium motors Office equipment and servers
30 Industry energy savings opportunities Sector Efficiency Measure Barriers Policy recommendations Rank Energy intensive 1 Electric motors and drives Process heat Non-energy intensive 2 SMEs 1 cement, glass, paper, steel, petro-chemicals, desalination 2 Food processing, services, textiles, other
31 Appliances and lighting (Households) energy savings opportunities Sector Efficiency Measure Barriers Policy recommendations Rank Residential white goods Residential air conditioners TV and electronics Hot water heaters Heating Household Lighting
32 Agricultural and water supply energy savings opportunities Sector Efficiency Measure Barriers Policy Recommendation Rank Irrigation Desalination