WELCOME! Four Corners and Upper Rio Grande Vulnerability Assessment Webinar Series
|
|
|
- Brent Magnus Benson
- 5 years ago
- Views:
Transcription


1 WELCOME! Four Corners and Upper Rio Grande Vulnerability Assessment Webinar Series Phone audio: Dial: ; Passcode: # Mute your phone and turn off computer speakers (prevents echo issue). Introduce yourself in the chat box. Webinar recordings will be posted on the Southern Rockies LCC website. Native Fish & Riparian Mule Deer & Elk Sagebrush Ecosystems Pinyon-Juniper Ecosystems


2 United States Department of Agriculture Webinar 2: Results of a Vulnerability Assessment for Elk and Mule Deer in the Four Corners and Upper Rio Grande Landscapes Megan Friggens, Rocky Mountain Research Station Tzeidle Wasserman, Ecological Restoration Institute

3 Agenda Introduction to Four Corner and Upper Rio Grande Assessments 5 minutes Methods 15 minutes Focal Resource Results 30 minutes Takeaways 5 minutes Q&A 10 minutes

4 Goals for This Webinar Provide overview of assessment results Identify additional datasets/needs Incorporate feedback from today s discussion in preparation for upcoming Adaptation Forums


5 The SRLCC has engaged an adaptive management framework to collaboratively develop shared conservation objectives and landscape scale adaptation strategies Identified Focal Resources and Landscapes Partnered with RMRS to create Vulnerability Assessments for Focal Resources in Two Landscape Spring 2016 Adaptation Forums Fall 2017 Adaptation Forums

6 Focal Resources in 2 Landscapes 1. Streamflow/ Native Fish/ Riparian Corridors 2. Mule Deer & Elk 3. Pinyon-Juniper Woodlands 4. Sage-Steppe Habitat

7 Methods

8 Framework for Landscape Level Vulnerability Assessment of Focal Resources
9 Steps to Quantify Vulnerability 1. Gather data Assess Relevance Assign to Element 2. Create indices 3. Combine E, S, and AC indices to estimate Vulnerability Exposure Impact Sensitivity Vulnerability Adaptive Capacity


10 Step 1. Gather Data Criteria: Spatially explicit Available across focal landscape Meaningful Measurable uncertainty Tried to find datasets used and or produced by LCC stakeholders
11 Challenges with combining existing data Resolution and scale of datasets differ and may not match management needs Uncertainties and assumptions of underlying datasets Uncertainties related to climate projections Linguistic Spatial Scale & Resolution Knowledge Gaps Uncertainties Temporal variation Future trends Method Bias
12 Step 2: Indices Pros Easy to interpret Easy to manipulate on the fly Are able to identify relative differences and more complicated interactions Cons May be biased and/or misleading Not considering differential impacts Assumes equal certainty and quality of underlying data
13 From Data to Vulnerability Rank 3. Combine Scaled Impact and Adaptive Capacity Scores Departure T Road density 1. Score each Unit based on original data values Increase=1 Density = top 25 prcnt=1 2. Sum S + E Scores Sensitivity Score Exposure Score Adaptive Capacity Score Potential Impact Vulnerability 1 Very Low 2 Low 3 Moderate 4 High 5 Very High Data Convert (0 1) Add Overlay Map
 Value 1")

14 Step 3. Visualize Vulnerability Vulnerability Impact (E+S) Value Adaptive Capacity Vulnerability Lowest Very Low Low Moderate High Very High

15 Highlight Opportunities Opportunity Adaptive Capacity Impact Opportunity Lowest Intermediate Highest
16 Assessment Results


17 Elk & Mule Deer: Background Widely distributed across focal area Diverse habitat types within SRLCC Mostly habitat generalists Wide range of habitats occupied (elevational gradient) Winter and Summer Range important Seasonal migration Sensitive to: - development (esp. on winter range) - changes in forage quality and availability - habitat fragmentation
18 Mule Deer (Odocoileus hemionus) Widely distributed across West (AK to MX) Diet composed mostly of shrubs Early seral habitat important Need thermal cover Population fluctuations 1860 s: Settlement of West & Livestock grazing = overgrazing, changed forage, decreased pops Fire and wet years produces high quality forage = pop s rebounded by 1950 s = competition of resources & lower carrying capacity on landscape Factors impacting pops: - fire suppression = habitat changes - Gas, oil, mineral exploration fragmented habitat - Urbanization impacts - Drought impacts

19 Elk (Cervus elaphus) Forage on grasses and forbs Larger body size, dietary range =Competitive advantage Occupy an elevational range of habitats Can withstand deeper snow Fire suppression has changed habitat availability Prefer a mosaic of mid to late seral conditions interspersed with openings Need thermal cover
20 Data used 1. Development & Infrastructure 2. Change in Development 3. Decrease in winter precipitation 4. Soil/Vegetation vulnerability (Effects of drought) 1. Roads 2. Urbanization/ Impervious Surface 3. Vegetation Cover (%) 4. Summer Range (area) 5. Winter Range (area) 1. Winter Precipitation 2. Water Availability 3. Vegetation & Thermal Cover 4. Pinyon-Juniper Woodlands habitat

21 Unit if Analysis Watershed HUC 12

22 Relevant data not included in analysis

23 Data: Exposure


24 Exposure Indicators: Individual data Binary Map 0-1 for each variable original
25 Cumulative Exposure Development + Imperviousness + Winter precip + Soil Vulnerability


26 Cumulative Exposure Index FC URG Four Corners Upper Rio Grande 24 % High 13 % High 45 % Moderate 25 % Moderate 31 % Low 44 % Low

27 Data: Sensitivity

28 Data from University of Utah & NASA DEVELOP Project Mule Deer Summer Range Mule Deer Winter Range

29 Cumulative Sensitivity Road density + Urbanized + Veg Cover +Summer Range + Winter Range


30 Cumulative Sensitivity Index FC URG

31 Data: Adaptive Capacity

32 Cumulative Adaptive Capacity Winter Precip + Water Source + Thermal Cover +PJ Woodlands


33 Cumulative Adaptive Capacity Index FC URG


34 Estimate Vulnerability Impact = Exposure + Sensitivity Adaptive Capacity + Impact


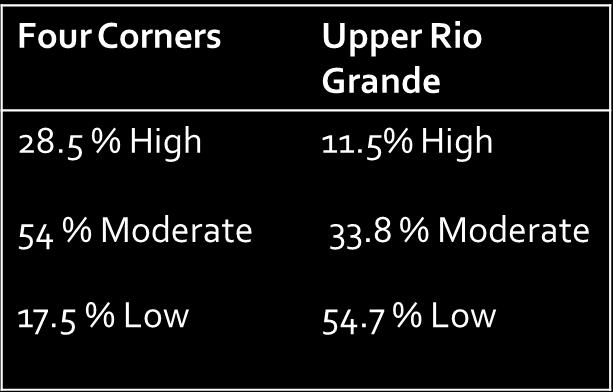
35 Vulnerability FC URG Exposure + Sensitivity/Adaptive Capacity Summary stats

36 Summary URG had many watersheds with low vulnerability (55%) FC: many watersheds with moderate vulnerability (54%) Winter and Summer range are limiting in both FC and URG -No data on tribal lands included Mixture of habitat types and elevational ranges in URG URG: More high elevation habitat, more riparian habitat FC: More PJ Habitat throughout landscape URG: Higher Adaptive Capacity FC: Low Adaptive Capacity URG: Low Exposure (44%), Low Sensitivity (61%), twice as much Adaptive Capacity as FC, Low Vulnerability (55%) FC: Moderate Exposure (45%), Low Adaptive Capacity (78%), watersheds with Moderate Vulnerability (54%)
37 Takeaways Creating Products to: Estimate Exposure, Sensitivity, and Adaptive Capacity of Focal Resources Assess Vulnerability and Opportunity Identify critical areas of interest, importance, or priority Appropriate Uses: Output cannot support local scale management decisions or conclusions Output can distinguish relative vulnerabilities across landscapes and identify or prioritize: Areas for additional, fine scale study High action needs (e.g. critical threats or sensitivities) Common areas of interest
38 Adaptation Forums Using assessments to identify management priorities How do the results of these assessments match with where you are already working and your current priorities? How do we use this information to move forward to develop collaborative actions and implement LCD?

39 Thank You!