Infrastructure Framework
|
|
|
- Claude Greer
- 5 years ago
- Views:
Transcription
1
2 Infrastructure Framework Infrastructure Impediment = Inefficiencies = Less Effective Transport Capacity = Higher Freight Rates = Lower Producer Returns = Lower Returns and Competitiveness = 2

3 Global Population Density -- Asia and India 3

4 Global Population Growth, 2004 to

5 Global Population Shift Becoming More Urbanized 5
6 Jan-83 Jan-84 Jan-85 Jan-86 Jan-87 Jan-88 Jan-89 Jan-90 Jan-91 Jan-92 Jan-93 Jan-94 Jan-95 Jan-96 Jan-97 Jan-98 Jan-99 Jan-00 Jan-01 Jan-02 Jan-03 Jan-04 Jan-05 Jan-06 Jan-07 Jan-08 Jan-09 Jan-10 Jan-11 Jan-12 Jan-13 Jan-14 Jan-15 Jan-16 Miles Driven (billon miles) Year-Over-Year % Change Record Miles being Driven, but Pace is Slowing at a Diminishing Rate 3,500 Annualized Miles Driven by Month Miles Driven % Change 6% 3,300 5% 3,100 4% 2,900 3% 2,700 2% 2,500 1% 2,300 0% 2,100-1% 1,900-2% 1,700-3% 1,500-4% 6
7 Jan-90 Jul-90 Jan-91 Jul-91 Jan-92 Jul-92 Jan-93 Jul-93 Jan-94 Jul-94 Jan-95 Jul-95 Jan-96 Jul-96 Jan-97 Jul-97 Jan-98 Jul-98 Jan-99 Jul-99 Jan-00 Jul-00 Jan-01 Jul-01 Jan-02 Jul-02 Jan-03 Jul-03 Jan-04 Jul-04 Jan-05 Jul-05 Jan-06 Jul-06 Jan-07 Jul-07 Jan-08 Jul-08 Jan-09 Jul-09 Jan-10 Jul-10 Jan-11 Jul-11 Jan-12 Jul-12 Jan-13 Jul-13 Jan-14 Jul-14 Jan-15 Jul-15 Jan-16 Jul =100 Freight Movements Rebounded with Strength, but Easing Lower 130 Freight Transportation Services Index Month 7
8 2-Jan 9-Jan 16-Jan 23-Jan 30-Jan 6-Feb 13-Feb 20-Feb 27-Feb 5-Mar 12-Mar 19-Mar 26-Mar 2-Apr 9-Apr 16-Apr 23-Apr 30-Apr 7-May 14-May 21-May 28-May 4-Jun 11-Jun 18-Jun 25-Jun 2-Jul 9-Jul 16-Jul 23-Jul 30-Jul 6-Aug 13-Aug 20-Aug 27-Aug 3-Sep 10-Sep 17-Sep 24-Sep 1-Oct 8-Oct 15-Oct 22-Oct 29-Oct 5-Nov 12-Nov 19-Nov 26-Nov 3-Dec 10-Dec 17-Dec 24-Dec Carloadings Rail Carloadings Sub-Par Energy and Economy, but Grain Supports 610,000 U.S. Class I Carloadings Including Intermodal 3-Yr. Ave , , , , ,000 Source: American Association of Railroads Week 8
9 2-Jan 9-Jan 16-Jan 23-Jan 30-Jan 6-Feb 13-Feb 20-Feb 27-Feb 6-Mar 13-Mar 20-Mar 27-Mar 3-Apr 10-Apr 17-Apr 24-Apr 1-May 8-May 15-May 22-May 29-May 5-Jun 12-Jun 19-Jun 26-Jun 3-Jul 10-Jul 17-Jul 24-Jul 31-Jul 7-Aug 14-Aug 21-Aug 28-Aug 4-Sep 11-Sep 18-Sep 25-Sep 2-Oct 9-Oct 16-Oct 23-Oct 30-Oct 6-Nov 13-Nov 20-Nov 27-Nov 4-Dec 11-Dec 18-Dec 25-Dec Miles Per Hour Rail Performance Solid, Despite Recent Slowing U.S. Weekly Average Train Speed 27 3-Yr. Ave Source: American Association of Railroads Week Ending 9


10 Inland Barge Fleet Expanded in 2015 for Covered and Tank 10
11 Million Tons Grain Barge Loadings by River Segment Lower River Areas Making Strides, Upper River Rebounding 80 Total Grain and Soybean Barge Loadings by River Segment Upper Mississippi River (MSP to Missouri River) Illinois Waterway Mid-Mississippi River (Missouri River to Ohio River) Ohio River Lower Mississippi River (Ohio River to Baton Rouge) McClellan-Kerr Arkansas River Baton Rouge to New Orleans New Orleans to Mouth of Passes 0 Year 11
12 Million Tons Inland River Barge Commodity Profiles Open Suffering from Coal 700 Domestic Barge Traffic Tons Covered Open Tank Year 12
13 Inland River Barge Commodities 2014 Volume Barged Totaled 592 million tons Primary Metal Prod. 3% Metallic Ores 1% Soil, Sand, Rock & Stone 11% Chemical Prod. 6% Coal 30% Flour, Animal Feed & Gr. Prod. 1% Farm Prod. 12% Crude Petroleum 7% Other & Misc. 1% Nonmetallic Minerals, Except Fuel 3% Stone, Clay, Glass & Concrete Prod. 2% Petroleum & Coal Prod. 20% Chemicals & Allied Prod. 3% Lumber, Wood, Pulp & Allied Prod. 0% 13
14 Inland River Covered Barge Commodities 2014 Volume Barged Totaled 152 million tons Stone, Clay, Glass & Concrete Prod. 7% Soil, Sand, Rock & Stone 0% Other & Misc. 2% Chemicals & Allied Prod. 12% Lumber, Wood, Pulp & Allied Prod. 0% Nonmetallic Minerals, Except Fuel 7% Farm Prod. 53% Primary Metal Prod. 8% Metallic Ores 6% Flour, Animal Feed & Gr. Prod. 5% 14
15 Inland River Open Barge Commodities 2014 Volume Barged Totaled 250 million tons Other & Misc. 1% Primary Metal Prod. 2% Soil, Sand, Rock & Stone 24% Chemicals & Allied Prod. 0% Petroleum & Products 3% Lumber, Wood, Pulp & Allied Prod. 1% Nonmetallic Minerals, Except Fuels 3% Coal 66% 15
16 Inland River Tank Barge Commodities 2014 Volume Barged Totaled 190 million tons Crude Petroleum 21% Food & Farm Prod. 1% Petroleum & Coal Prod. 59% Chemical Prod. 19% 16
17 Index (1998 = 100) Covered Barge Fleet Under Less Pressure with Larger Fleet Covered Barge Utilization 120 Tonnage Covered Barge Informa's Covered BPI Year 17
18 Index (1998 = 100) Barge Open Fleet more than Adequate, Looking for Something to Transport 120 Open Barge Utilization Tonnage Open Barge Informa's Barge Pressure Index Year 18
19 Index (1998 = 100) Barge Tank Fleet Adequate, but Varies by Equipment Type 140 Tank Barge Utilization Tonnage Tank Barge Informa's Barge Pressure Index Year 19

20 U.S. Shallow Draft Towboat Fleet Expansion, but This will Slow 20


21 U.S. Shallow Draft Towboats Increasing Power with 1,800 to 3,699 Horsepower Energy Play 21
22 1-Sep 8-Sep 15-Sep 22-Sep 29-Sep 6-Oct 13-Oct 20-Oct 27-Oct 3-Nov 10-Nov 17-Nov 24-Nov 1-Dec 8-Dec 15-Dec 22-Dec 29-Dec 5-Jan 12-Jan 19-Jan 26-Jan 2-Feb 9-Feb 16-Feb 23-Feb 1-Mar 8-Mar 15-Mar 22-Mar 29-Mar 5-Apr 12-Apr 19-Apr 26-Apr 3-May 10-May 17-May 24-May 31-May 7-Jun 14-Jun 21-Jun 28-Jun 5-Jul 12-Jul 19-Jul 26-Jul 2-Aug 9-Aug 16-Aug 23-Aug Percent of Tariff Barge Freight Rates Unmoved by Record Grain Export Program 1,200 Illinois River Barge Freight Rate (percent of tariff) by Crop Year (Sep/Aug) Yr. Ave. 1, Week 22

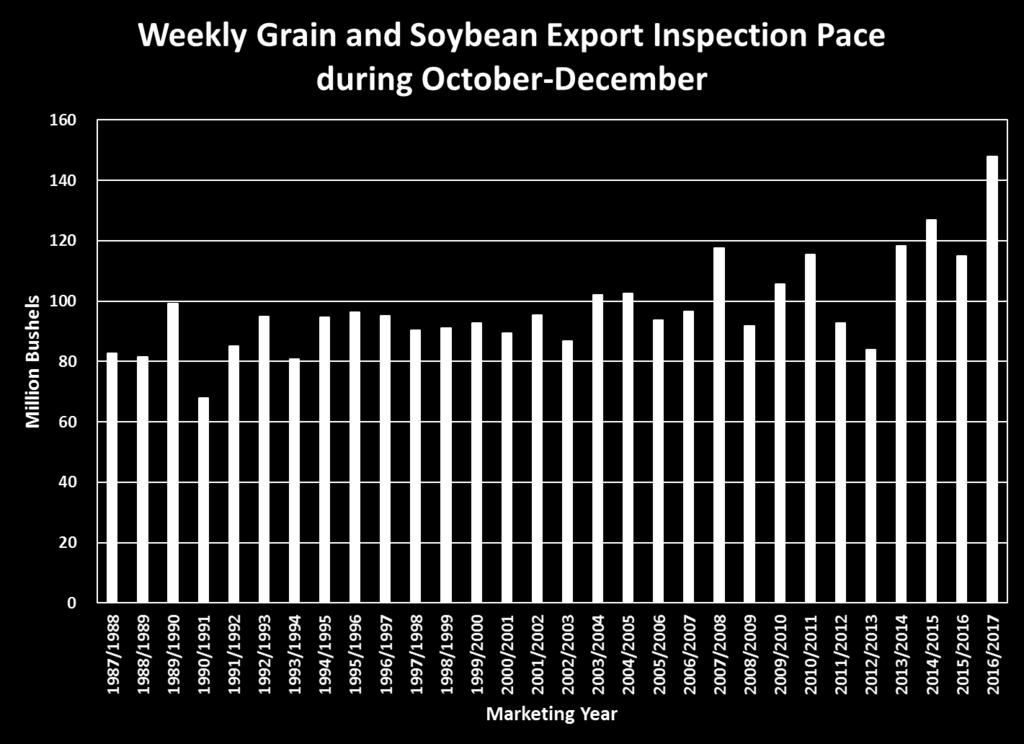
23 Fast and Furious Fall (October-December) Grain Export Program 23
24 1986/ / / / / / / / / / / / / / / / / / / / / / / / / / / / / / /17 Million Bushels Million Bushels Exports by Port High Volumes and Utilization Total Grain and Soybean Exports by Port Center Gulf Columbia River Puget Sound Texas Gulf Lakes Atlantic Interior Total 3,000 6,000 2,500 5,000 2,000 4,000 1,500 3,000 1,000 2, , Crop Year (Sep/Aug) 24
25 Jan-00 Jul-00 Jan-01 Jul-01 Jan-02 Jul-02 Jan-03 Jul-03 Jan-04 Jul-04 Jan-05 Jul-05 Jan-06 Jul-06 Jan-07 Jul-07 Jan-08 Jul-08 Jan-09 Jul-09 Jan-10 Jul-10 Jan-11 Jul-11 Jan-12 Jul-12 Jan-13 Jul-13 Jan-14 Jul-14 Jan-15 Jul-15 Jan-16 Jul-16 Index Dry Bulk Ocean Freight Rate Bottom Dwelling 18,000 Monthly Average Baltic Indices Charts BDI BCI BPI 16,000 14,000 12,000 10,000 8,000 6,000 4,000 2,000 0 Month and Year 25
26 Twenty Foot Equivalents (TEUs) Container Vessels Getting Larger, Companies Sinking Generational Development of Container Vessels 25,000 25,000 24,000 20,000 18,000 19,000 20,000 20,000 15,000 14,000 15,000 13,000 10,000 10,000 5,000 5, s 1980s 1990s 2000s 2005s ?? I II III IV V VI VII VIII IX Year and Generation 0 26
27 Apr-07 Jun-07 Aug-07 Oct-07 Dec-07 Feb-08 Apr-08 Jun-08 Aug-08 Oct-08 Dec-08 Feb-09 Apr-09 Jun-09 Aug-09 Oct-09 Dec-09 Feb-10 Apr-10 Jun-10 Aug-10 Oct-10 Dec-10 Feb-11 Apr-11 Jun-11 Aug-11 Oct-11 Dec-11 Feb-12 Apr-12 Jun-12 Aug-12 Oct-12 Dec-12 Feb-13 Apr-13 Jun-13 Aug-13 Oct-13 Dec-13 Feb-14 Apr-14 Jun-14 Aug-14 Oct-14 Dec-14 Feb-15 Apr-15 Jun-15 Aug-15 Oct-15 Dec-15 Feb-16 Apr-16 Jun-16 Aug-16 Dollars per Metric Ton Implied Container Rates for Export Moves in Doldrums 160 Implied Container Freight Rates from Kansas City to Taiwan Date 27
28 Ocean Freight Rate ($ per Metric Ton) Panama Canal & Vessel Loadings Potential Opportunities Volumes Speak Volumes... Compare to base vessel loaded to 39.5 foot draft, about 56,700 metric tons cargo New locks will accommodate 50 foot draft and upwards of 97,000 dwt vessel. Sensitivity on higher loadings for deeper draft, adjusting for loading and unloading time, and higher fuel burn. Overall, toll structure not key determinant as much as heavier loadings. $40 $35 $30 $25 $20 $15 $10 $5 Panama Canal Toll Scenario Impacts on Ocean Freight Rates to Japan $34.02 $25.19 $28.02 $27.59 $33.09 $19.12 $ metric tons Center Gulf Base Rate DWT and metric tons DWT and metric tons Cape Good Hope DWT and metric tons Vessel and Cargo Size Cape Good Hope DWT and metric tons metric tons PNW Base Rate 28


29 Panama Canal Market Potential for Dry Bulk Movements February 24, 2016 Cocoli Locks 29
30 Jan-90 Jul-90 Jan-91 Jul-91 Jan-92 Jul-92 Jan-93 Jul-93 Jan-94 Jul-94 Jan-95 Jul-95 Jan-96 Jul-96 Jan-97 Jul-97 Jan-98 Jul-98 Jan-99 Jul-99 Jan-00 Jul-00 Jan-01 Jul-01 Jan-02 Jul-02 Jan-03 Jul-03 Jan-04 Jul-04 Jan-05 Jul-05 Jan-06 Jul-06 Jan-07 Jul-07 Jan-08 Jul-08 Jan-09 Jul-09 Jan-10 Jul-10 Jan-11 Jul-11 Jan-12 Jul-12 Jan-13 Jul-13 Jan-14 Jul-14 Jan-15 Metric Tons Why Infrastructure Matters: The Case of the Columbia River Volumes Speak Volumes... Columbia River dredged three to 43 feet, completed during 2011 Evaluation of loadings greater than 55,000 metric tons Loading have stair stepped higher each year from about 60,000 metric tons to nearly 64,000 metric tons New export capacity, monoloadings of grain and soybeans and dedicated market help sustain higher loadings 68,000 66,000 64,000 62,000 60,000 58,000 56,000 54,000 52,000 Columbia River Grain and Soybean Loadings per Vessel 50,000 Month 30
31 Recall the Infrastructure Framework, in Reverse Infrastructure Improvements = Efficiencies = Greater Effective Transport Capacity = Lower Freight Rates = Higher Producer Returns = Higher Returns and Competitiveness = 31
32 Questions?
33 Informa Economics IEG 775 Ridge Lake Blvd Suite 400 Memphis, TN T E W or