Models for Adapting to Climate Change Impacts in Cities. New Partners for Smart Growth Annual Conference Thursday, February 4, 2010
|
|
|
- Elvin Leonard
- 5 years ago
- Views:
Transcription


1 Models for Adapting to Climate Change Impacts in Cities New Partners for Smart Growth Annual Conference Thursday, February 4, 2010


2 Global Climate Change in Chicago Unprecedented challenge Unprecedented opportunity We are having an impact. Copyright 2009, City of Chicago

3 Chicago Climate Action Plan Implementation Commenced Reducing Emissions & Adapting Grounded in Research Copyright 2009, City of Chicago

4 Funding Sources Chicago Community Trust Clinton Foundation, Clinton Climate Initiative Grand Victoria Foundation Illinois Department of Commerce and Economic Opportunity Joyce Foundation Kresge Foundation Legacy Fund Lloyd A. Fry Foundation Nathan Cummings Foundation Surdna Foundation Copyright 2009, City of Chicago
5 Federal Stimulus Funds Energy Efficiency and Conservation Block Grant: $ 27,649,000 LED Traffic Signal Conversions $ 7,300,000 Streetlighting Energy Efficiency Upgrades $ 6,500,000 City Facility Parking Lot Lighting Conversion to LED $ 750,000 Residential Energy Efficiency Programs $ 5,099,000 City Facility Energy Upgrades $ 8,000,000 Chicago Area Alternative Fuels Deployment Project $ 14,999,650 Clean Diesel $ 1,337,500 CREATE $300,000,000 Deconstruction $ 8,000,000 Community Green Jobs $ 1,800,000 Green Job Work Experience & Job Training Program $ 5,625,000 Climate Communities $ 600,000 Urban & Community Forest Program $ 1,077,000 Plug-In Infrastructure $ 1,500,000 Copyright 2009, City of Chicago

6 Research Teams University of Illinois Don Wuebbles & Kathryn Hayhoe Center for Neighborhood Technology Jen McGraw, Peter Haas, Anne Evans, & Linda Young Oliver Wyman John Rogula & Craig Faris MWH Global Rik Lewis & Mark Wagstaff Regional Economics Applications Laboratory Greg Hewings Copyright 2008, City of Chicago

7 Implementation Strategy Consultants Adrian Smith and Gordon Gill Architecture A.T. Kearney Bain Boston Consulting Group Environmental Law and Policy Center The Field Museum Global Philanthropy Partnership Katzenbach/Booz Copyright 2009, City of Chicago
8 The Cool 15 Accomplishments January 2008 August 2009 Retrofitted 13,500 Dwelling Units and 252 Commercial & Industrial Buildings for Energy Efficiency Traded 3,800 Refrigerators and Air Conditioners for Energy Efficient Appliances Permitted 200 Buildings to New Chicago Energy Code Since April 2009 Required 1,200,000 sq. ft. of Green Roof Space Through Planned Developments Installed More Than Sixty Green Alleys and Green Streets Conserved Twenty Million Gallons of Water per Day Increased Chicago Transit Authority Ridership by 5% Added 636 New Car Share Vehicles to the Chicago Area Added 208 new hybrid buses to the Chicago Transit Authority fleet Sold 383,125 Gallons of Alternative Vehicle Fuel Decreased Single Family Waste Disposal by 11.5% Diverted 204,177 Tons of Waste from Landfills Through Waste to Profit Pairings Reduced 115,810 Tons of Greenhouse Gas Emissions Through Reduced Waste and Industrial Pollution Developing the Nation s Largest Urban Solar Power Plant Commenced Three Ground Source Heat Pump Projects And Counting Copyright 2009, City of Chicago

9 Higher Emissions: 31 days Projected number of 100-degree days per year in Chicago Lower Emissions: 8 days

10 Climate Matters: Extreme Heat Significant economic and health impacts


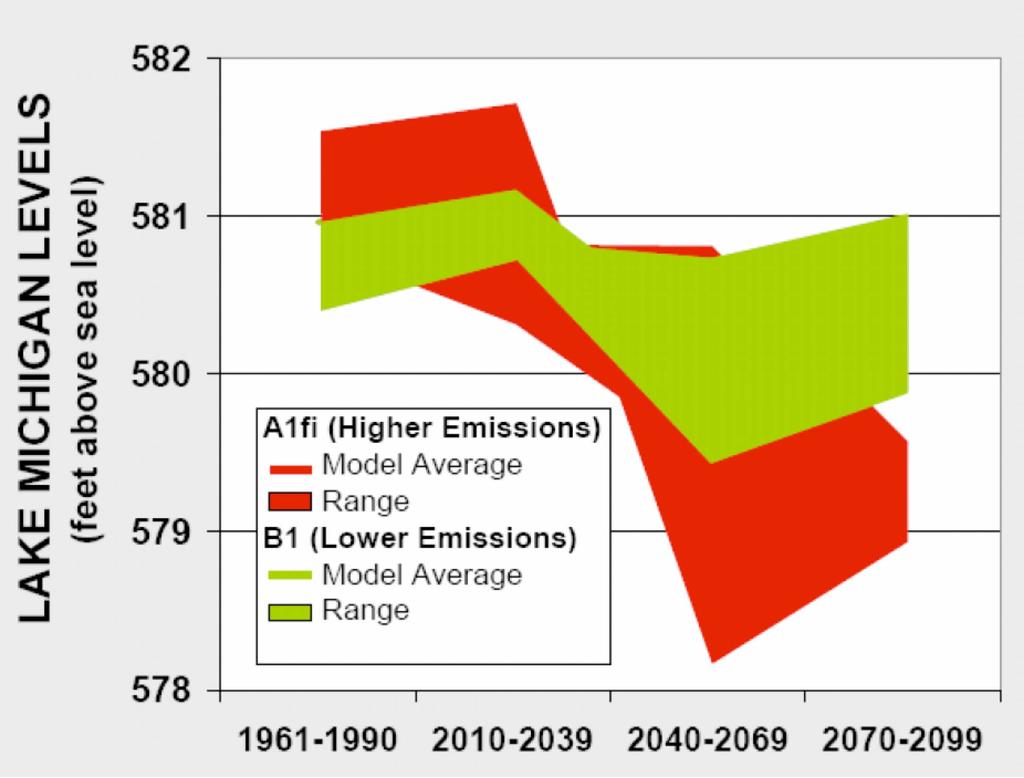
11 Climate Matters: Extreme Precipitation More rain when it is not needed, less when it is needed; adversely affecting Chicagoans


12 Climate Matters: Emergency Services More heat emergencies More storms More fires Increased demand on first responders
13

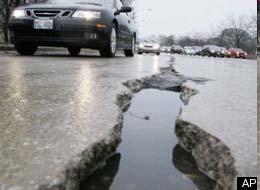
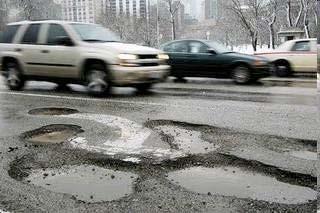
14 Slide for Pothole

15 2000 Chicago Greenhouse Gas Emissions Current Emissions: 34.6 MMTCO 2 e Other 9% Transportation 21% Buildings and Other Energy Uses 70% MMT: Million Metric Tons Copyright 2008, City of Chicago
16 Chicago s goal is to reduce city-wide emissions by 15.1 MMT CO2e by 2020 and 40.5 MMT CO2e by 2050 Business As Usual Emissions Levels in Chicago versus Emissions Targets 2 Projection of emissions if no action is taken Target MMT CO2e level Chicago s Greenhouse Gas emissions In MMT CO2e 2020 target: 25% emissions reduction = 15.1 MMT CO2e 2050 target: 80% emissions reduction = 40.5 MMT CO2e Year 1 MMT CO2e: Million Metric Tons Carbon Dioxide Equivalent. This is a standardized emissions metric that includes multiple greenhouse gases 2 BAU represents the assumption that emissions growth rates continue based on reasonable predictions for population growth and energy use in the city Source: CNT An inventory, forecast, and mitigation analysis


17 FIVE STRATEGIES Adaptation: Extreme Heat Extreme Precipitation Ecosystem Changes Building & Infrastructure Resiliency Copyright 2008, City of Chicago


18 Mitigation Improve residential, commercial, and industrial energy efficiency International standard for Chicago Energy Efficiency Code Required green commercial/residential renovations Expand appliance trade-in programs Improve water efficiency in buildings Increase trees and rooftop gardens Promote no or low cost mitigation actions to public Procure renewable electricity generation Upgrade 21 Illinois power plants Implement 2001 Energy Plan to expand distributed generation and other projects Boost power generation efficiency standards Household-scale renewable power and solar domestic hot water Invest in transit Provide incentives for transit use Plan and design around transit hubs Increase car sharing Increase walking and bike trips Increase vehicle alternative fuel use Improve fleet energy efficiency Advocate for higher federal fuel efficiency standards Foster more efficient freight movement Support intercity high-speed rail plan Reduce, reuse, recycle Promote alternative refrigerants Manage stormwater with Green Infrastructure Innovative cooling strategies Urban Heat Island reduction Energy reduction program City Tree Fund Thermal environment map Flexible labor agreements High reflectivity pavement Citywide storm water management plan Private sector green roofs Performance-based landscape ordinance Green alley design Single-lot storm water ordinance Energy resource management plan City building natural ventilation Improved recommended plant list Urban forest management plan Increased public education Climate change DSS in planning Benchmarking against other cities Future climate benchmarking against other cities Climate sensitive procurement City-wide climate change design Adaptation City heat response plan Ozone response activities Alternate school schedules Temperature trigger studies Indoor air quality evaluation MWRD watershed studies Water quality testing Permeable paving requirements Catch basin retrofits City-operated mosquito control Power vulnerability study Water pricing strategy Future-climate adapted City fleet Utility burial for street/traffic lighting Utility trenches Urban wetland management plan Ecosystem diversity index Emergency response planning and coordination Extended beach/boating season Restaurant and food supply research

19 Extreme Heat & Extreme Precipitation Strategic Adaptation Implementation Copyright 2009, City of Chicago


20 Urban Heat Island Copyright 2009, City of Chicago

21 Comprehensive Sewer Model Existing on Rogers Rogers Ave CIP Trunk Sewer Improved Existing Trunk $0 ~$6M ~$2M ~$8M Copyright 2009, City of Chicago
22
23 Climate Change Adaptation Process 2007: External Expert Engagement 2008: City Leaders Ownership 2009: Adaptation Business as Usual Climate Science: High & Low Emissions Climate Projections and Potential Impacts Economic Risk Analysis: Municipal Cost of Doing Nothing Adaptation Action Planning: Prioritizing Adaptation Actions by Risk & Time 5 Work Groups: 15 City Departments & 6 sister Agencies Create 39 Adaptation Tactics September 08: Mayor launches Chicago Climate Action Plan (CCAP) Department Work Plans Including Who Will Do What by When

24 Decision Pathway for Adaptation Actions for one Department

25 Economic Risk Impacts Analysis
26 Climate Change Adaptation Risk Scoring System Other 9% Transportation 30% Buildings and Other Energy Uses 61% MMT: Million Metric Tons Copyright 2008, City of Chicago

27 125 Potential Adaptation Actions Organized by Risk, Timing and Department Other 9% Transportation 30% Buildings and Other Energy Uses 61% MMT: Million Metric Tons Copyright 2008, City of Chicago
28 Adaptation Work Groups Chicago Climate Change Task Force Chicago Mayor s Office Extreme Heat: Office of Emergency Management and Communications Department of Buildings Work Groups and their Leading Departments Extreme Buildings, Ecosystems: Precipitation: Infrastructure & Department Department of Equipment: of Zoning and Water Department of Land Use Management Buildings and Planning Department of Transportation Department of Transportation Leadership, Planning and Communication: Department of Environment
29 City Department CCAP Work Plans Lead By Example Highlights CCAP work plans for 15 Departments & Sister Agencies Total of 458 CCAP initiatives CCAP milestones to be reviewed by Mayor s office

30 Quick Guide to Adaptation

31 Extreme Heat More than 400 projects and 7 million square feet total green roofs in the last 5 years. Extreme Weather Operations Plan now recognizes climate change impacts assessment information. Incorporating urban heat island information into urban forestry management plan. Photo: Chicago Solar Partnership Copyright 2008, City of Chicago


32 Extreme Heat Survey prepared for cooling center users (no extreme heat days to implement). Creating an Air Quality Action Agenda. Monitoring alternative roadway materials performance. Transforming market for infrastructure materials.

33 Extreme Precipitation Commenced enforcement of Stormwater Management Ordinance. Created urban forestry inventory. More than 60 green alleys and streets installed. Extreme Weather Operations Plan added a separate plan for extreme precipitation. Photo: Chicago Solar Partnership Copyright 2008, City of Chicago

34 Extreme Precipitation Completed model of City s sewer infrastructure, including analysis to identify potential impacts of green infrastructure and infrastructure modernization. Green Urban Design passed Plan Commission. Alternative dicing pilot is scaling out. City Council increased water rates.

35 Climate Change Adaptation: Ecosystem Change Partnering with city stakeholders to implement the Chicago Trees Initiative Commenced creation of urban forest management plan. Performance based Landscape Ordinance research funds granted. Partnering with Chicago Wilderness on species diversity index & recommended plant list. Copyright 2008, City of Chicago

36 Questions? Joyce Coffee