Soil Compaction. Chapter (6) Instructor : Dr. Jehad Hamad
|
|
|
- Todd Hood
- 5 years ago
- Views:
Transcription


1 Soil Compaction Chapter (6) Instructor : Dr. Jehad Hamad

2 What is Compaction? In most instances in civil engineering and/or construction practice, whenever soils are imported or excavated and re-applied, they are compacted. The terms compaction and consolidation may sound as though they describe the same thing, but in reality they do not.

 = W T1 V T1 g soil")
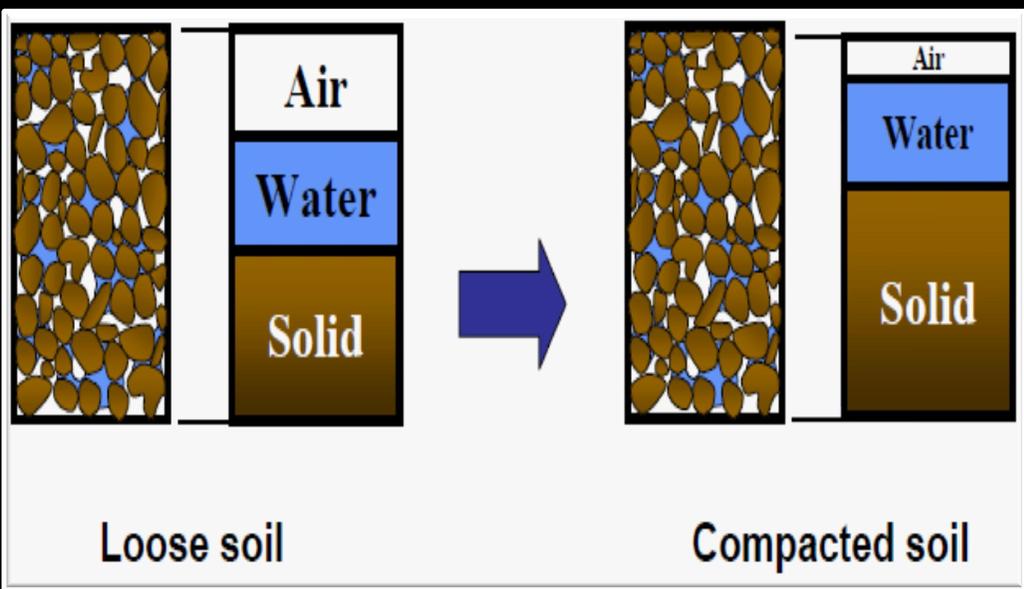
3 Definition: Soil compaction is defined as the method of mechanically increasing the density of soil by reducing volume of air. g soil (2) > g soil (1 ) Load Air Air Soil Matrix Water Solids Compressed soil Water Solids g soil (1) = W T1 V T1 g soil (2) = W T1 V T2
4 Soil Compaction Densification of soil by removing air voids using mechanical equipment Without changing its water content Increase Decrease STRENGTH STIFFNESS PERMEABILITY DURABILITY
5 What is Consolidation When a Static loads are applied to saturated soils, and over a period of time the increased stresses are transferred to the soil skeleton, leading to a reduction in void ratio. Depending on the permeability of the soil and the magnitude of the drainage distance, this can be a very time-consuming process. Typically applies to existing, undisturbed soil deposits that has appreciable amount of clay.
6 Compaction - Consolidation Compaction means the removal of airfilled porosity. Consolidation means the removal of water-filled porosity.

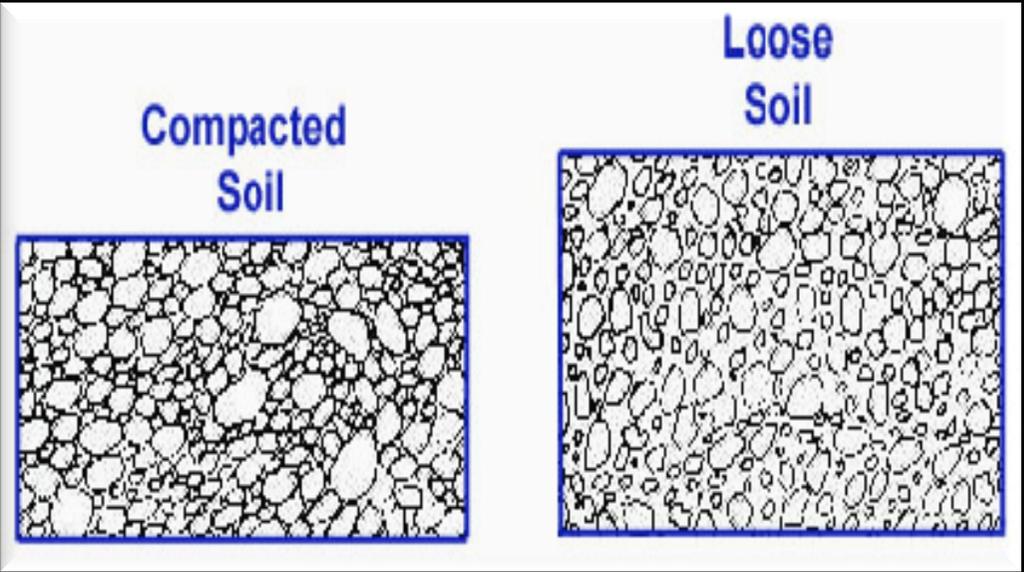
7 Principles of Compaction Compaction of soils is achieved by reducing the volume of voids. It is assumed that the compaction process does not decrease the volume of the solids or soil grains uncompacted compacted uncompacted compacted
8 What Does Compaction Do? 1. Increased Shear Strength Larger loads can be applied to stronger more compacted Soils 2. Reduced Permeability soils ability to absorb water, and therefore reduces the tendency to expand/shrink and potentially liquefy 3. Reduced Compressibility This also means that larger loads can be applied to compacted soils since they will produce smaller settlements. 4. Control Swelling & Shrinking 5. Reduce Liquefaction Potential

9 Water Role in Compaction Process Water lubricates the soil grains so that they slide more easily over each other and can thus achieve a more densely packed arrangement. A little bit of water facilitates compaction Too much water inhibits compaction.
10 Compaction Effect

11 Factors Affecting on Compaction There are 4 control factors affecting the extent of compaction: 1.Compaction effort;
12 Soil Compaction
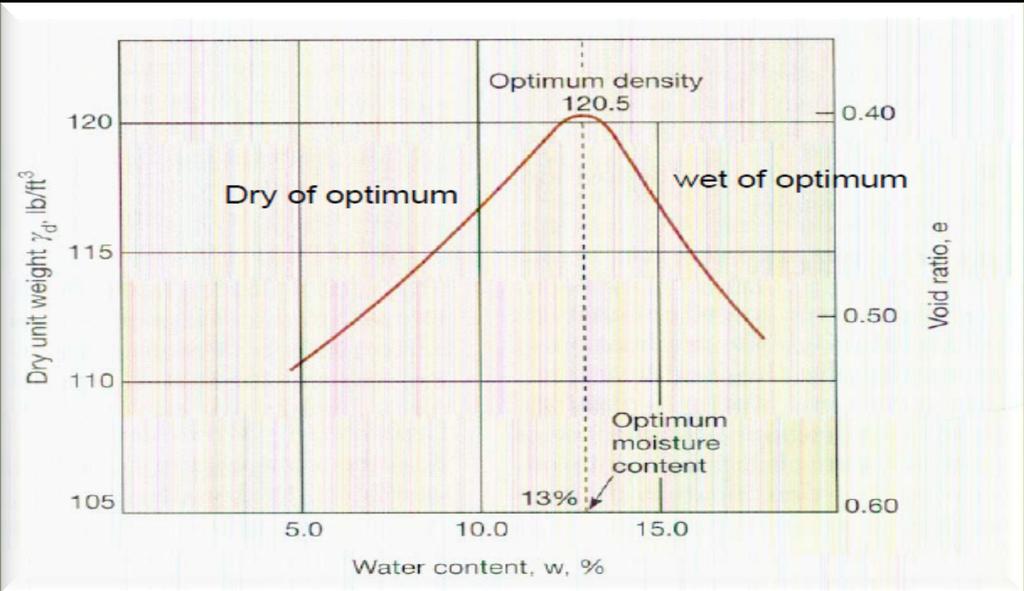
13 Effect of Water on Compaction In soils, compaction is a function of water content Water added to the soil during compaction acts as a softening agent on the soil particles Consider 0% moisture -Only compact so much Add a little water -compacts better A little more water -a little better compaction Even more water Soil begins to flow What is better compaction? The dry unit weight (γ d ) increases as the moisture content increases TO A POINT Beyond a certain moisture content,

14 Principle of Compaction

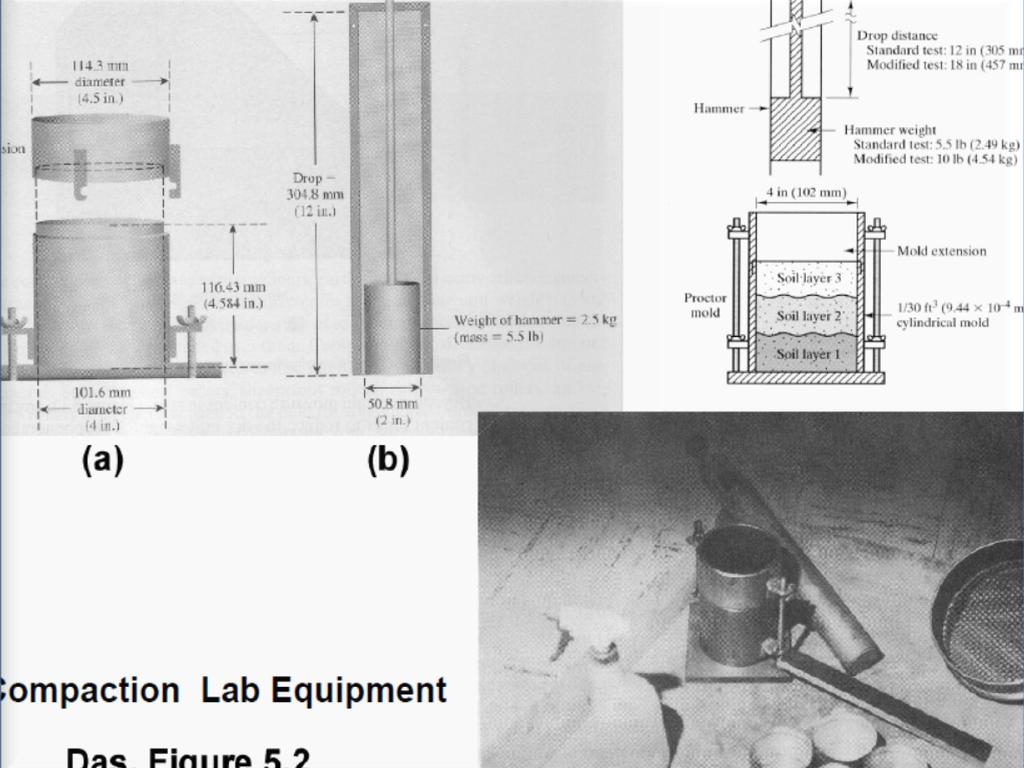
15 Standard Proctor Compaction Test 1 2 The standard was originally developed to simulate field compaction in the lab. Purpose: Find the optimum moisture content at which the maximum dry unit weight is attained 3 ASTM D Equipments;
16 Standard Energy Compactive (E) applied to soil per unit volume: E (# blows/layer) *(# of layers)*(hammer weight)*(height of Volume of mold drop) E (25blows/layer) *(3of layers)*(5.5 lbs)*(1.0 ft) (1/30)ft SP 12,375 ft lb / 3 ft 3

17 Standard Proctor 1/30 ft3mold 5.5 lb hammer 12 drop 3 layers of soil 25 blows / layer

18 Effort Compaction Effort is calculated with the following parameters Mold volume = 1/30 cubic foot Compact in 3 layers 25 blows/layer 5.5 lb hammer5.5 lb hammer 12" drop
19


20 Soil Compaction in the Lab: 1- Standard Proctor Test 2- Modified Proctor Test Standard Proctor Test Modified Proctor Test

21 Soil Compaction in the Lab: 1- Standard Proctor Test 5.5 pound hammer g dry G s g 1 e w Dry Density g ZAV = 1+ G s g w W c G s S r Zero Air Void Curve S r =100% H = 12 in g d max blows per layer w c1 w c2 w c3 w c4 w c5 1 2 Dry to Optimum Wet to Optimum 5 Compaction Curve g d1 g d2 g d3 g d4 g d5 Increasing Water Content (OWC) Optimum Water Content Water Content 4 inch diameter compaction mold. (V = 1/30 of a cubic foot) g dry = 1+ g wet W c 100 %
22

23 g dry max Optimum Water Content

24 The Shape of the Compaction Curve Dry Density air = 5%? d max Zero air voids line Soil too dry and brittle Soil too wet & deformable OMC Moisture content
 (OMC)")
25 1- Standard Proctor Test ASTM D-698 or AASHTO T-99 Dry Density Zero Air Void Curve S r = 60% Zero Air Void Curve S r =100% nergy = 12,375 foot-pounds er cubic foot g d max g d max Zero Air Void Curve S r < 100% Compaction Curve for Modified Proctor Compaction Curve for Standard Proctor 2- Modified Proctor Test ASTM D-1557 or AASHTO T-180 Energy = 56,520 foot-pounds per cubic foot (OMC) (OMC) Moisture Content

 Weight of wet soil in the mold (lb) Water Content (%)")
 Water Content (%) Dry Unit Weight (lb/ft 3 ) 1/30 1/30 1/30 1/30 1/30 1/30")

26 Example: The laboratory test for a standard proctor is shown below. Determine the optimum water content and maximum dry density. If the G s of the soil is 2.70, draw the ZAV curve. Volume of Proctor Mold (ft 3 ) Weight of wet soil in the mold (lb) Water Content (%) Solution: Volume of Mold (ft 3 ) Weight of wet Wet Unit soil in the Weight mold (lb) (lb/ft 3 ) Water Content (%) Dry Unit Weight (lb/ft 3 ) 1/30 1/30 1/30 1/30 1/30 1/ /30 1/30 1/30 1/30 1/30 1/ g dry = g wet W 1+ c % 100 g ZAV = 1+ G s g w W c G s S r

27 INFLUENCE OF SOIL TYPE ON COMPACTION CURVE Dry Density Sand,some fines Zero air voids line d max Clay Constant compaction energy OMC Moisture content

 Points from the ZAV curve can be calculated from: ZAV: The curve")

28 Dry density ( Mg / m ) 3 Holtz and Kovacs, 1981 Zero-Air-Void Degree of Saturation Degree of Saturation Line of optimums 60% 80% Modified Proctor Standard Proctor 100% "Zero Air Voids" Water content w (%) Points from the ZAV curve can be calculated from: ZAV: The curve represents the fully saturated condition (S=100%). ZAV cannot be reached by compaction. Line of Optimum: A line drawn through the peak points of several compaction curves at different compactive efforts for the same soil will be almost parallel to a 100 % S curve Entrapped Air: is the distance between the wet side of the compaction curve and the line of 100% saturation.

 Above w omc Wet of Optimum Water starts to replace soil particles in the mold, and since w << s the dry density starts to decrease.")
29 Dry Density (g d ) Holtz and Kovacs, 1981 Results-Explanation Below w omc Dry of Optimum As the water content increases, the particles develop larger and larger water films around them, which tend to lubricate the particles and make them easier to be moved about and reoriented into a denser configuration. Hammer Impact Air expelled from the soil upon impact in quantities larger than the volume of water added. At w omc The density is at the maximum, and it does not increase any further. Dry Side OMC Wet Side Water Content (w) Above w omc Wet of Optimum Water starts to replace soil particles in the mold, and since w << s the dry density starts to decrease. Hammer Impact Moisture cannot escape under impact of the hammer. Instead, the entrapped air is energized and lifts the soil in the region around the hammer.
30 Dry density (Mg / m 3 ) Holtz and Kovacs, 1981; Das, 1998 Effects of Soil Types on Compaction The soil type-that is, grain-size distribution, shape of the soil grains, specific gravity of soil solids, and amount and type of clay minerals present Zero air voids, S= 100 % Water content w (%)
31 Influence of Compaction Energy Modified Compaction Dry Density Standard Compaction Moisture content
32 Modified Proctor Test Same as the Standard Proctor Test with the following exceptions: E E The soil is compacted in five layers Hammer weight is 10 Lbs or 4.54 Kg Drop height h is 18 inches - Then the amount of Energy is calculated Remember Standard Proctor Energy MP MP (25blows/layer) 56,250 ft lb / ft *(5 of layers)*(10 lbs)*(1.5 ft) 3 (1/30)ft 3 E E MP SP 56,250 ft lb / 12,375 ft lb / ft ft
33 Comparison-Summary Standard Proctor Test Modified Proctor Test Mold size: 1/30 ft 3 12 in height of drop 5.5 lb hammer 3 layers 25 blows/layer Energy 12,375 ft lb/ft 3 Mold size: 1/30 ft3 18 in height of drop 10 lb hammer 5 layers 25 blows/layer Energy 56,250 ft lb/ft3

34 Dry Density or permeability Compaction and permeability B A C k min Moisture content
35 Field Density Sand Cone method Rubber balloon Method Nuclear Density method 35


36 Checking Soil Density in the Field: 1- Sand Cone (ASTM D ) A small hole (6" x 6" deep) is dug in the compacted material to be tested. The soil is removed and weighed, then dried and weighed again to determine its moisture content. A soil's moisture is figured as a percentage. The specific volume of the hole is determined by filling it with calibrated dry sand from a jar and cone device. The dry weight of the soil removed is divided by the volume of sand needed to fill the hole. This gives us the density of the compacted soil in lbs per cubic foot. This density is compared to the maximum Proctor density obtained earlier, which gives us the relative density of the soil that was just compacted. 2- Balloon Dens meter The same as the sand cone, except a rubber balloon is used to determine the volume of the hole 3- Nuclear Density (ASTM D ) Nuclear Density meters are a quick and fairly accurate way of determining density and moisture content. The meter uses a radioactive isotope source (Cesium 137) at the soil surface (backscatter) or from a probe placed into the soil (direct transmission). The isotope source gives off photons (usually Gamma rays) which radiate back to the mater's detectors on the bottom of the unit. Dense soil absorbs more radiation than loose soil and the readings reflect overall density. Water content (ASTM D3017) can also be read, all within a few minutes.
37 Sand Replacement 1. Cylindrical hole cut in soil 2. Soil kept and weighed (M), then moisture content (w) obtained by drying the soil 3. Obtain dry sand (SP) of known density ( sand ) when poured from a funnel 4. Pour dry sand from container into the hole 5. Loss in mass of container and sand M volume of hole (V = M/ sand )


38 Sand Cone 38


39 Hole prepared - plan Testing with clean dry sand - elevation


40 Nuclear Density
41 Nuclear Density Meter The rate at which gamma rays pass through the soil to reach a detector tube at the ground surface can be converted to wet density of the soil. Take a sample for moisture content and so obtain Dry Density

42 1. SET - UP 2. MEASURING - g photon count source g detector sand pad direct path indirect path Hole prepared
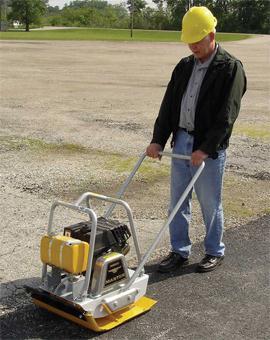
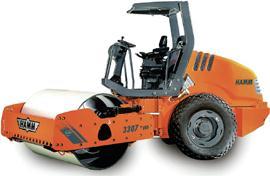
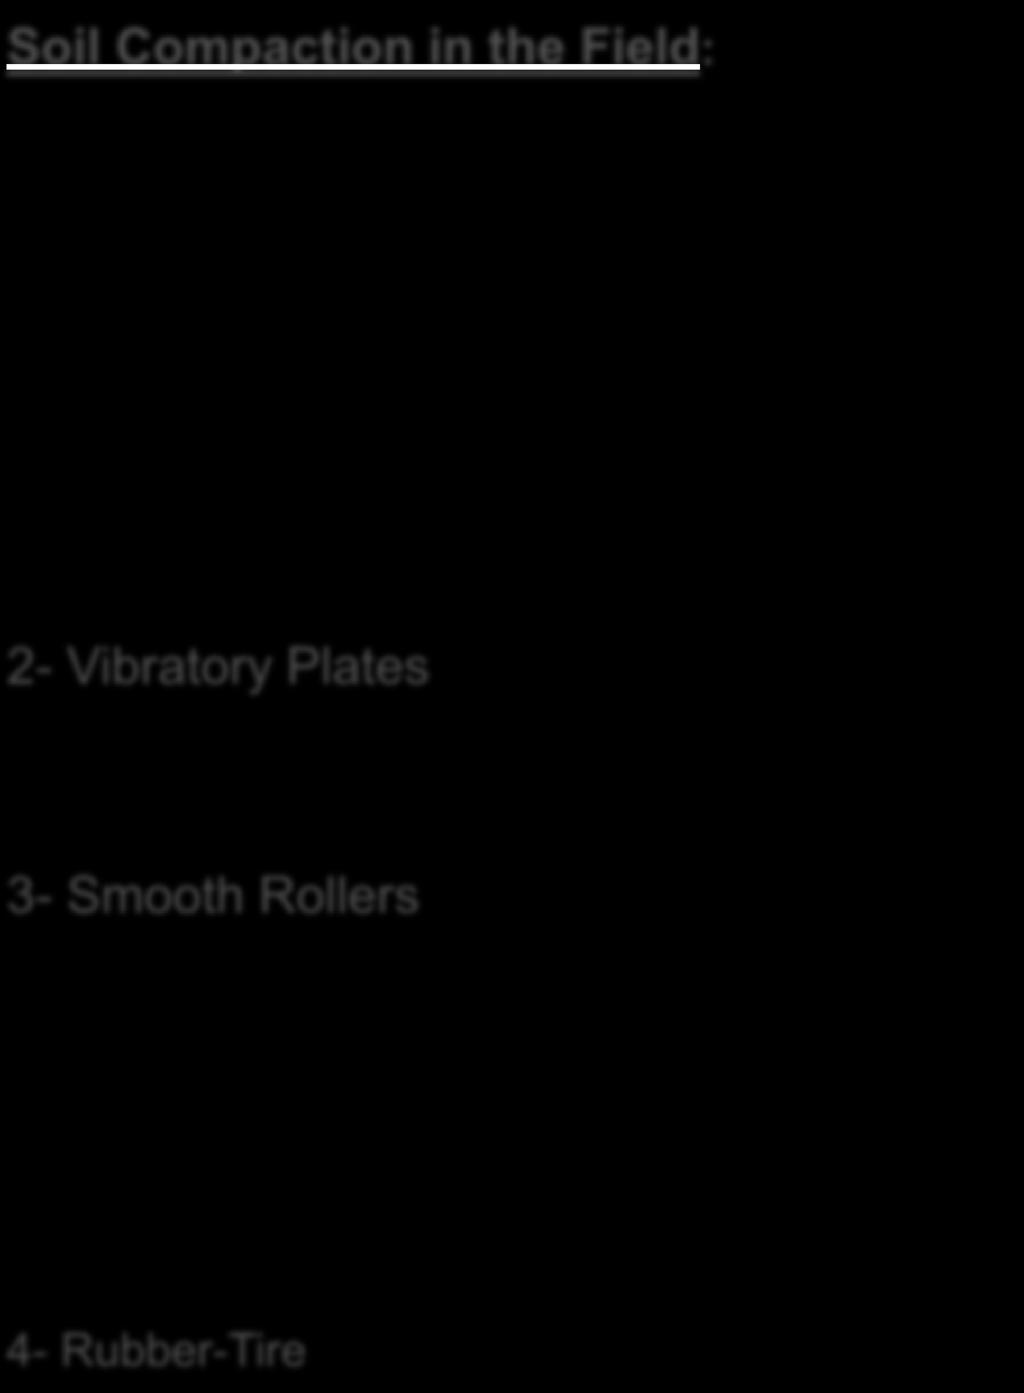
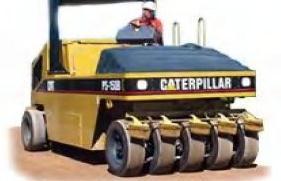
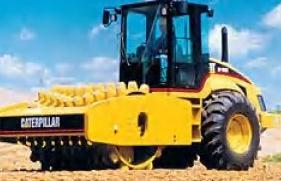
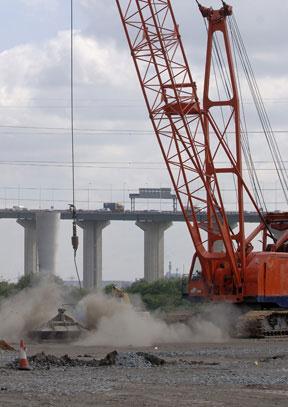
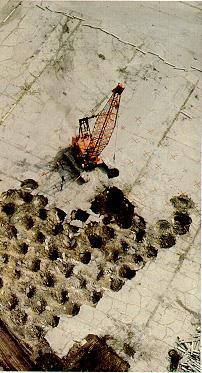
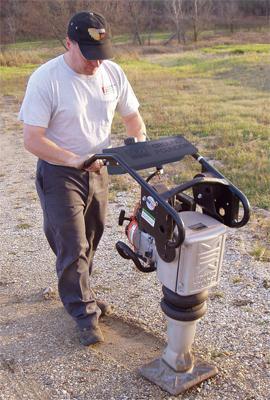
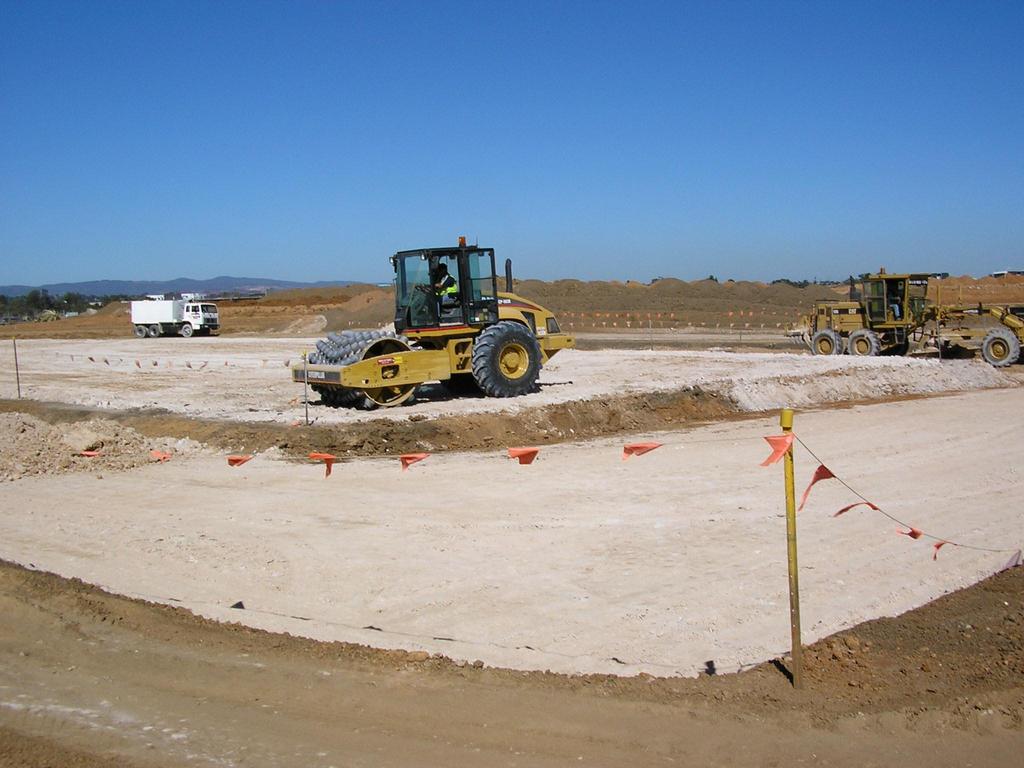
43 Soil Compaction in the Field: 5- Sheep foot Roller 2- Vibratory Plates 1- Rammers 6- Dynamic Compaction 3- Smooth Rollers 4- Rubber-Tire
44 Heavy Compaction Equipment Smooth steel rollers, with or without vibration Suitable for finishing operation of fills with sandy or clayey soil - double or single drum
45 Sheepsfoot roller Drum with large number of projections. Most Suitable for clayey soils Pneumatic roller Tires are closely Spaced Used for Sandy and clayey soils
46

47 Common Compaction Curves Encountered in Practice Dry unit weight g d Bell-shaped Double-peaked One & one-half peaks Odd-shaped Water content (w)
48 Dry Density Lambe and Whitman, 1979 Structure of Compacted Clay Intermediate structure High Compactive Effort Dispersed Structure or parallel Flocculated Structure or Honeycomb Structure or Random Particle Arrangement Water Deficiency Water Content Structure Dry side more random Dry side more deficient; thus imbibes more water, swells more, has lower pore pressure
49 Density Permeability Effect of Compaction on permeability 10-7 Permeability at constant compactive effort decreases with increasing water content and reaches a minimum at about the optimum If compactive effort is increased, the permeability decreases because the void ratio decreases. Water content
50 Void ratio, e Void ratio, e Effect of Compressibility Dry compacted or undisturbed sample Dry compacted or undisturbed sample Wet compacted or Remolded sample Wet compacted or Remolded sample Rebound for both samples 0 Pressure, natural scale Low pressure consolidation 0 Pressure, log scale High-pressure consolidation Compressibility of compacted clays is function of stress level. Low stress level: Clay compacted wet of optimum are more compressible.

51 Dry density ( Mg / m 3 ) Compaction and Shrinkage Dry of optimum OMC Wet of optimum Kneading Vibratory Static samples compacted wet of optimum have the highest shrinkage 1.60 S = 100% Legend Kneading compaction Vibratory compaction Molding water content (%) Static compaction
52 Why Soil Compaction: 1- Increase Soil Strength 2- Reduce Soil Settlement 3- Reduce Soil Permeability 4- Reduce Frost Damage 5- Reduce Erosion Damage Factor Affecting Soil Compaction: 1- Soil Type 2- Water Content (w c ) 3- Compaction Effort Required (Energy) Types of Compaction : (Static or Dynamic) 1- Vibration 2- Impact 3- Kneading 4- Pressure


53 Effect of Energy on Soil Compaction Increasing compaction energy Lower OWC and higher dry density Dry Density Higher Energy In the lab increasing compaction energy = increasing number of blows In the field increasing compaction energy = increasing number of passes or reducing lift depth Water Content

")
54 Field Soil Compaction Because of the differences between lab and field compaction methods, the maximum dry density in the field may reach 90% to 95%. Dry Density ZAV 95% g d max g d max (OMC) Moisture Content
55 Compaction Specifications: Compaction performance parameters are given on a construction project in one of two ways: 1- Method Specification detailed instructions specify machine type, lift depths, number of passes, machine speed and moisture content. A "recipe" is given as part of the job specifications to accomplish the compaction needed. 2- End-result Specification Only final compaction requirements are specified (95% modified or standard Proctor). This method, gives the contractor much more flexibility in determining the best, most economical method of meeting the required specs.
56