Ecological, Carbon and Water Footprints: how do they differ?
|
|
|
- Brook Ross
- 5 years ago
- Views:
Transcription


1 Ecological, Carbon and Water Footprints: how do they differ? Alessandro Galli, PhD. Tessin Room, IEH 2, 7-9 Chemin de Balexert, Geneva (CH) October 14-15, 2013

2 Objectives Ecological, Carbon and Water Footprint: definition and calculation Strengths and weaknesses Complementary and overlapping properties
 Def.")
3 The Indicators selected: definition Ecological Footprint (Wackernagel & Rees, 1996) Def.: human pressure on the planet in terms of the aggregate demand that resource-consumption and CO 2 emissions places on ecological assets. Water Footprint (Hoekstra, 2002) Def.: human appropriation of natural capital in terms of the total freshwater volume required (blue, green, grey) for human consumption. Carbon Footprint (multiple authors, ~2000 / 2008) Def.: human pressure on the planet in terms of the total GHG emissions (associated with an activity or accumulated over the life stages of a product) and human contribution to climate change.
4 Ecological Footprint RESEARCH QUESTION MAIN MESSAGE How much of the biosphere s regenerative capacity is directly and indirectly (i.e. embodied in trade) used by humans (namely Ecological Footprint) compared with how much is available (namely biocapacity), at both local and global scale. To promote recognition of ecological limits and safeguard the ecosystems preconditions (healthy forests, clean waters, clean air, fertile soils, biodiversity, etc) and life-supporting services that enable the biosphere to support mankind in the long term.


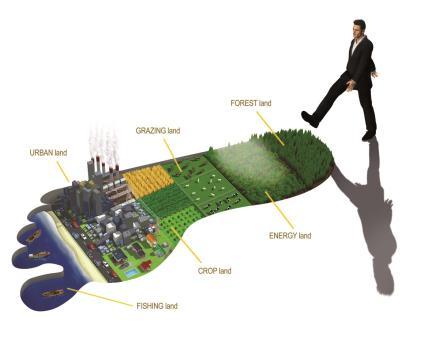
5 Ecological Footprint


6 Ecological Footprint Biocapacity: How much bioproductive area is available to us? Ecological Footprint: How much bioproductive area do we demand?
7 Water Footprint RESEARCH QUESTION Human appropriation of natural capital in terms of the volume of freshwater required for human consumption. MAIN MESSAGE The Water Footprint concept is primarily intended to illustrate the hidden links between human consumption and water use and between global trade and water resources management.
8 Water Footprint Green water footprint volume of rainwater evaporated. Blue water footprint volume of surface or groundwater evaporated. Grey water footprint volume of freshwater that is required to assimilate the load of pollutants based on existing ambient water quality standards.
9 Water Footprint total amount of water that is used to produce the goods and services consumed by the inhabitants of the nation. two components: internal water footprint inside the country. external water footprint in other countries. National water footprint = national water use + virtual water import virtual water export
10 Water Footprint Direct water footprint Indirect water footprint Non-consumptive water use (return flow) Water withdrawal Green water footprint Blue water footprint Green water footprint Blue water footprint Water consumption The traditional statistics on water use Grey water footprint Grey water footprint Water pollution [SOURCE: Hoekstra, 2008]
11 Carbon Footprint RESEARCH QUESTION MAIN MESSAGE The total amount of greenhouse gas emissions (CO 2, CH 4, N 2 O, HFC, PFC, and SF 6 ) that are directly and indirectly caused by human activities or accumulated over the life stages of products. The consumption-based perspective of the Carbon Footprint complements the production-based accounting approach taken by national greenhouse gas inventories (e.g., those considered by the Kyoto Protocol).
12 Carbon Footprint The six greenhouse gases identified by the Kyoto Protocol are included in the analysis: CO 2, CH 4, N 2 O, HFC, PFC, and SF 6 Results are expressed in kg CO 2-e and are calculated by multiplying the actual mass of a gas with the global warming potential factor for this particular gas, making the global warming effects of different GHGs comparable and additive The prevailing method for national Carbon Footprint accounting is environmentally extended multi-regional inputoutput analysis (EE-MRIO).


13 Carbon Footprint Emissions from source: territorial emissions Emissions from products and services: consumption emissions Horizon 2020 Capacity Building/Mediterranean Environment Programme Measuring our Carbon and Water Footprint June 20-21, Athens, 2011
14 CO2 emissions (Mt CO2) Carbon Footprint 850 ONS Environmental Accounts ("producer emissions") UK Carbon Footprint ("consumer emissions") Year Total UK CO2 emissions from 1992 to 2004 according to different accounting principles (in megatonnes of CO2) (note that the y-axis doesn't start at zero)
15 Comparing the Indicators: unit of measure UNIT OF MEASUREMENT ECOLOGICAL FOOTPRINT CARBON FOOTPRINT WATER FOOTPRINT Global hectares (gha) of bioproductive land. Gha is not a measure of area but rather of the ecological production associated with an area; Results can also be expressed in actual physical hectares. Kg CO 2 when only CO 2 is included or kg CO 2 -equivalent when other GHGs are also included ; No conversion to an area unit takes place to avoid assumptions and uncertainties. Water volume per unit of time (usually m 3 yr - 1 ) for the Water Footprint of processes; m 3 ton -1 or liter kg -1 for the Water Footprint of products; Water volume per unit of time for the Water Footprint of a geographical area.
16 Consumer Approach Ecological, Carbon, and Water Footprints emphasize the analysis of human demand from a consumer perspective. These indicators are not based on who produces a good or service but on the end-users that consume them. F C F P F I F E Footprint of Consumption Footprint of Production Footprint of Import Footprint of Export Trade analysis included

17 Not everything that is consumed in the West World toy imports

18 is being produced in the West. World toy exports
19 Comparing the Indicators: coverage ECOLOGICAL FOOTPRINT CARBON FOOTPRINT WATER FOOTPRINT Temporally explicit and multidimensional indicator that can be applied to single products, cities, regions, nations and the whole biosphere. More than 200 countries for the period are tracked (Ewing et al., 2010). Multi-dimensional indicator that can be applied to products, processes, companies, industry sectors, individuals, governments, populations, etc. 73 nations and 14 regions for the year 2001 only are tracked (Hertwich and Peters, 2009). Geographically explicit and multi-dimensional indicator: calculated for products, organizations, sectors, individuals, cities and nations. 140 nations for the period (Mekonnen and Hoekstra, 2010).
20 Comparing the Indicators: strengths ECOLOGICAL FOOTPRINT CARBON FOOTPRINT WATER FOOTPRINT Allows benchmarking human demand with nature supply and determining clear targets. It provides a holistic assessment of multiple anthropogenic pressures. (Integrated vs. Siloed) Easy to communicate and understand with a strong conservation message. It allows for a comprehensive assessment of human contribution to GHG emissions. It is consistent with standards of economic and environmental accounting. Represents the spatial distribution of a country s water demand. Expands traditional measures of water withdrawal (green and grey waters also included). Visualizes the link between (local) consumption and (global) appropriation of freshwater. Integrates water use and pollution over the production chain.
21 Comparing the Indicators: weaknesses ECOLOGICAL FOOTPRINT CARBON FOOTPRINT WATER FOOTPRINT Cannot cover all aspects of sustainability, neither all environmental concerns, especially those for which no regenerative capacity exists. Shows pressures that could lead to degradation of natural capital (e.g. reduced quality of land or reduced biodiversity), but does not predict this degradation. Not geographically explicit. Some underlying assumptions controversial but documented. Cannot track the full palette of human demands on the environment. Additional impact assessment models are needed to analyze the impact of climate change at both national and sub-national levels. Efforts needed to set up and update a system of MRIO tables and related environmental extensions. Only track human demands on freshwater. It relies on local data frequently unavailable and/or hard to collect. It suffers from possible truncation errors. No uncertainty studies are available, though uncertainty can be significant. Grey water calculation heavily relies on assumptions and estimations.
22 Testing the Indicators: complementary and overlapping properties The three indicators complement one another in assessing human pressure on the planet Track both direct and indirect human demands, enabling for a clear understanding of the hidden/invisible human-induced sources of pressure. However, only the Ecological and Water Footprint are able to account for both the source (resource production) and sink (waste assimilation) capacity of the planet.
23 Testing the Indicators: complementary and overlapping properties The Ecological Footprint is the sole indicator with a clear benchmark (biocapacity) to test human pressure against. For communication purposes national Carbon Footprints can be benchmarked against 2050 targets for per capita GHG emissions to achieve the goal of limiting temperature increase limited to 2 C above pre-industrial levels. Recent research suggests that it would be necessary to achieve stabilization below 400 ppm of carbon dioxide in the atmosphere to give a relatively high certainty of not exceeding 2 C.
24 Testing the Indicators: complementary and overlapping properties Human-induced CO 2 emissions are tracked by both the Ecological and the Carbon Footprint. Both EF and CF go beyond the sole CO 2 investigation as the Carbon Footprint also tracks the release of additional greenhouse gases and the Ecological Footprint also looks at human demand for food, fibers, wood products, etc. All three indicators illustrate the unequal distribution of resource use and/or related impacts between the inhabitants of different world regions.
25 Towards the Footprint Family The three indicators can be regarded as complementary in the sustainability debate: By looking at the amount of bioproductive area people demand because of resource consumption and CO 2 emission, the Ecological Footprint informs on the impact placed on the biosphere. By quantifying the effect of resource use on climate, the Carbon Footprint informs on the impact humanity places on the atmosphere. By tracking real and hidden water flows, Water Footprint can be used to inform on the impact humans place on the hydrosphere.
26 Thank You! David Lin, Ph.D. Director of Research Additional readings: Galli, A., Wiedmann, T., Ercin, E., Knoblauch, D., Ewing, B., Giljum, S. in press. Integrating Ecological, Carbon, and Water Footprint into a Footprint Family of indicators: definition and role in tracking Human Pressure on the Planet. Ecological Indicators. DOI: /j.ecolind For more information: