Particulate Transport in Grass Swales
|
|
|
- Augusta Russell
- 5 years ago
- Views:
Transcription

1 Particulate Transport in Grass Swales Robert Pitt, P.E., Ph.D., DEE and S. Rocky Durrans, P.E., Ph.D. Department of Civil, Construction, and Environmental Engineering The University of Alabama Yukio Nara Woolpert, Inc. Cincinnati, Ohio Jason Kirby, Ph.D. Department of Civil, Construction, and Environmental Engineering The University of Alabama at Birmingham
2 Selected Research Results IJC (1979) found swale drained areas had up to 95% less flows and pollutant yields compared to curb and gutter. NURP (1983) found soluble and particulate heavy metal concentrations reduced by 50% and COD, nitrate and ammonia nitrogen reduced by about 25%. Pitt & McLean (1986) found about 50% reductions in pollutant yields and runoff volume in an area half drained by swales; for small frequent rains very little runoff was observed in the swale area. Johnson, et al. (2003) at the Univ. of Alabama identified hydraulic characteristics of stormwater swales under typical flows and plant bioremediation benefits in swales for heavy metal trapping (report available through WERF). Recent research (Nara and Pitt 2005) at the Univ. of Alabama identified significant factors affecting particulate transport in grass swales and developed suitable model algorithms. Modeled procedure joins particle settling with swale hydraulics, including infiltration benefits.
3 Particulate Removal in Shallow Flowing Grass Swales and in Grass Filters Runoff from Pervious/ impervious area Reducing velocity of runoff Trapping of sediments and associated pollutants Sediment particles Infiltration Reduced volume and treated runoff
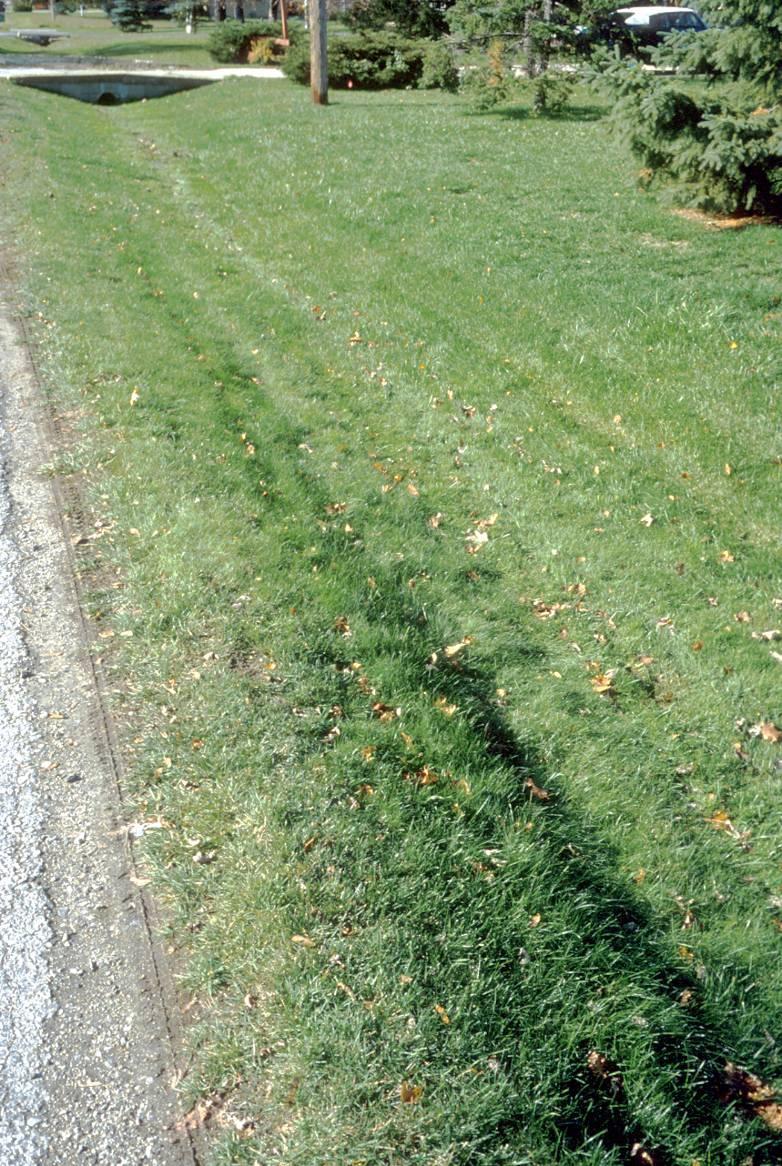
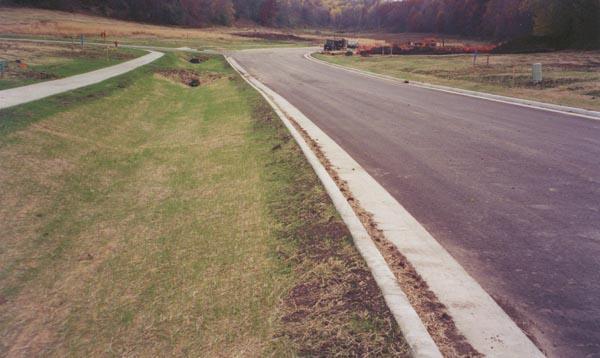
4 Grass-Lined Swales

5 Large capacity grass swales and channels designed for both conveyance and water quality objectives.

.")

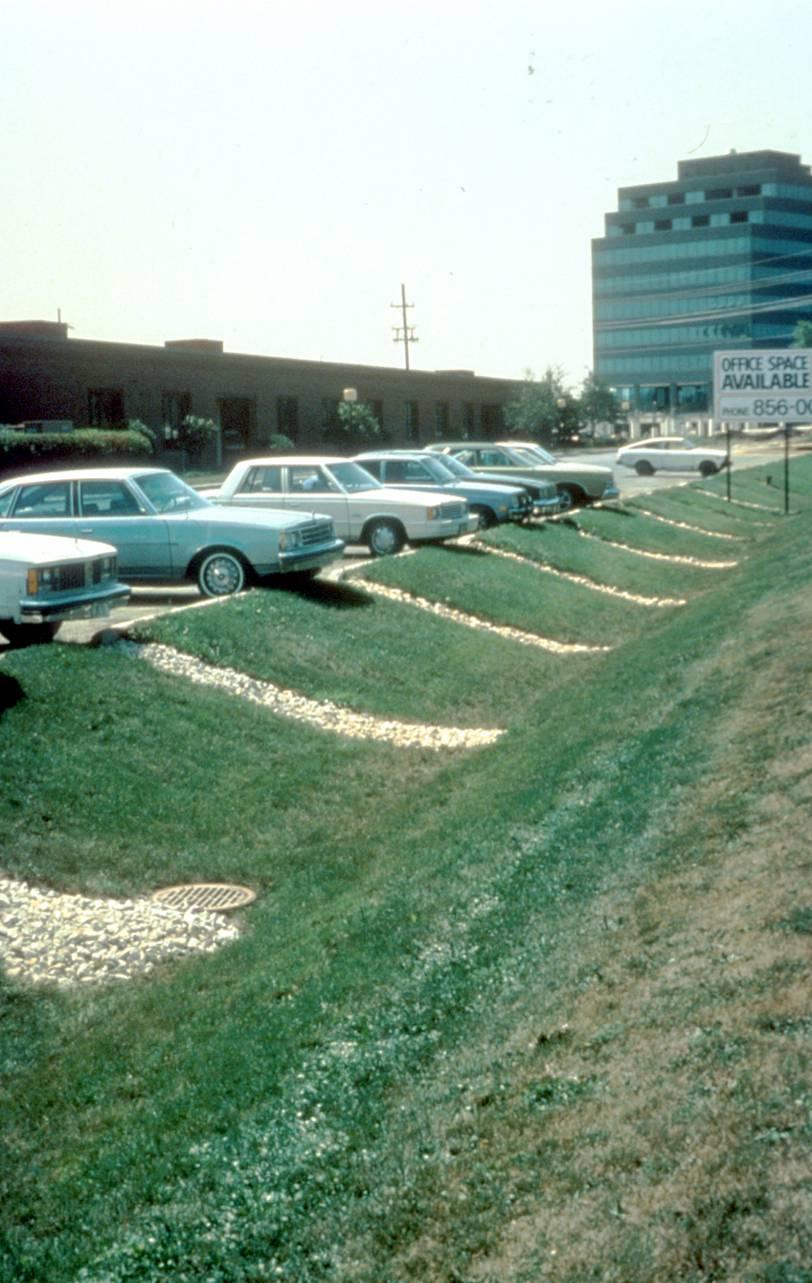
6 Grass Swales Designed to Infiltrate Large Fractions of Runoff (Alabama and Washington). Swales can be both interesting and fit site development objectives.
7 Elements of Conservation Design for Cedar Hills Development (near Madison, WI, project conducted by Roger Bannerman, WI DNR and USGS) Grass Swales Wet Detention Pond Infiltration Basin/Wetland Reduced Street Width


8 C e d a r H i ll S it e D e s ig n, C r o s s p la i n s W I E x p la n a t io n W e t p o n d In f ilt r a t io n s B a s in S w a le s S id e w a lk D r iv e w a y H o u s e s L a w n s R o a d w a y W o o d lo t N F e e t
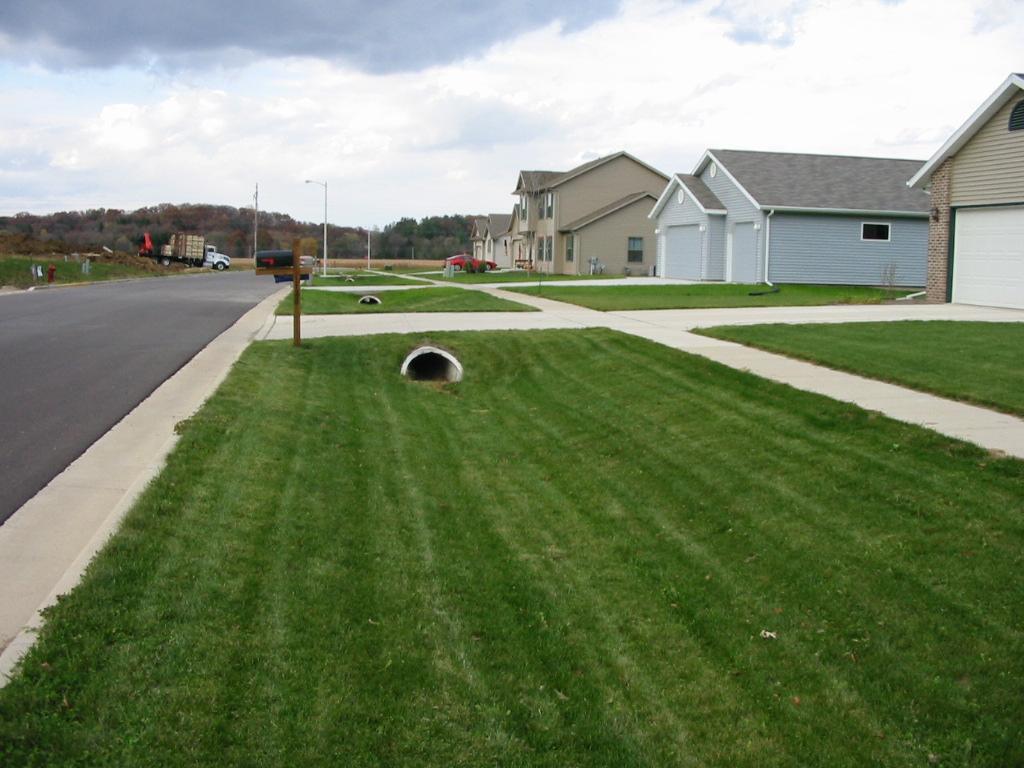
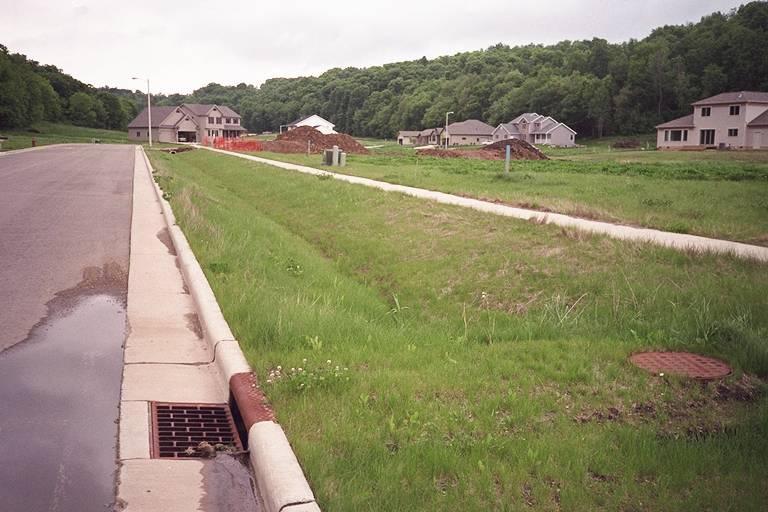
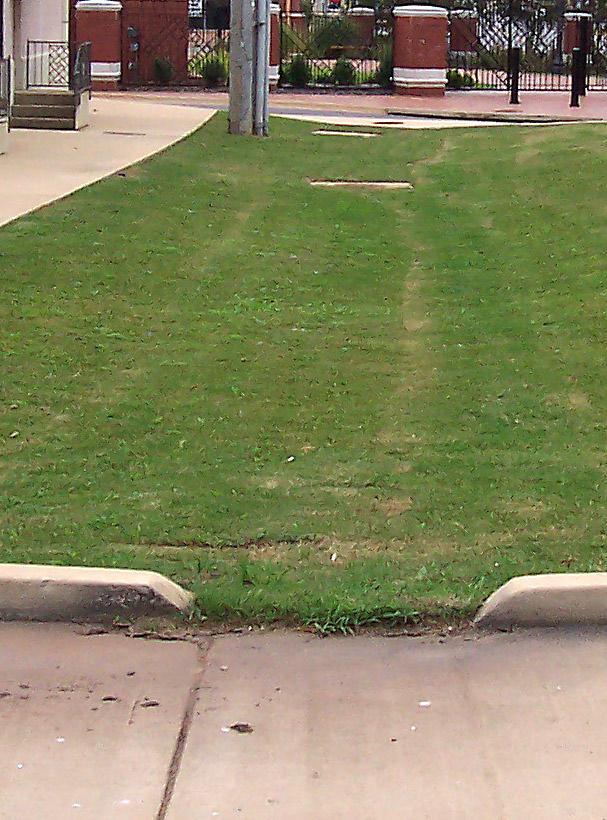
9 Conventional curbs with inlets directed to site swales WI DNR photo
10 Reductions in Runoff Volume for Cedar Hills (calculated using WinSLAMM and verified by site monitoring) Type of Control Runoff Volume, inches Pre-development 1.3 Expected Change (being monitored) No Controls % increase Swales + Pond/wetland + Infiltration Basin % decrease, compared to no controls 15% increase over pre-development
11 Research Objectives To understand the effectiveness of grass swales for different sized particles To understand the associated effects of different variables To develop a predictive model in sediment transport in grass swales
12 Initial indoor grass swale experiment 108 samples collected Second indoor grass swale experiment 108 samples collected Outdoor grass swale monitoring 69 samples collected (13 storm events)
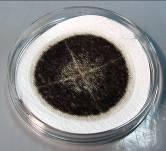
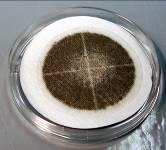
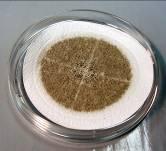
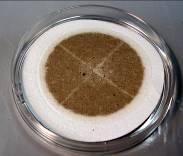
-log scale Head works 2ft 3ft Synthetic turf 6ft Zoysia")
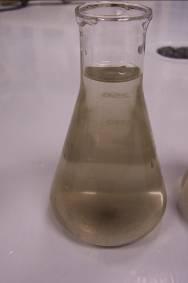
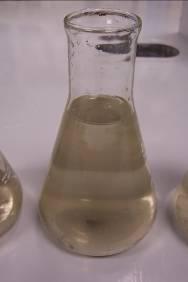
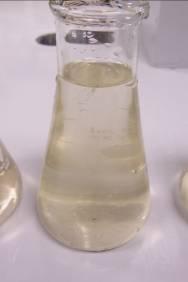
13 Cumulative mass (%) Sediments -Sand ( um) 10% -Sand ( um) 25% -Silica-#250 50% -Silica-#105 15% Mixing chamber Particle diameter (micro meter)-log scale Head works 2ft 3ft Synthetic turf 6ft Zoysia Bluegrass
14 Variables and analytical methods Study of variables 1) Grass types 2) Slopes 3) Flow rates 4) Swale lengths Analytical methods 1) Total solids 2) Turbidity 3) Total Suspended Solids 4) Total Dissolved Solids 5) Particle Size Distribution by Coulter Counter (Beckman Multi-Sizer III)
15 Total Suspended Solids (mg/l) Total Suspended Solids Bluegrass Head works Distance (ft) slope flow rate 1%_10gm 1%_15gm 1%_20gm 3%_10gm 3%_15gm 3%_20gm 5%_10gm 5%_15gm 5%_20gm
16 Tu r b id it y ( NTU) Box plots of turbidity concentrations at different swale lengths Statistical procedure: Kruskal-Wallis test p = ( o v e r a ll) p = p = p = ft 2 ft 3 ft 6 ft S w a le le n g t h
17 Significant factors and p-values at 6 ft P-values were computed for constituent concentrations for each variable
18 M e d ia n p a r t ic le s iz e ( m ic r o m e t e r ) Box plots of median particle sizes at different swale lengths Statistical procedure: Kruskal-Wallis test p = p = p = p = ( o v e r a ll) ft 2 ft 3 ft 6 ft S w a le le n g t h
19 Cumulative Volume (%) 100 Zoysia grass, 3% slope, 20 GPM ft 2 ft 3 ft 6 ft Particle diameter (µm)
20 Modeling Particulate Transport in Grass Swales and Grass Filters
21 Settling frequency Concept: = traveling time / settling duration the larger the settling frequency, the more times the particle will bounce along the flow path (with an increased probability of being permanently captured). Larger particles have a greater settling frequency than small particles for the same flow conditions: Traveling time = Swale length / flow velocity Settling duration = flow depth / settling velocity (Stoke s Law)
22 Percent reduction (%) Different grass types Percent reductions vs Settling frequencies Bluegrass Zoysia Synthetic turf Settling frequency
23 Percent reduction (%) Settling Frequency vs. Particulate Capture (a function of ratio of flow depth to grass height) Ratio: Ratio: Ratio: Total Dissolved Solids (<0.45 µm) Settling frequency

24 Outdoor Grass Swale Observations Description of the test site Length of swale: 116 ft Type of grass: Zoysia 3 ft 2 ft Head (0ft) Indicates sampling locations 116 ft 75 ft 6 ft 25 ft Approx. watershed area: 4200 ft 2 = 0.1 acres Events: 13 storm events from 8/22 to 12/08/04 Soil texture: compacted loamy sand Infiltration rate: < 1 in/hr


25 Small Puddle at Swale Entrance Paved road Watershed 0.1 acres Side walk 08/22/2004 Grass swale Building Inlet


26 Date: 10/11/ ft 75 ft TSS: 10 mg/l TSS: 20 mg/l 25 ft TSS: 30 mg/l 6 ft 3 ft 2 ft TSS: 63 mg/l TSS: 35 mg/l Head (0ft) TSS: 84 mg/l TSS: 102 mg/l
27 To t a l S u s p e n d e d S o lid s ( m g / L ) Box plots of TSS at different swale lengths Statistical procedure: Kruskal-Wallis test P=0.563 P=0.019 P= Scouring region High sediment reduction region Slight sediment reduction region mg/l mg/l mg/l S w a le le n g t h ( f t )
28 Cumulative vomule (%) Particle size distributions: 12/06/2004 Median particle size (µm) ft 2 ft 3 ft 6 ft 25 ft 116 ft 28.4 µm 7.5 µm Swale length (ft) Particle diameter (micro meter)
29 Percent reduction (%) Particulate Transport in Outdoor Swale (6 rain events) Percent reductions between 3ft and 25 ft vs. settling frequencies Settling frequency
30 Percent reduction (%) Comparison of regression line with 95% CI from indoor experiments and outdoor observations High initial concetration 200 mg/l mg/l (TSS) Ratio: Low initial concetration 40 mg/l mg/ L (TSS) Ratio: Settling frequency
31 Example: Sediment Capture in Grass Swale the discharge rate is 29 ft 3 /sec (0.80 m 3 /sec) and the particulate solids influent concentration is 250 mg/l the channel bottom width is 5 ft (1.5 m) wide, with 3 (H) to 1 (V) side slopes the calculated normal depth is 0.7 ft (210 mm, 21 cm) and the velocity is calculated to be 5.8 ft/sec (1.8 m/sec) after mature vegetation is established the swale length for this area is 1,250 ft (378 m)
32 Water is assumed to enter the swale at the midpoint location, resulting in an effective treatment swale length of 625 ft (189 m). With a water velocity of 5.8 ft/sec (1.8 m/sec), the average travel time is 189 m/1.8 m/sec = 105 sec (1.8 m) for this length. The mature grass is about 3 inches (75 mm) in height, so the flow depth to grass height ratio is 210 mm/75 mm = 2.8. The suspended solids concentration is determined to be 250 mg/l and the particle size distribution of the water entering the swale is typical.
33 Particle Size Range Approx. % of Particulate Solids in Range Particulate Concentration in Size Range 0.45 to 2 µm to 5 µm to 10 µm to 30 µm to 60 µm to 106 µm to 425 µm Total: mg/l
34 Percent reduction (%) 100 Comparison of regression lines with 95% Confidence Intervals by different (Flow depth)/(grass depth) Ratios Ratio: 0 to 1.0 Ratio: 1.0 to 1.5 Ratio: 1.5 to Total Dissolved Solids (< 0.45 µm) Settling frequency
35 Particle Size Range Approx. Settling Rate (cm/sec) Settling Time for 21 cm Flow Depth (sec) Settling Frequency for Swale (105 sec travel time) Percent Reduction in Size Range (median) 0.45 to 2 µm 1.52 x , to 5 µm 1.10 x , to 10 µm 5.05 x , to 30 µm 3.59 x to 60 µm to 106 µm to 425 µm
36 Particle Size Range (µm) Influent Particulate Conc. in Size Range Irreducible Conc. for Size Range (mg/l) Particulate Conc. for Size Range after Swale (mg/l) Final Resultant Conc. for Size Range (mg/l) 0.45 to to to to to to to An overall 62% reduction in suspended solids concentration was achieved for this example (250 mg/l influent and 96 mg/l effluent).
37 Conclusions Grass swales and grass filters can be an important component in conservation design. Grass swales can be designed to provide suitable storm drainage benefits and water quality benefits. Particulate trapping by filtering and sedimentation only occurs for relatively shallow flows, and is therefore most important for smaller events in swales. Infiltration (and associated pollutant trapping) may be more important for larger events. Monitoring results have confirmed excellent pollutant yield reductions in swales. Grass swales must be carefully designed to ensure adequate channel stability.