CROCODILE (WEST) RIVER RETURN FLOW ANALYSIS STUDY
|
|
|
- Sydney Williams
- 5 years ago
- Views:
Transcription
1 CROCODILE (WEST) RIVER RETURN FLOW ANALYSIS STUDY LIST OF REPORTS Main Report Inception Report Current and Projected Population for the Study Area Primary Water Requirements Infrastructure, Land use and Update of Return flows Relationship Algorithms and Calibration Return Flow Model User Guide Return Flow Scenarios P WMA 03/000/00/0504 P WMA 03/000/00/0604 P WMA 03/000/00/0704 P WMA 03/000/00/0804 P WMA 03/000/00/0904 P WMA 03/000/00/1004 P WMA 03/000/00/1104 P WMA 03/000/00/1204 P WMA 03/000/00/1304 REFERENCE This report is to be referred to in bibliographies as Department of Water Affairs and Forestry, South Africa, 2004 Crocodile (West) River Return Flow Analysis Study. Prepared by the Consultants DMM Development Consultants CC Laubscher Smith Engineers (Pty) Ltd WRP Consulting Engineers (Pty) Ltd. Report No. P WMA 03/000/00/0604
2 Title Crocodile (West) River Return Flow Analysis Study Authors Status of Report Study Team Final First Issue 29 February 2004 Final Issue 30 CONSULTANTS DMM Development Consultants CC Laubscher Smith Engineers (Pty) Ltd WRP Consulting Engineers (Pty) Ltd. Approved for Consultants by P J Laubscher Study Leader DEPARTMENT OF WATER AFFAIRS AND FORESTRY Directorate National Water Resource Planning Approved for the Department of Water Affairs and Forestry by C F B Havenga Chief Engineer J A van Rooyen Manager
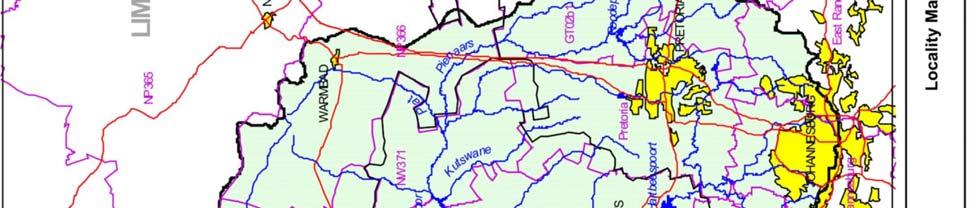
3 CROCODILE RIVER (WEST) RETURN FLOW ANALYSIS STUDY Executive summary 1. INTRODUCTION The Crocodile (West) River catchment is a densely populated, substantially urbanised and industrialised catchment and contains a large component of irrigation agricultural development (a locality map is provided as Figure 1.1). Water requirements in the catchment exceed the yield of local water resources, and transfers are required from adjacent catchments to augment the supply. It is estimated that return flows accounted for 30% of the catchment yield at the 1996 development level. Development in the Crocodile (West) River catchment forms the largest economic contribution to GDP. It is expected that this momentum of growth will continue. Associated to this pattern, it is expected that return flows in the Crocodile (West) River catchment area will continue to grow and will in future play an increasingly important role in the quantity, quality and locality of water resources. Return flows have been increasing with the increase in water use until now, but the future trend is unknown as it depends on a number of factors, which include population growth, land use planning, water conservation and demand management, re-use incentives, industrial and mining development, changes in irrigation practices, etc. This study is the first phase of a multi-phase updating of the Water Resources Yield and Planning Models being used to model the availability, use and yield balances in the catchment. The need to quantify return flows was identified as a priority in the process of updating the models. 2. STUDY OBJECTIVE The main objective of the study was to develop a return flow model linking water requirements with return flows, to calibrate the model by using existing information and to develop future scenarios of return flows, up to the 2020 planning horizon in 5-year intervals, for the study area. The study included the analysis of return flows from urban, mining, industrial and agricultural land use activities at a comprehensive level of detail. P WMA 03/000/00/0604 1


4 P WMA 03/000/00/0604 2
5 3. STUDY METHODOLOGY In order to achieve the study objectives the following methodology was followed The current status of the return flows and water use in the catchment, as well as the land use characteristics that have an impact on the return flows under current and projected future conditions were established. Simultaneously a desktop investigation was conducted to assess the impacts of water conservation and demands management as well as tariffs on return flows; Return flow algorithms for the irrigation, mining and a combination of the urban and industrial sectors were developed. The status quo investigation however indicated that the mining sector does not contribute significantly to return flows due to a zero effluent discharge policy being practised by all mines in the study area; Once developed, these return flow algorithms were calibrated for the year 2001 using the existing historical information; The calibrated urban/industrial model was finally used to derive five return flow scenarios for planning purposes up to the 2020 planning horizon in 5-year intervals. These scenarios were developed to provide an indication of the impact of government policies with regard to poverty alleviation and service delivery as well as water conservation and demand management on water requirements and return flows. It is envisaged that the model and the scenarios will be of benefit to both Water Resource and Water Services related planning activities; and Since the general strategy in the catchment area is that irrigation development will remain at current levels, sensitivity analysis rather than deriving scenarios were undertaken with the irrigation model. These assessments investigated the potential impact that changes in irrigation applications systems and improved scheduling practices could have on the demands and return flows. It is important to note that considerable care was taken to ensure that the data produced from this study is in a format compatible with the water resource planning models that will be applied in further planning phases. 4. RETURN MODELLING RESULTS A total return flow into the river system of 359 million m 3 /a was estimated for the year 2001 from the calibration process from both the urban and irrigation sectors. The urban sector generates by far the larges portion of return flows (76%) compared to the irrigation sector (24%). The analysis further confirmed that the urban sector is mainly responsible for return flows in the upper part of the catchment whereas the irrigation sector is dominant in the main stem of the Crocodile (West) River downstream of Hartbeespoort Dam. Total water requirements for 2001 of 495 million m 3 /a and almost 600 million m 3 /a P WMA 03/000/00/0604 3
6 were estimated for the urban/industrial and irrigation sectors respectively. For the urban/industrial sector the total return flows into the river system represents 56% of the water requirement compared to 15% for the irrigation sector. The return flow results for the different future scenarios are graphically presented in Figure 1.2. It is proposed that Scenario B representing the improvement in service levels to at least fully serviced houses on small erven (Category 3) by 2020 be considered as the Intermediate Scenario. The other scenarios would therefore represent either alternative High Scenarios (C and E) or alternative Low Scenarios (A and D) Return flows (10 6 m 3 /a) No improvement in service levels (A) Improvement in service levels to at least NWRS Category 3 by 2020 (B) Improvement in service levels to at least NWRS Category 3 by 2020 and improvement of water supply infrastructure (C) Impact of Water Conservation and Demand Management through tariff increases (D) Improvement in service levels to at least NWRS Category 3 already by 2010 (E) Planning horizon (years) Figure 1.2 Scenario results Total return flows into river system 5. CONCLUSIONS The following main conclusions could be drawn from the results of the study It was possible to develop an urban/industrial as well as an irrigation sector return flow model by linking water requirements with return flows in a combined modelling approach; The calibration results of the urban/industrial sector compare favourably with the available measured values for both the water requirements as well as the return flows for the 2001 base year used in the study; P WMA 03/000/00/0604 4
7 The availability as well as the format and spatial distribution of reliable water requirement and return flow data proved to be a considerable problem for all sectors especially for the irrigation sector for which no return flow data exists. It was however possible to overcome this problem for the irrigation sector by comparing it with previous study results carried out in other areas; The urban sector is by far the dominant sector (76%) compared to the irrigation sector (24%) and analysis showed that the urban sector is mainly responsible for return flows in the upper part of the catchment whereas the irrigation sector is the dominant sector in the main stem of the Crocodile (West) River downstream of Hartbeespoort Dam; and The scenario results show that the effective implementation of water conservation and demand management would result in a significant decrease in the water requirements as well as the return flows. On the other hand, the policies of government for improved service delivery would result in a significant increase in the water requirements as well as the return flows. 6. RECOMMENDATIONS The following main recommendations are made especially with regards to the possible improvement of the different models and their calibration and usefulness Urgent attention should be given to address the problems experienced with the availability, formatting, reliability and spatial distribution of both water requirement and return flow data for the urban sector through existing process such as the development of Water Services Development Plans. Similar process should be initiated at a Water User Association level to improve the reliability of the data in the irrigation model; The irrigation model calibration could be improved by obtaining certain soil and water loss related data through research as well as using measured water requirements and return flows; and finally These return flow models should be used in future for water resource as well as water service planning studies as it provides a means of determining the impact of water demand management measures, since the use and return flows are modelled as a unit. P WMA 03/000/00/0604 5