Cost-effective Allocation of Conservation Practices using Genetic Algorithm with SWAT
|
|
|
- Coleen Thomas
- 5 years ago
- Views:
Transcription
1 Cost-effective Allocation of Conservation Practices using Genetic Algorithm with SWAT Manoj Jha Sergey Rabotyagov Philip W. Gassman Hongli Feng Todd Campbell Iowa State University, Ames, Iowa, USA

2 Raccoon River Watershed
3 Raccoon River Watershed Covers approximately 9,400 km 2 of West Central Iowa Surface water from the Raccoon River is for drinking water supply for more than 370,000 residents in Des Moines and in other central Iowa communities Class C water quality standard applies to the Raccoon River at the intake USEPA MCL for Nitrate: 10 mg/l Nitrate concentration often exceeds MCL (exceeds 24% of the time from )
4 Average concentration = 6.45 mg/l (range over ) Peaked greater than 12 mg/l for 8 of the 10 monitored years Exceeded 10 mg/l 24% of the time from

5 Des Moines Water Works (DMWW) World s largest nitrate removal facility (10 millions gal. of water per day)
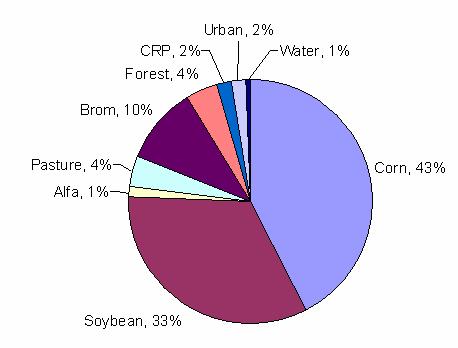
6 Raccoon River Watershed Non Point agricultural sources are the principal contributor of the elevated nitrate concentration Prime agricultural area dominated by corn and soybean production in over 75% of the watershed Nitrate is primarily delivered to stream with subsurface flow including baseflow and tile drainage Baseflow contribution to nitrate loads are greater than 80% in late fall and spring
7 SWAT Model Physically based and continuous watershed scale hydrology and water quality model Operates on a daily time step Developed to predict impacts of land management practices on watershed hydrology and water quality Extensively used world wide; over 250 peer reviewed publications
8 SWAT Model In SWAT modeling: - a watershed is divided into multiple subwatershed which are further subdivided in0to lumped units called hydrologic response units (HRUs) - hydrology and water quality components are computed at HRU and then the resulting loadings are summed together at subwatershed level which are then routed through main channels and reservoirs to the watershed outlet.
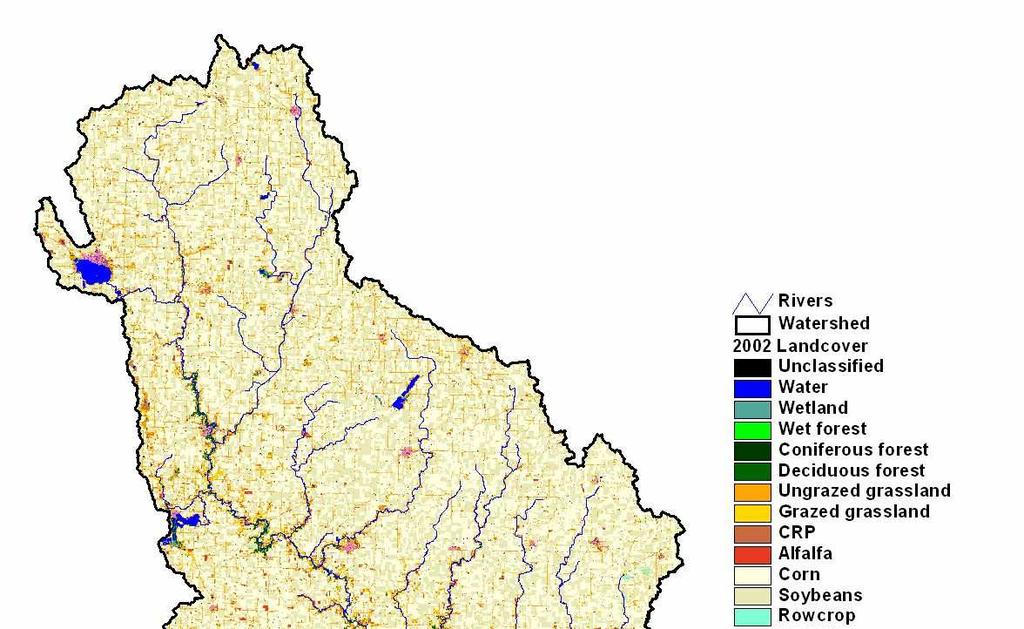
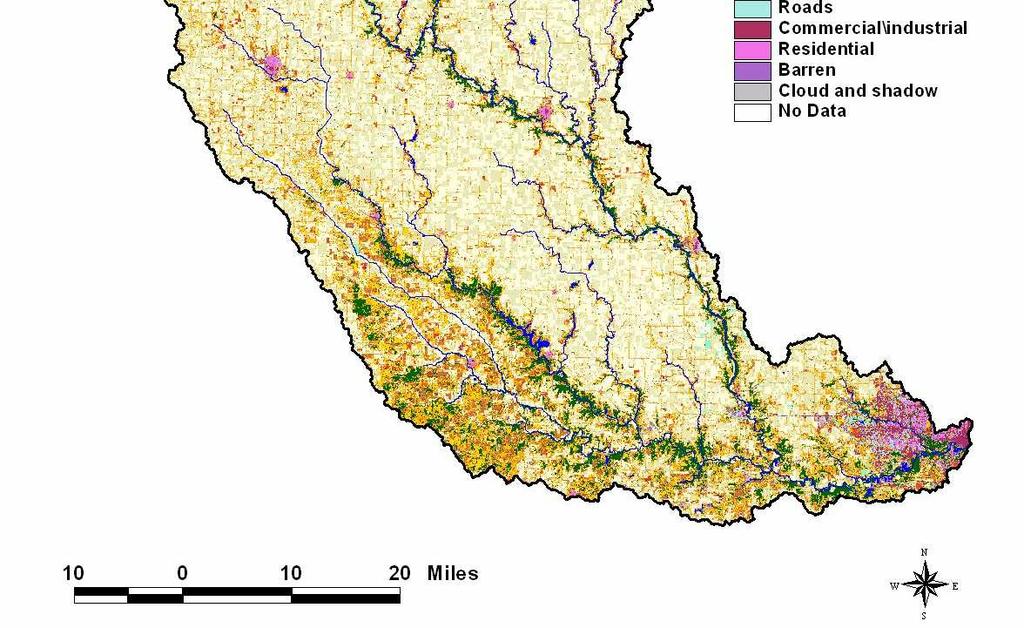
9 SWAT Model Setup Topography: 30m DEM USGS Seamless Data Distribution System EROS data center Landuse data: 2002 Landcover Iowa DNR GIS Library Soil data: SSURGO NRCS Soil Data Mart Climate data: National Weather Service COOP Iowa Environmental Mesonet
10

11 Watershed Delineation at HUC12 level
12 SWAT Model Setup Tile Drainage Classification method for soil require tile drainage: slope 5%; drainage class > 40 (poor through very poor); and subsoil groups 1and 2 (clay < 40%) OR slope 2%; drainage class of poor to very poor; and hydrologic group D
13 SWAT Model Setup Fertilizer Application Iowa Department of Agricultural and Land Stewardship (IDALS) Iowa Ag Census data Manure Application Manure from feedlots (cattle manure) Manure from grazing operation (cattle on pasture) Manure from CAFOs Point Source Data Cattle in Streams Septic discharge (US Census data) WWTP discharge (Iowa DNR)
 Fertilizer")

14 Summary N Inputs (MT) Fertilizer 57,663 Manure 31,528 Human 442 Industry 83
15 SWAT Model Setup ArcView GIS interface of the SWAT model (AVSWAT) was used for watershed delineation: 108 subwatersheds more than 3,500 HRUs SWAT model version 2005 was used in the simulation Rainfall-runoff : CN method Evapotranspiration : Penman-Monteith Channel Routing : Muskingum method
16 Modeling Results Hydrologic balance of the watershed (ave. annual values for ) Precipitation = 840 mm Snowfall = 94 mm Surface runoff = 96 mm Tile flow = 56 mm Groundwater = 78 mm Baseflow = 134 mm (58% of streamflow) Evapotranspiration = 595 mm (71% of precipitation)
 R 2 = 0.80 E = 0.")
17 Annual Streamflow Calibration ( ) R 2 = 0.94 E = 0.93 Validation ( ) R 2 = 0.80 E = 0.76
18 Monthly Streamflow Comparison at Van Meter, IA Calibration ( ) R 2 = 0.86 E = 0.86 Validation ( ) R 2 = 0.88 E = 0.87

19 Sediment Yield
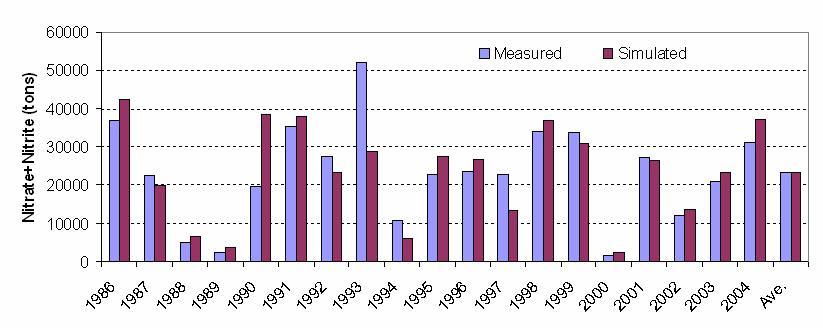
20 Nitrate+Nitrite

21 Organic Nitrogen

22 Ammonia Nitrogen
23 Mineral Phosphorus
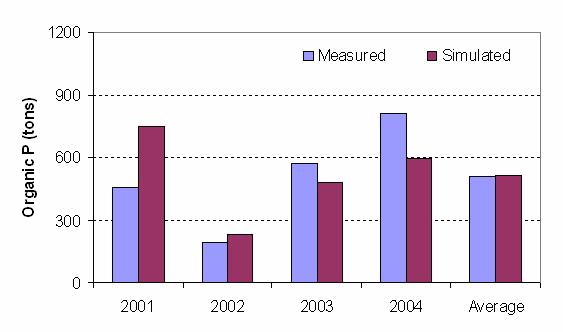
24 Organic Phosphorus
25 Genetic Algorithm Optimal placement of conservation practices is required for cost-effective water quality benefits If, N: conservation practices (CPs) for possible adoption F: total number of fields (HRUs) in a watershed posssible combinatios = N F Genetic algorithm provides a solution strategy of this sort of problems. Genetic algorithm is an evolutionary algorithm, which searches for solutions among an enormous amount of possibilities
26 Genetic Algorithm and SWAT We integrate modern evolutionary algorithm (SPEA2) with SWAT model to search for a frontier of cost-effective nutrient pollution reduction solutions for a watershed Similar attempts: Srivastava et al. (2002), Veith et al. (2003), Muleta and Nicklow (2005), Lant et al. (2005) and Arabi et al. (2006) For each HRU, there are 33 mutually exclusive options: land retirement, and interacting 4 tillage types (CT, RT, MT, NT) with conservation practices (terraces, contouring, grassed waterways) and 20% N fertilizer reduction
27 Algorithm Flow Diagram
28 2-D View 3-D view
29
30 Cost and Pollution Outcome Point # 638 Nitrate Reduction Phosphorus Reduction % from baseline Cost of achieving reductions, M$/year
31 Land allocation for selected scenarios, km 2 Reduced Tillage

32 Land allocation for selected scenarios, km 2 Reduced Tillage + Grassed Waterways
33 Land allocation for selected scenarios, km 2 Land Retirement
34 Some Implications Algorithm favors: Grassed Waterways as a P reduction practice N fertilizer reductions for small reduction in nitrate loadings land retirement for medium to large reductions in nitrate loadings Cost of nitrate control rise dramatically once land retirement has to be utilized
35 Conclusions SWAT modeling framework is set up for the Raccoon River Watershed with detailed land management information. Raccoon SWAT setup is calibrated and validated for watershed hydrology, streamflow, and nitrogen and phosphorus constituents. Genetic Algorithm is an useful optimization tool in assessing costeffective allocation of conservation practices for pollution reductions. Conservation practices selected by algorithm for 15% nitrate reduction also reduces phosphorus automatically by more than 50% for Raccoon River Watershed. GA in combination with SWAT is very useful in providing a frontier of cost-effective allocations of selected conservation practices for improved water quality.
36 Thank You!
37
38
39
40 Convert all perennial grasslands to corn-corn Area converted km 2 (% of wat.) Nitrate loading (Tons) % Change Baseline - 23,501 - Convert only CRP to corn-corn 192 (2%) 24, Convert all grasslands (CRP, Alfa, Brom, Pasture) to corn- corn 1682 (18%) 26,
41 Convert row crops to CRP grasslands
42 Decrease N fertilization rates on corn ground
43 Remove all point sources Baseline Remove all human waste sources (septic and WWTPs) Remove all cattles from the streams Nitrate loading (Tons) 23,501 21,692 23,489 % Change
44 Change livestock patterns in the watershed Baseline Remove all pastured cattle (no grazing) Remove cattle from feedlots Remove CAFOs Remove all livestocks Nitrate loading (Tons) 23,501 23,413 22,944 18,535 17,888 % Change
45 Conclusions SWAT modeling framework is set up for the Raccoon River Watershed with detailed land management information. Raccoon SWAT setup is calibrated and validated for watershed hydrology, streamflow, and nitrogen and phosphorus constituents. Converting all grasslands to continuous corn may increase nitrate loadings by 12%. Converting all croplands to grasslands may reduce nitrate loadings by more than 80%. Point sources pollutants are responsible for around 8% of nitrate loadings. Total livestock manure including CAFOs and feedlots are responsible for around 24% of the total nitrate loadings.
46 Future Direction Validate the Raccoon SWAT modeling setup at several locations within the watershed. Develop more management scenarios for better understanding of the watershed response to various possible situations including different climatic conditions. Develop a Bacteria TMDL another parameter recognized significantly for the Raccoon River.