2015 The Coal Institute Spring Conference. Swati Daji, SVP Fuels and System Optimization
|
|
|
- Basil Anthony
- 5 years ago
- Views:
Transcription

1 2015 The Coal Institute Spring Conference Swati Daji, SVP Fuels and System Optimization
2 CAUTION REGARDING PRESENTATION INFORMATION AND FORWARD-LOOKING STATEMENTS Duke Energy, its subsidiaries and affiliates, and employees (Duke Energy) make no representation as to the accuracy or completeness of the information contained herein or otherwise provided and accepts no responsibility or liability, in contract, in tort, or otherwise, should the information be found to be inaccurate or incomplete in any respect. In addition, to the extent this presentation includes historical information, forward-looking statements, estimates, illustrations and projections, Duke Energy does not and can not guarantee any the accuracy of the historical information and future results will occur as illustrated or presented. Duke Energy assumes no obligation to publicly update or revise forward-looking statements, information or illustrations made in this presentation, whether as a result of updated or new information, future events, or otherwise. Also, Duke Energy is not acting as an advisor to the recipient of this information and explicitly informs the recipient that information contained in this presentation should not be relied on for any decisions or any other purpose. 2
 1/3 Residential, 1/3 Commercial, 1/3 Industrial 3")
3 Duke Energy at a Glance Largest US Utility Operating in six jurisdiction with fuel mix diversity Total assets: ~$120 billion Market capitalization: ~ $55 billion (April 2015) U.S. generation capacity: ~ 50 GW (owned MW) Electric customers: 20-25M customers; 7.3 million meters Balanced customer mix (MWh sales) 1/3 Residential, 1/3 Commercial, 1/3 Industrial 3


")


4 Generation Portfolio Mix % 36% 3% 55% Fuel diversity (MWh output)(1) % 24% 38% 35% Coal Nuclear Natural Gas Oil Hydro Emission Reductions SO 2 NOx CO 2 92% 79% 27% (1) 2005 represents pro-forma regulated generation combining Duke Energy and Progress Energy. Crystal River 3 excluded from Diversity and environmental readiness are keys to positioning the fleet
5 Preserving Coal Option - Modernizing our Fleet Build Invested $9 billion in the last decade in building some of cleanest natural gas and coal plants possible today, increasing flexibility and reducing emissions Invested approximately $3 billion in commercial wind and solar since 2007 Pursuing new nuclear options for additional carbon-free capacity Retire Targeting retirement of 6,800 MW of older coal and large oil-fired capacity (4,800 MW retired to date) Number of coal fired units may shrink from 88 to 42. Retrofit Invested more than $7.5 billion in air emissions control technologies since Increasing fuel flexibility of remaining coal fleet Expect to spend $5-$6 billion in next 10 years to comply with new regulations.
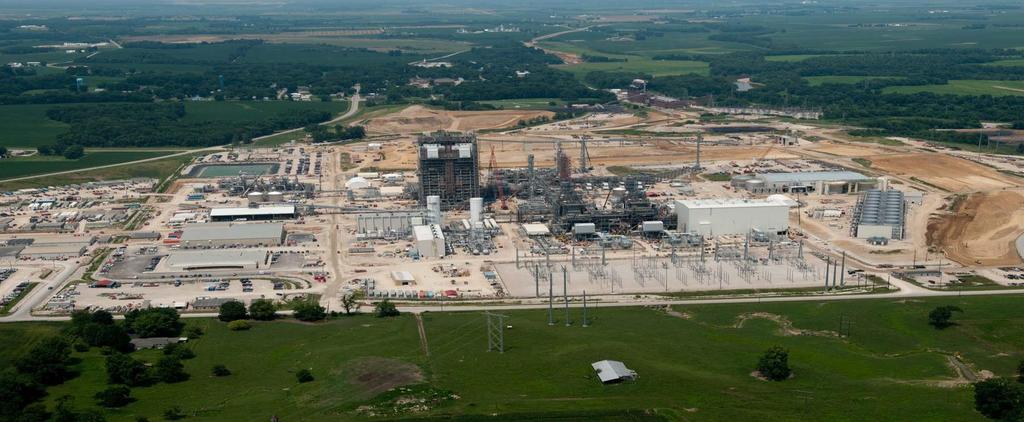
6 Edwardsport IGCC
7 Why Edwardsport IGCC? World s cleanest technology for coal-fired plants Significantly less environmental impact than the much smaller plant it replaced Generates marketable byproducts-- sulfur and slag for agricultural and construction materials. Uses dramatically less water. Carbon emission rate more than 40 percent lower than units it replaced First major new power plant built in Indiana in more than 20 years. Key to modernizing the state s aging electric system 7
8 Challenges for Coal Generation Gas Price Transport Challenges Environmental Compliance Coal Industry Health Anemic Load Growth Coal Generation Renewable Generation 8
9 Annual U.S. Domestic Supply (Trillion cubic feet) 2006 View of Future of U.S. Natural Gas Supply Alaskan Production 22 LNG Imports 20 Net Pipeline Imports 18 Unconventional Production Base Domestic Production


10 trillion cubic feet U.S. Natural Gas Production Shale Gas Becomes the Future of U.S. Natural Gas Supply U.S. dry natural gas production billion cubic feet per day projections Shale gas In 2000 shale gas was 1% of U.S. production; by 2012 it was 40%. EIA predicts that by 2040, 53% of the U.S. natural gas supply will come from shale gas. EIA projects a 56% increase in total natural gas production from 2012 to Non-associated onshore Non-associated offshore Tight gas Associated with oil Coalbed methane Alaska Source: EIA, Annual Energy Outlook 2014
11 Aug-08 Nov-08 Feb-09 May-09 Aug-09 Nov-09 Feb-10 May-10 Aug-10 Nov-10 Feb-11 May-11 Aug-11 Nov-11 Feb-12 May-12 Aug-12 Nov-12 Feb-13 May-13 Aug-13 Nov-13 Feb-14 May-14 Aug-14 Nov-14 Feb-15 May-15 Aug-15 Nov-15 Feb-16 May-16 Aug-16 Nov-16 Feb-17 May-17 Aug-17 Nov-17 Feb-18 May-18 Aug-18 Nov-18 Feb-19 May-19 Aug-19 Nov-19 NYMEX Price Per MMBtu Trends in Forward Natural Gas Prices $15.25 $14.25 $13.25 $12.25 $11.25 $10.25 $9.25 $8.25 $7.25 $6.25 $5.25 $4.25 $3.25 $2.25 Current (3/23/2015) July 2014 July 2013 July 2012 July 2011 July 2010 July 2009 July 2008 Forward natural gas prices have declined significantly and recently have traded at contractual lows
 Harrison Co.")
 Johnston Co. (2) Cumberland Co.")
12 Atlantic Coast Pipeline (ACP) Overview Project Highlights: ~540 mile FERC regulated pipeline extending from Marcellus and Utica shale to VA and NC Initial pipeline capacity of 1.5 Bcf/day with potential future expansion to 2 Bcf/day Additional access to Dominion South Pool and various Dominion receipt points via DTI Supply Header Project (SHP) Harrison Co., WV Project Facilities: 42-inch diameter in West Virginia and Virginia 36-inch diameter in North Carolina 20-inch diameter lateral extension from Virginia-North Carolina boarder to Hampton Roads Three gas-fired compressor station locations Primary Duke/Piedmont Delivery Points: Transco Zone 5 north of CS 165 Into Piedmont in NC (1) Johnston Co. (2) Cumberland Co. (3) Robeson Co. Robeson Co., NC 12


13 Renewable Generation pairs well with cycling units Residential Customer Summer Profile (4kW) Residential Customer Winter Profile (4kW)


 Plans will vary based")


 Classification TBD High Priority (1) Costs")
14 Emerging issues - Coal ash management Basin Closure Activities Filed excavation plans for four high-priority sites, as required by Coal Ash Management Act and one site in SC Project ~$1.3 billion over the next five years to close these five ash basins Recognized ~$3.5 billion Asset Retirement Obligation (ARO) for coal ash basin closure in the Carolinas Next Steps Final risk classifications will inform ultimate closure method and cost at other ten sites in North Carolina Developing comprehensive solutions at our remaining sites outside of North Carolina (34 ash basins) Plans will vary based upon site-specific factors Plans will be informed by final EPA rule Coal Ash Management Act of 2014 North Carolina law enacted in September 2014 Requires North Carolina ash basins to be closed over a 5-15 year period based on NC DENR s risk classifications Establishes a Coal Ash Management Commission to approve closure methods and oversee implementation NCUC continues to regulate cost recovery (1) 14 Sites in North Carolina (32 ash basins) Classification TBD High Priority (1) Costs related to the Dan River discharge clean-up activities (~$25 million) will be borne by the company
15 Summary Utility Industry is at stage of transformation Fuel diversity is essential - Coal continues to be part of the portfolio Coal generation is challenged by low gas prices Environmental compliance issues making coal less viable option Coal burn volatility challenges inventory management & transportation Macro issues Financial health of coal industry is concerning Emerging issues Coal ash regulation; Carbon regulations; Renewables as part of the portfolio What will help- Lower costs commodity as well as transport Flexibility in contracts Open dialogue on strategies
16 Questions? 16