India s Biofuel Strategy: Global Dimensions David Roland-Holst, UC Berkeley Herath Gunatilake and Guntur Sugiyarto, ADB Jenn Baka, Yale
|
|
|
- Aubrie Gardner
- 5 years ago
- Views:
Transcription

1 India s Biofuel Strategy: Global Dimensions David Roland-Holst, UC Berkeley Herath Gunatilake and Guntur Sugiyarto, ADB Jenn Baka, Yale 27 September 2010 Roland-Holst 1
2 Outline 1. Competing Narratives on Fuel and Food 2. Energy Trends 3. Food Trends 4. Scenarios for India 27 September 2010 Roland-Holst 2
3 Competing Narratives Energy and food are both essential commodities, but they are subject to different policy narratives: Ø Global energy demand trends are seen as and unsustainable byproduct of affluence Ø Food demand is seen primarily in terms of security for the poor Ø Biofuel presents the two as competitors for agricultural resources, particularly from a North-South perspective Ø Our research, however, suggests that emerging markets will be the catalyst accelerating both demand trends over the next generation Ø Moreover, it will be neither the rich nor poor who drive this process, but a global middle class 27 September 2010 Roland-Holst 3
4 Energy and Affluence Per capita income and energy use for 118 countries. USA Other OECD Japan India China Source: Authors' estimates from International Energy Agency and World Bank data. Bubble diameter is proportional to population 27 September 2010 Roland-Holst 4
5 Food and Vulnerability Food income shares for 118 countries. 50% of World Population 80% Source: Authors' estimates, from national data sources. 27 September 2010 Roland-Holst 5
6 Food Vulnerability is Greater than Energy Vulnerability Food/Energy Expenditure Ratios for 77 countries. 1> 50% of World Population 80% Source: Authors' estimates, from national data sources. 27 September 2010 Roland-Holst 6

7 Energy Trends: Emerging Markets Ø The BRICS story from an energy perspective Ø The Goldman projections show aggregate growth Ø With GSPovertaking by September 2010 Roland-Holst 7


8 Global Energy Fuel Demand Business as Usual Global energy fuel use could rise 250% BRICS overtake in energy 20 years earlier than GS/GDP forecasts Source: Authors estimates. 27 September 2010 Roland-Holst 8

9 Demand emergence Sentinel Durable Goods: Linear Growth of Average Income Induces Exponential Growth of New Demand Income Consumption Milestones: Bicycle Scooter Auto 27 September 2010 Roland-Holst 9
10 China and India in a Global Context (monthly household income per capita, 1993PPP$) Source: Authors' estimates for ADB, from national data sources. 27 September 2010 Roland-Holst 10
11 Whither Energy Prices? Fuel Composition of New Energy Demand Source: IEA 27 September 2010 Roland-Holst 11

12 Global Primary Energy Demand Source: IEA 27 September 2010 Roland-Holst 12
13 Rising Import Dependence Average Annual Net Imports, Oil and Gas Source: IEA 27 September 2010 Roland-Holst 13

14 Increasing Monopoly Power Oil Production by Source Source: IEA 27 September 2010 Roland-Holst 14


15 Food Demand: Differing Perspectives on Asia 27 September 2010 Roland-Holst 15


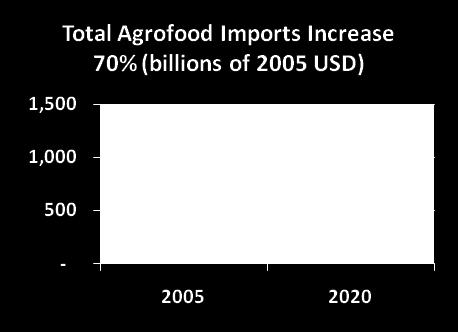
16 Asian Regional AgroFood Imports 27 September 2010 Roland-Holst 16

17 Global Agrofood Demand Green revolution productivity trend. BRIC agrofood demand rises six-fold in 25 years. Source: Authors' estimates. 27 September 2010 Roland-Holst 17


18 Meat: Another sentinel product Pork and Poultry Million metric tons Source: USDA. 27 September 2010 Roland-Holst 18
19 All Asia Pork and Poultry Clearly, the impact of any imbalance in China s meat economy will fall primarily on the price system. Million metric tons India Thailand Bangladesh Pakistan Indonesia Malaysia Philippines China September 2010 Roland-Holst 19 Source: USDA.

20 China s Soy Demand Source: USDA. 27 September 2010 Roland-Holst 20
 Source: USDA/ERS.")
21 Trade: China s Soy Tsunami Net trade in soy products (Million MT) Source: USDA/ERS. 27 September 2010 Roland-Holst 21
22 Scenarios for Energy and Food Security Baseline: Reference case, global oil and gas prices constant. S1: Global oil and gas prices rise 50% over the period S2: Scenario 1 with biodiesel and ethanol standards (USA, EUR, IND) S3: Scenario 2 with 1 percent annual energy efficiency gains. S4: Scenario 3 with 1 percent agrofood productivity growth. 27 September 2010 Roland-Holst 22
23 Macroeconomic Results S1 S2 S3 S4 S5 Real GDP - 4.8% 1.1% 1.3% 0.9% 2.9% Real Cons - 6.6% 2.1% 2.4% 3.4% 6.2% Exports - 4.1% - 0.9% - 1.0% 2.4% 1.3% Imports - 9.3% 0.0% - 0.1% 2.7% 3.2% Agfood Imports - 8.3% 2.3% 3.0% 9.5% % Energy Imports % % % % % GDPPC_PPP - 4.1% - 0.9% - 0.9% 1.3% 5.1% CPI 3.0% 0.7% 0.8% 4.6% 1.7% Food CPI - 2.6% 0.4% 0.6% 1.9% % Energy CPI 48.6% 5.4% 5.8% - 9.0% 0.4% Real HH Income - 4.7% 0.9% 1.1% 2.3% 4.2% Real Wages - 5.9% 0.4% 0.7% 3.7% 7.9% GHG Emissions % - 6.7% - 7.5% % % % Change from 2030 Baseline % Change from S1 27 September 2010 Roland-Holst 23
24 Conclusions: Food or Energy Security? For countries like India, who have low income majorities and are price takers in global energy markets, food price risk is more important than energy price risk two different policy approaches apply Countries with significant domestic biofuel potential can consider supply side solutions to energy needs Others should consider demand side solutions rather than diverting agrofood potential to energy production For the latter group, priority should be given to offsetting livelihood risk from food prices, promoting agrofood productivity to reduce food costs and, indirectly, any adverse real income effect from higher energy prices. 27 September 2010 Roland-Holst 24 24

25 Thank you 27 September 2010 Roland-Holst 25
26 B-GTAP A new global database including: Ø GTAP-7 complete, 113 countries, 57 sectors Ø Energy disaggregation 13 sources Ø Emissions data 14 categories Ø Income distribution deciles Ø Demographic data population by age (young, working, retired) 27 September 2010 Roland-Holst 26
27 Energy Disaggregation 1. Coal 2. Oil 3. Gas 4. Biodiesel 5. Ethanol1 - Sugar based 6. Ethanol2 - Starch based 7. Nuclear 8. Hydro 9. Biomass and Waste 10. Wind 11. Geothermal 12. Solar 13. Tide and Wave 27 September 2010 Roland-Holst 27
28 Emission Categories Air Pollutants 1. Carbon Dioxide CO2 2. Suspended particulates PART 3. Sulfur dioxide SO2 4. Nitrogen dioxide NO2 5. Volatile organic compounds VOC 6. Carbon monoxide CO 7. Toxic air index TOXAIR 8. Biological air index BIOAIR Water Pollutants 9. Biochemical oxygen demand BOD 10. Total suspended solids TSS 11. Toxic water index TOXWAT 12. Biological water index BIOWAT Land Pollutants 13. Toxic land index TOXSOL 14. Biological land index BIOSOL 27 September 2010 Roland-Holst 28
29 Emission Paths for OECD and non- OECD 27 September 2010 Roland-Holst 29