Contemplations about the future of natural gas: the good, the bad and the ugly
|
|
|
- Anastasia Atkinson
- 5 years ago
- Views:
Transcription
1 Contemplations about the future of natural gas: the good, the bad and the ugly Charles F. Mason H.A. True Chair in Petroleum and Natural Gas Economics Department of Economics Associate Dean, College of Business University of Wyoming Laramie, Wyoming December 13, 2017
2 36 Our Economics Team The View Today Coal Natural Gas Crude Oil and NGPL a 5 Total US Energy Production (Quadrillion BTU) Renewable Energy Nuclear Electric Power By Source, Monthly 2.5 Natural Gas Crude Oil and NGPL a Coal 1.0 Renewable Energy 0.5 Nuclear Electric Power 0.0 J F M A M J J A S O N D J F M A M J J A S O N D J F M A M J J A S O N D Total, January August By Source, August source: EIA Natural Gas Crude Oil and NGPL a 2.059


 Global NG imports,")


3 Emerging Global NG Demand and LNG emergence of global NG trade gating pockets of growth 6F /Yr. Gas plant orders (select countries) Avg. GW/y China 3,600 kwh/capita U.S.A. 12,000 kwh/capita Saudi Arabia 9,300 kwh/capita Japan 7,400 kwh/capita Mexico 2,100 kwh/capita Indonesia 800 kwh/capita China US Saudi Japan Mexico Indonesia Avg. last 5 years Avg. next 5 years (forecast) Global NG imports, Trillion cubic feet year percent of Global NG consumption via imports Malaysia 4,400 kwh/capita Malaysia Global NG imports, Trillion cubic feet percent of Global NG consumption via imports World avg. = 3,000 kwh/capita he long-term positioned to win in short-term source: GE, EIA es of GT,ST and Hydro excludes oil recip. Engines, Storage and Industrial Mechanical Drive; 2016 data is still preliminary ECON 4430, C. Mason 16 Recent developments in Natural Gas Markets 20/

4 Bad Ugly Our Economics Team Variation invariability renewablesin Renewables Hourly solar energy, San Francisco Total Wind power energy demand production less renewables, (Trillion BTU) Twh Jul2001 Jan2014 Jan2015 Jan2009 Jan2016 Jan2017 Jul2016 month date source: EIA large large fluctuation with with renewables renewables over over hour hour period period over over course course of the of year implies need need for flexible for flexible power power supply supply to fill intogaps fill in gaps NG Ugly (Mason) Feria Destaca July, / 24
5 US natural gas production; monthly spot price Our Economics Team The Fracking Boom Billion cubic feet per month USD per thousand cubic feet - average per month Jan2000 Jan2005 Jan2010 Jan2015 Month Natural Gas Production Jan2000 Jan2005 Jan2010 Jan2015 Month Henry Hub Spot Price US Natural Gas production took off after 2007 led to steady decline in NG spot prices major driver in shift from Coal to Gas in electricity motivated push for LNG exports Good, Bad & Ugly (Mason) Feria Destaca November, / 26
6 US natural gas production; monthly spot price Our Economics Team The Fracking Boom Billion cubic feet per month USD per thousand cubic feet - average per month Jan2000 Jan2005 Jan2010 Jan2015 Month Natural Gas Production Jan2000 Jan2005 Jan2010 Jan2015 Month Henry Hub Spot Price US Natural Gas production took off after 2007 led to steady decline in NG spot prices major driver in shift from Coal to Gas in electricity motivated push for LNG exports Good, Bad & Ugly (Mason) Feria Destaca November, / 26 (how long) will this persist?

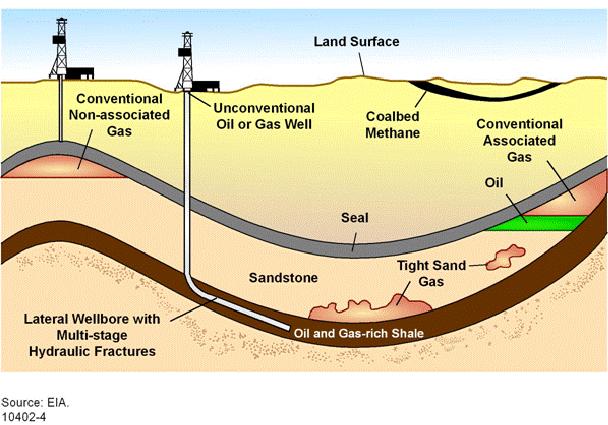


7 Fracking: A new approach to extraction Conventional/Unconventional Geology MSEEL - Microseismic Thomas Wilson - WVU
8 Natural gas production from major U.S. shale plays

9 Natural gas production: geography

10 WY NG distribution, basis effects pricing distortions when deliveries approach pipeline capacity
11 NG spot prices: Henry Hub vs. Dominion South difference between spot prices at Dominion South and Henry Hub

12 Pipeline Infrastructure in New England
13 Natural Gas Prices vs. Algonquin Pipeline Utilization MMBtu 400,000 Unused Capacity Algonquin Citygate Price $/MMBtu , , , /1/14 7/1/14 1/1/15 7/1/15 0 Despite high prices, the Algonquin pipeline was often not fully utilized during the winters of and
14 Natural Gas Prices vs. Algonquin Pipeline Utilization MMBtu 400,000 Unused Capacity Algonquin Citygate Price $/MMBtu , , , /1/14 7/1/14 1/1/15 7/1/15 0 Aggregating the same data by week more clearly shows levels. On average, 78,000 MMBtu (roughly 7%) of the pipeline s capacity goes unused on days when the price of natural gas exceeds $10/MMBtu.
15 Patterns in average production per-well monthly production in MMcf month pre Natural gas production subject to decline curve effects production rate falls off rapidly during first several months suggests need for rolling frontier of new wells
16 Aggregate production and the number of wells quantity gas, million Mcf number of operating wells Jul1992 Jul1999 Jul2006 Jul2013 month quantity gas, million Mcf number of operating wells
17 Drilling Rig Counts: US and Marcellus Gas Drilling Rigs in the US Gas Drilling Rigs in the Marcellus 1Jan2010 1Jan2012 1Jan2014 1Jan2016 Date Gas Drilling Rigs in the US Gas Drilling Rigs in the Marcellus
18 Stocks / Refinery receipts Jan1985 Jan1990 Jan1995 Jan2000 Jan2005 Jan2010 Jan2015 Date
19 NG Stocks / Consumption Jan2000 Jan2005 Jan2010 Jan2015 Date
20 WTI crude price return Jul1997 1Jan2002 1Jul2006 1Jan2011 1Jul2015 Date
21 Henry Hub NG price return Jul1997 1Jan2002 1Jul2006 1Jan2011 1Jul2015 Date

22 Barnett 80,000 >150,000 Haynesville 110,000 >200,000 Marcellus 120,000 >280,000 Source: Acharya, H.A., Henderson, C., Matis, H., Kommepalli, H., Moore, B., Wang, H., 2011, Cost Effective Water concerns? Recovery of Low-TDS Frac Flowback Water for Re-use, U.S. Department of Energy: DE-FE Final Report. Notes: TDS is total dissolved solids. PPM is parts per million (for reference, 10,000 ppm is equivalent to 1%). In this Department of Energy report, the authors refer to all returning water after hydraulic fracturing as flowback, and do not differentiate between fracking fluid flowback and produced water. Figure 6. Photograph of Flowback Water, Treated Flowback Water Ready for Reuse, and Produced Water Source: Earth and Mineral Sciences Energy Institute, Pennsylvania State University.

23 Environmental concerns?

24 What s in the Secret Sauce? Source: Columbus Dispatch