February 2018 NYSE:CRK
|
|
|
- Mavis Hubbard
- 5 years ago
- Views:
Transcription


1 February 2018 NYSE:CRK
2 This presentation includes forward-looking statements within the meaning of Section 27A of the Securities Act of 1933 and Section 21E of the Securities Exchange Act of Forward-looking statements give our current expectations or forecasts of future events. These statements include estimates of future natural gas and oil reserves, expected natural gas and oil production and future expenses, assumptions regarding future natural gas and oil prices, budgeted capital expenditures and other anticipated cash outflows, as well as statements concerning anticipated cash flow and liquidity, business strategy and other plans and objectives for future operations. Our production forecasts are dependent upon many assumptions, including estimates of production decline rates from existing wells and the outcome of future drilling activity. Important factors that could cause actual results to differ materially from those in the forward-looking statements herein include the timing and extent of changes in market prices for oil and gas, operating risks, liquidity risks, including risks relating to our debt, political and regulatory developments and legislation, and other risk factors and known trends and uncertainties as described in our Annual Report on Form 10-K for fiscal year 2016 filed with the Securities and Exchange Commission. Should one or more of these risks or uncertainties occur, or should underlying assumptions prove incorrect, our actual results and plans could differ materially from those expressed in the forward-looking statements. 2
3 Investment Considerations Comstock s high return Haynesville Shale assets provide opportunity for strong growth in 2017 Comstock s enhanced completion design has transformed the Haynesville shale into one of North America s highest return natural gas basins Comstock s acreage position provides a strong foundation with over 800 locations, underpinning the Company s future growth Strong natural gas production growth to be driven by our Haynesville and Bossier shale drilling program funded with operating cash flow Natural gas production grew 46% in 2017 high return Haynesville Shale projects (Pro Forma for 2016 divestitures) 2018 drilling program will create ~30% growth in Comstock s already low cost structure is expected to improve with new low cost Haynesville shale production Operating costs per Mcfe in the 3 rd quarter have decreased by 34% and DD&A per Mcfe is down 35% in 2017 Balance sheet improving Potential sale of Eagle Ford shale assets combined with growth in EBITDAX should allow refinancing of secured debt in early 2018 Liquidity of $150 million adequate to support 2018 drilling program 3


4 Major Properties Other Proved Reserves 4 Bcfe Wells 246 E. Texas / N. Louisiana Proved Reserves 1,105 Bcfe Wells 872 Company Overview Proved Reserves- 1.2 Tcfe 41% - proved developed 4% - oil 96% - gas 98% - operated South Texas Proved Reserves 53 Bcfe Wells 191 4


 shale")


5 East Texas / North Louisiana Region Own interests in 872 producing wells in 23 fields ~ 68,000 net acres with Lower Haynesville shale development potential ~ 47,000 net acres with Upper Haynesville (Bossier) shale development potential Horizontal Cotton Valley development potential Waskom Blocker Beckville Douglass Darco Texas East Texas / North LA Reserves: 1,105 Bcfe Longwood Mansfield Drew Logansport South Toledo Bend North Toledo Bend Louisiana 5
 wells in 2017 Drilling 31 (12.")

6 Comstock s Acreage Haynesville Shale Cotton Valley Cotton Valley Bossier Shale Drilled 29 (15.7 net) wells in 2017 Drilling 31 (12.4 net) wells in 2018 Haynesville/Bossier Shale Net Acres 68,000* Resource Potential Average WI Average NRI 6 + Tcf 78.7% 80.5% *47,000 net acres prospective for the Bossier shale 6
7 Haynesville Shale Program Applying newest drilling and completion technologies to an established world class asset Extended laterals Larger stimulation treatment Strong rates of return with higher EURs Haynesville shale wells have high rates of return at current natural gas prices Premium gas market Comstock has competitive marketing arrangements and close proximity to Henry Hub Extensive inventory of drilling opportunities (82% Operated) Haynesville 4,500 ft ,500 ft ,000 ft Bossier 4,500 ft ,500 ft ,000 ft Cotton Valley 285 Extensive inventory of re-frac opportunities 115 older vintage Haynesville/Bossier shale wells Strong results from recent industry activity 7
 -89 N.")


 Based on Platt's")
 Based")
8 Regional Natural Gas Price Advantage North East Pipelines (2) -89 N. Louisiana Pipelines (1) -12 Henry Hub Exports to Mexico +3.5 Bcf/d by 2020 LNG Exports +8.5 Bcf/d by 2020 Gulf Coast Industrial Demand +5.5 Bcf/d by 2020 (1) Based on Platt's monthly price guide LTM average basis for Columbia Gulf Mainline (2) Based on Platt's monthly price guide LTM average basis for Dominion South 8
9 Gen II Haynesville Completion New completion design increases the total stages for a 7,500 lateral from 30 at 250 feet apart to 50 at 150 feet apart Total clusters increase from 150 to 250 Sand loading increases from 2,800 pounds per foot to 3,800 pounds per foot Total sand per well increases from 21 million pounds to 28.5 million pounds Gen I 3 Stages = 750 feet Stages = 750 feet Gen II 30 9

10 IP (MMcf/day) per 1,000 feet of lateral length Gen II vs. Gen I Results 32% higher IP rate per 1,000 completed lateral foot Gen I (2,800 lbs. per ft.) Gen II (3,800 lbs. per ft.) 13 wells 15 wells 10


11 Haynesville Shale Wells Holmes MMcf/d Gamble MMcf/d Headrick #1 33 MMcf/d Harrison MMcf/d Headrick #2 37 MMcf/d Holmes MMcf/d Headrick #1 26 MMcf/d Harrison MMcf/d Pace MMcf/d Headrick #2 35 MMcf/d Boggess MMcf/d Shahan MMcf/d Ramsey MMcf/d Pyle MMcf/d Nash #2 25 MMcf/d Nash #1 26 MMcf/d Ramsey MMcf/d Billingsley MMcf/d Pace MMcf/d Horn MMcf/d Caraway MMcf/d Claybrook MMcf/d Powell MMcf/d Halsey MMcf/d Furlow MMcf/d Grantham MMcf/d DeSoto Parish, Louisiana Furlow MMcf/d GEN 1 GEN 2 Jordan MMcf/d 11


12 Haynesville Shale Wells IP rate per 1,000 feet of completed lateral Holmes MMcf/d Gamble MMcf/d Headrick #1 5.3 MMcf/d Harrison MMcf/d Headrick #2 4.6 MMcf/d Holmes MMcf/d Headrick #1 3.5 MMcf/d Harrison MMcf/d Pace MMcf/d Headrick #2 4.6 MMcf/d Boggess MMcf/d Shahan MMcf/d Ramsey MMcf/d Pyle MMcf/d Nash #2 4.6 MMcf/d Nash #1 4.9 MMcf/d Ramsey MMcf/d Billingsley MMcf/d Pace MMcf/d Horn MMcf/d Caraway MMcf/d Claybrook MMcf/d Powell MMcf/d Halsey MMcf/d Furlow MMcf/d Grantham MMcf/d DeSoto Parish, Louisiana Furlow MMcf/d GEN 1 GEN 2 Jordan MMcf/d 12
13 MMcf per day Haynesville/Bossier Wells 30 Wells exceeding expectations Gen 1 Curve (7,500 ft. lateral) Gen I HV Wells (Average of 12 wells) Bossier Shale Well Gen II HV Wells (Average of 8 wells) 15 Short Lateral Wells (Average of 6 wells) Type Curve Days on production 13
14 MMcf/1,000 ft. of completed lateral per day Haynesville/Bossier Wells per 1,000 feet of completed lateral 4 Type Curve 3 Gen I HV Wells (Average of 12 wells) - 7,194 ft. Bossier Shale Well - 7,430 ft. 2 Gen II HV Wells (Average of 14 wells) - 6,454 ft. 1 0 Type Curve Days on production 14
 $6.8 $10.3 $12.7 24 Hr. IP (Mmcf per day) 17 22 26 Decline B Factor 0.99 0.99 0.99 Initial Decline (%) 72 65 61 $30 Proppant (Pounds per lateral ft.) 3,800 3,800 3,800 $28 EUR (Bcf) $26 11.")
15 % ROR (in millions) (in millions) Haynesville Well Economics 160% 140% 120% 100% 80% 60% 40% 20% 0% Gen 2 Completion Design - 4,500' L 7,500' L 10,000' L Estimated Well Costs ($ millions) $6.8 $10.3 $ Hr. IP (Mmcf per day) Decline B Factor Initial Decline (%) $30 Proppant (Pounds per lateral ft.) 3,800 3,800 3,800 $28 EUR (Bcf) $ $24 $22 Rate of Return $20 $18 $16 $14 $12 $10 $8 $6 $4 $2 $0 (%) $2.00 $2.50 $3.00 $3.50 $4.00 $/MCF $30 $28 $26 $24 $22 $20 $18 $16 $14 $12 $10 $8 $6 $4 $2 $0 4,500 ft. 7,500 ft. 10,000 ft $2.00 $2.50 $3.00 $3.50 $4.00 $/MCF 4,500 ft. 7,500 ft. 10,000 ft. Net Present Value at 10% (Million $) $2.00 $2.50 $3.00 $3.50 $4.00 $/MCF 15 4,500 ft. 7,500 ft. 10,000 ft.


16 Haynesville Shale JV Partnered with USG to jointly develop certain Haynesville/Bossier acreage Caddo Parish acreage is owned by USG and Comstock participates for 25% (Increasing to 40% in mid 2018) Harrison and Panola acreage is owned by Comstock, USG pays $1.1 million per well for 50% interest USG is participating in 4 Bossier shale wells and is paying $1.4 million per well for 50% interest Comstock is also paid $80K per well for managing drilling program in addition to customary operating fees (except for 4 Bossier wells) Harrison County, TX 34 Haynesville locations 5,700 acres Panola County, TX 4 Bossier Shale wells / 800 acres Caddo Parish, LA 34 Haynesville locations 7,000 acres DeSoto Parish, LA 16

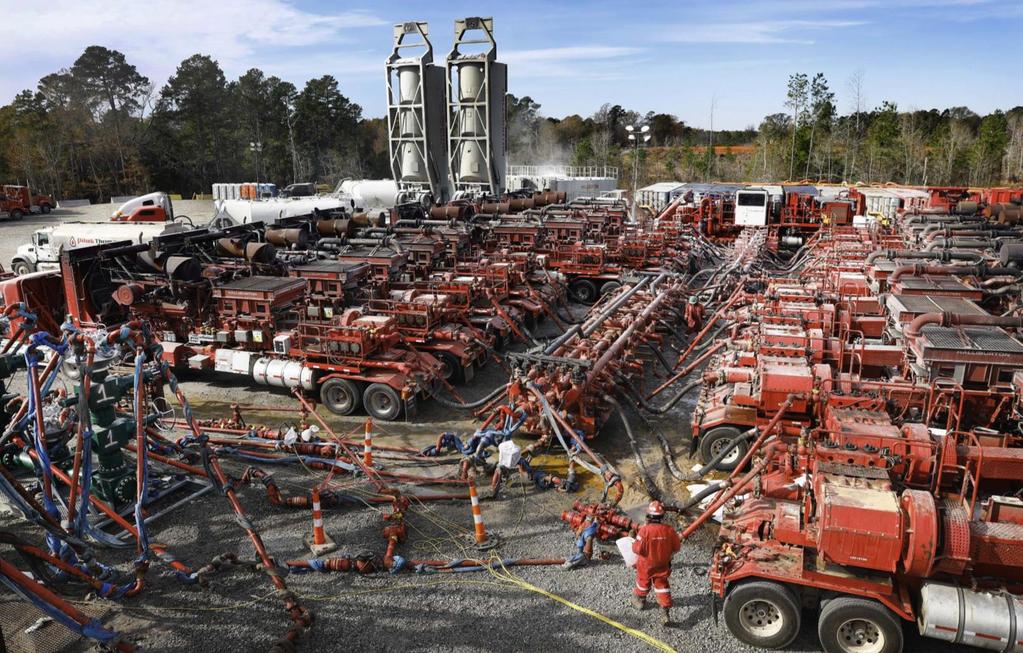
17 Completing a two well pad on the JV Acreage in Caddo Parish 17
18 Proved Oil and Gas Reserves Comstock achieved an all-in finding cost of 54 per Mcfe in 2017 Oil MBbls Gas Bcf Total Bcfe Proved Reserves as of 12/31/16 7, Production (951) (73.5) (79.2) Divestitures (7) (7.6) (7.6) Price Related Revisions* 1, Additions Proved Reserves as of 12/31/17 7,552 1, ,162.3 *SEC Prices YE16- $37.62/Bbl and $2.29/Mcf YE17- $48.71/Bbl and $2.88/Mcf 18

19 2017 Drilling Program ($ in millions) 4th Quarter Gross WI Net Gross WI Net Actual Wells Wells Budget Wells Wells East Tex./North La.: Haynesville Shale $ $ Bossier Shale Leases Other Total Capital Expenditures $ $ Capital Expenditures $179 Net Wells Drilled $


 15.9 Other 3.")
20 2018 Drilling Program ($ in millions) Capital Expenditures $179 $ Net Wells Drilled Gross WI Net $ Wells Wells Haynesville/Bossier Shale: Drilling and Completion $ Completion of 2017 Wells 17.5 ReFracs (5) 15.9 Other 3.8 Total Capital Expenditures $ Lateral Lengths: 5, , ,
 2016 53.")
21 Natural Gas Production (MMcf / day) natural gas production is estimated to average between 250 to 270 MMcf per day Q 2Q 3Q 4Q 1Q 2Q 3Q 4Q 1Q 2Q 3Q 4Q Bcf (+20%) Bcf (+13%) Bcf (+37%) Haynesville Cotton Valley South Texas Other Sold 21
22 Natural Gas Hedges Natural gas hedge positions to support Haynesville drilling program Volume (Mmbtu / day) NYMEX price (Per Mcf) (a) 2017 Q3 99,000 $ Q4 99,000 $ Q1 29,000 $3.38 (a) The index price for the natural gas contracts is based on the NYMEX-Henry Hub monthly future prices. 22


23 Improving Cost Structure (Per Mcfe) $1.48 OPERATING COSTS $5.74 DD & A.20 $1.35 $ $ $0.97 $0.75 $ excluding Eagle Ford $1.27 excluding Eagle Ford Gathering Production Taxes Lifting $2.26 $1.90 $1.60 $ Q Q Q Q Q Q3 23
24 Balance Sheet ($ in millions) Sept 30, 2017 Cash and cash equivalents $ 25 Revolving Credit Facility - 10% Senior Secured Notes $ nd Lien Convertible Notes ( All Interest PIK) $ 452 Unsecured Senior Notes $ 26 Total Debt (at face amount) $ 1,175 Total Net Debt $ 1,150 Available Credit Line $ 50 Available Interest PIK $ 75 Total Liquidity $