Phase 2 Toxicity Workstream: Ammonia Toxicity-Testing Program in 1999 and 2000
|
|
|
- Gabriel Whitehead
- 5 years ago
- Views:
Transcription

1 City of Winnipeg Water and Waste Department PHASE 2 Technical Memorandum for Red and Assiniboine Ammonia Criteria Study Technical Memorandum # T1.0 Phase 2 Toxicity Workstream: Ammonia Toxicity-Testing Program in 1999 and 2000 March, A Internal Document by: In Association With: North / South Consultants
2 Technical Memorandum No. T1.0 Toxicity-Testing Workstream i DRAFT 18/04/01 8:12 AM ACKNOWLEDGEMENTS The study team acknowledges the assistance of the City of Winnipeg Project Management Committee and Ammonia Study Workshop attendees. The study team also appreciates the assistance of personnel from the City of Winnipeg Water and Waste Department, NEWPCC facility, and the City Public Works Department. The following individuals and government personnel also provided appreciated assistance in some aspect of the study: Mr. Lorimer Thompson Ms. Shelly Matkowski Robert (Bob) Danelle Dr. Lyle Lockhart Mr. Robert Evans Dr. Lane Graham Mr. Ernie Watson Ms. Sara Brown Ms. Marilyn Harron Manitoba Department of Natural Resources Manitoba Department of Natural Resources Department of Fisheries and Oceans (DFO) Department of Fisheries and Oceans (DFO) Department of Fisheries and Oceans (DFO) University of Manitoba Masters Student, University of Manitoba Resident of Winnipeg, MB Resident of Starbuck, MB STUDY TEAM The contributors to this Technical Memorandum were: TetrES Consultants Inc.: Mr. G. Rempel, M.Sc., P. Eng. Mr. J.M. McKernan, M.Sc., M.E.S. Mr. D. Morgan, Ph.D., P. Eng. Ms. A. Partridge, B.Sc. Mr. D. Harron, B.Sc. Ms. K. Mathers, B.Sc., M.Sc. Ms. M. Gifford, M.Sc. Mr. R. Kula, B.A., B.Sc. Technical Advisors: Mr. Gordon Craig, M.Sc. Mr. Michael Salazar, B.Sc. Mrs. Sandra Salazar, M.Sc. Project Manager Principal Environmental Engineer Environmental Scientist Biologist Environmental Scientist Biologist Environmental Scientist Aquatic Ecotoxicologist, G.R. Craig & Associates Inc. Aquatic Toxicologist, Applied Biomonitoring Aquatic Toxicologist, Applied Biomonitoring This Technical Memorandum (T.M.) is one of a series of T.M.s intended for internal discussion. It is not intended as a report representing policy or direction of the City of Winnipeg. Third Party Disclaimer The Toxicity Technical Memorandum (T.M.) which is reported in the following pages has been prepared in response to a specific request for services from the City of Winnipeg (City) to whom it is addressed. The Toxicity T.M. is not intended for the use of, nor is it intended to be relied upon, by any person, firm or corporation other than the City of Winnipeg. TetrES Consultants Inc. denies any liability whatsoever to other parties who may obtain access to this T.M. for damages or injury suffered by such third parties arising from use of this T.M. by them without the express prior written authority of TetrES Consultants Inc. and the City, who have commissioned this T.M.
3 Technical Memorandum No. T1.0 Toxicity-Testing Workstream ii TABLE OF CONTENTS DRAFT 18/04/01 8:12 AM 1. INTRODUCTION AMMONIA TOXICITY TOXICITY AND RISK ASSESSMENT OF CHEMICAL MIXTURES Theoretical Considerations Approach in This Study TEST-PROGRAM OBJECTIVE RATIONALE FOR TOXICITY TESTING PROGRAM LINKAGE TO INTEGRATION WORKSTREAM DESIGN OF TOXICITY-TESTING PROGRAM ORIGINAL DESIGN PROGRAM EVOLUTION FINAL DESIGN FOR 1999 PROGRAM TESTING METHODS /2000 PROGRAM Fish Testing Acute-exposure Testing Chronic-Exposure Testing Bivalve Tests In situ Test Laboratory Test Other Invertebrate Testing Ceriodaphnia dubia Hyalella azteca RESULTS FISH TESTING Acute-exposure Chronic-exposure BIVALVE TESTING In situ, Chronic-exposure Tests...4-5
4 Technical Memorandum No. T1.0 Toxicity-Testing Workstream iii DRAFT 18/04/01 8:12 AM Verifying Plume Exposure in Mussels Laboratory, Chronic-exposure Tests Other Invertebrate Testing Ceriodaphnia dubia Hyalella azteca DISCUSSION SUMMARY AND CONCLUSIONS REFERENCES LITERATURE CITED...7-1
5 Technical Memorandum No. T1.0 Toxicity-Testing Workstream LIST OF APPENDICES iv DRAFT 18/04/01 8:12 AM APPENDIX A - APPENDIX B - APPENDIX C - APPENDIX D - APPENDIX E - APPENDIX E-1 AQUATIC TOXICITY-TEST CONDITIONS LIVE FISH COLLECTION AND HANDLING PERMITS PREPARATION OF TEST-SOLUTIONS FOR STATIC AND SEMI- STATIC TESTS CONDUCTED ON FISH NEWPCC LABORATORY RESULTS FOR DAILY TOTAL-AMMONIA- NITROGEN (NH 3 -N) CONCENTRATIONS AVERAGE NH 3 CONCENTRATIONS: CALCULATIONS AND RESULTS DATA USED TO CALCULATE NH 3 CONCENTRATIONS FOR ACUTE- EXPOSURE TESTS CONDUCTED ON FISH APPENDIX E-2 DATA USED TO CALCULATE NH 3 CONCENTRATIONS FOR CHRONIC-EXPOSURE TESTS CONDUCTED ON FISH APPENDIX E-3 APPENDIX F - APPENDIX F-1 APPENDIX F-2 APPENDIX F-3 APPENDIX G - APPENDIX H - APPENDIX I - APPENDIX J - APPENDIX K - DATA USED TO CALCULATE NH 3 CONCENTRATIONS FOR TESTS CONDUCTED ON CERIODAPHNIA DUBIA AND HYALELLA AZTECA STATISTICAL ANALYSES OF ALL TOXICITY-TESTS: EXPLANATION AND CALCULATIONS ACUTE-EXPOSURE TESTS CONDUCTED ON FISH: RAW DATA AND RESULTS CHRONIC-EXPOSURE TESTS CONDUCTED ON FISH: RAW DATA AND RESULTS TESTS CONDUCTED ON INVERTEBRATES: RAW DATA AND RESULTS CALCULATION OF FLOW RATES AND THE NH 4 CL-STOCK CONCENTRATION FOR FLOW-THROUGH TESTS COPY OF THE DRAFT FINAL REPORT FOR IN SITU CAGED MUSSEL STUDY PREPARED BY APPLIED BIOMONITORING (1999) COPY OF FINAL REPORTS FOR CERIODAPHNIA DUBIA TESTS PREPARED BY E.S.G. INTERNATIONAL SUMMARY OF TEST-ACCEPTABILITY CRITERIA FOR ACUTE AND CHRONIC-EXPOSURE TESTS CONDUCTED ON FISH LETHAL AND EFFECTIVE CONCENTRATIONS OF NH 3 FOR ALL ACUTE-EXPOSURE TESTS CONDUCTED ON FISH
6 Technical Memorandum No. T1.0 Toxicity-Testing Workstream v DRAFT 18/04/01 8:12 AM APPENDIX L - DISSOLVED OXYGEN CONCENTRATIONS LIST OF ILLUSTRATIONS LIST OF FIGURES Figure 1-1 Figure 1-2 Illustration of use of dose-response data to define effects zones, to assist definition of threshold concentrations of significant effects (i.e., EC n ) Relationship of CCME and Manitoba Approaches to Derivation of Water Quality Guidelines Figure 2-1 Ammonia Toxicity Workstream Overview Figure 2-2 Decision-Tree for Design of Toxicity Testing Program Figure 2-3 Ammonia Toxicity Test Program: 1999 and Figure 3-1 Test Chambers and Waterbaths used for Static and Semi-static Fish Toxicity Testing Figure 3-2 Static and Semi-Static Fish Toxicity Testing Facility at the NEWPCC Figure 3-3 Determining Ammonia Concentrations in Toxicity Test Water Samples Figure 3-4 Location of the continuous flow toxicity lab at the dewatering building, City of Winnipeg North End Water Pollution Control Center Figure 3-5 River water supply pump located on the Red river adjacent to The Bergen Cut-Off Figure 3-6 River water holding tank Figure 3-7 Figure 3-8 Water Distribution tower with the river water and ammonia distribution chambers Continuous flow toxicity laboratory within the Dewatering Building at NEWPCC Figure 3-9 Toxicity lab from another perspective Figure 3-10 Fish holding facilities continuously supplied with Red River water Figure 3-11 Schematic of Toxicity Lab Layout at NEWPCC Figure 3-12 Ammonia mixing chamber on water tower Figure 3-13 Ammonia NH 4 Cl stock container and dosing pump Figure 3-14 River water and ammonia swing arm diluters at the 0.5 mg/l Exposure table Figure 3-15 Top view of the river water and ammonia swing arm diluters Figure 3-16 Water in the test chamber is continuously renewed by water supplied through the distribution manifold Figure 3-17 Screening and Sorting Bivalves from the LaSalle River Figure 3-18 Facilities Used for Preparation of Bivalve Test Cages and sorting of Bivalves Figure 3-19 Measuring Bivalve Morphometric Parameters and Recording Data Figure 3-20 Preparing Strings of Mussels and Clams for in situ Test Cages Figure 3-21 Cage Construction for in situ Bivalve Test Figure 3-22 Caged Bivalve Deployment Configuration at NEWPCC Figure 3-23 Preparation for Deployment of Bivalve Stations Figure 3-24 Location of North End Plume and Mussel Sites Figure 3-25 Red River Flows at Lockport in 1999 During in situ Mussel Tests Figure 3-26 Re-measuring Mussels at Termination of Bivalve Tests
7 Technical Memorandum No. T1.0 Toxicity-Testing Workstream vi DRAFT 18/04/01 8:12 AM Figure 3-27 Laboratory Bivalve Test Set-Up Figure 4-1a Ratio of Coprostanol/Cholesterol in the Mussels Exposed to the NEWPCC Outfall Complete Dataset Figure 4-1b Ratio of Coprostanol/Cholesterol in the Mussels Exposed to the NEPCC Outfall with Outliers Removed LIST OF TABLES Table 1-1 Gaps in Available Sub-lethal Dataset Table 3-1 Ammonia Toxicity Tests Conducted During the 1999/2000 Program Table 3-2 Initial Bivalve Station Positions, July 14, Table 3-3 River Conditions and Theoretical Plume Centreline During in situ Mussel Tests Table 3-4 Water Chemistry Monitoring at Bivalve Placement Stations, July 20, Table 3-5 Water Chemistry Monitoring at Bivalve Placement Stations August 13, Table 3-6 Water Chemistry Monitoring at Bivalve Placement Stations, Sept 14, Table 3-7 Order of Bivalve Station at Termination of in situ Experiment Table 4-1 Lethal Concentrations of NH 3 for Test Populations of Fish After Acute-Exposure Table 4-2 Lethal and Effective Concentrations of NH 3 for Test Populations of Fish After Chronic-Exposure Table 4-3a Ratio of Coprostanol/Cholesterol in the Complete Mussel Dataset Exposed to the NEWPCC Effluent Table 4-3b Ratio of Coprostanol/Cholesterol in the Mussel Dataset Exposed to the NEWPCC Effluent with Outliers Removed Table 4-4 Lethal and Effective Concentrations of Treated Effluent for Test Populations of Bivalves After Chronic-Exposure Table 4-5 Lethal and Effective Concentrations of NH 3 for Test Populations of Ceriodaphnia dubia and Hyalella azteca Table 5-1 Comparison Between TetrES Results and Relevant Public-Domain Results for Selected Chronic-Exposure Tests Table 6-1 Summary of Tests to be Used Directly in Criteria Development LIST OF ACRYNOMS AND ABBREVIATIONS ACRM = Aquatic Community Risk Model ASTM = American Society for Testing and Materials BOT = beginning of test CAEAL = Canadian Association for Environmental Analytical Laboratories CEC = Clean Environment Commission CI = confidence interval cm = centimetre CoW = City of Winnipeg DFO = Department of Fisheries and Oceans D.O. = Dissolved Oxygen E = treated effluent from the NEWPCC EOT = end of test ERC = Ecological Risk Criterion
8 Technical Memorandum No. T1.0 Toxicity-Testing Workstream vii DRAFT 18/04/01 8:12 AM g = gram GPS = global positioning system HgCl 2 = mercuric chloride ICP = inhibitory concentration percent estimate ICPIN = inhibitory concentration percent estimate software program L = Litre ml = millilitre mg = milligram MSWQO = Manitoba Surface Water Quality Objectives N = Nitrogen NEWPCC = North End Water Pollution Control Centre NH 3 = unionized ammonia + NH 4 = ionized ammonia NH 3 -N = total ammonia nitrogen NH 4 Cl = ammonium chloride OECD = Organization for Economic Co-operation and Development PSL-2 = Priority Substance List - 2 RW = river water from the Red River SCC = Standards Council of Canada USEPA = United States Environmental Protection Agency WAWW = whole animal wet weight WERF = Water Environment Federation Research Foundation WPCC = Water Pollution Control Centre
9 Technical Memorandum No. T1.0 Toxicity-Testing Workstream viii GLOSSARY DRAFT 18/04/01 8:12 AM Acute-exposure a brief exposure to a stressor or the effects associated with such an exposure. It can refer to an instantaneous exposure (i.e., oral gauge) or continuous exposures, from minutes to a few days, depending on the life span of the organism a. For the present study, acute-exposure refers to a test-duration that is 96 hrs. Ammonium chloride NH 4 Cl; white granular powder with a moleculer weight of µ (reagent grade) was used in the present study as an ammonia (NH 3 ) source, when dissolved in de-ionized water. Bioassay a test used to evaluate the relative potency of a chemical by comparing its effect on living organisms with the effect of a control a. Control a treatment in a toxicity test or in a field study that duplicates all the conditions of the exposure treatments or test sites except that the control contains no test substance this determine the absence of toxicity under basic test conditions a. Chronic-exposure involving a stimulus that is lingering or continuous over a long period of time a. For the present study, chronic-exposure refers to a test duration >96 hours. Endpoint a biological response that can be measured and expressed quantitatively (e.g., endpoint growth expressed as a net change in length of a test organism). Flow through system an exposure system for aquatic toxicity tests in which control water and test solution flow into and out of test chambers continuously a. Fry - very young or newly hatched fishes. EC X Effective Concentration. The concentration of a stressor that is estimated to be effective in producing a biological response, other than mortality, in x% of organisms over a specific time interval (e.g., 96-hr EC 20 ). ICPIN a computer-based statistical program whereby LC x s or EC x s are calculated using the linear interpolation method. In situ - in its place; in its natural setting (i.e., not under laboratory conditions). Juvenile fish young fish that have not reached sexual maturity. LC x Lethal Concentration (median). The concentration of a stressor that is estimated to be lethal to x% of the test organisms over a specific time interval (e.g., 96-hr LC 50 ). Semi-static system an exposure system for aquatic toxicity tests in which test chamber solutions are renewed daily a. Serial dilutions a procedure whereby the highest concentration of a test solution is diluted by equal amounts to form a series of progressively more dilute concentrations of the test solution.
10 Technical Memorandum No. T1.0 Toxicity-Testing Workstream ix DRAFT 18/04/01 8:12 AM Static system an exposure system for aquatic toxicity tests in which test chambers contain solutions of the test material or control water that are not changed during the test. Depending upon conditions, a static system may or may not be in equilibrium a. Sublethal below the level that causes death a. Toxic causing or having the potential to cause adverse effects to organisms or populations a. Toxicity the inherent potential or capacity of a material to cause adverse effects in a living organism a. a Definition obtained from CCME 1999
11 Technical Memorandum No. T1.0 Toxicity-Testing Workstream 1. INTRODUCTION 1-1 DRAFT 18/04/01 8:12 AM The City of Winnipeg is undertaking a comprehensive assessment of the basis for regulating ammonia in the Winnipeg reaches of the Red and Assiniboine rivers to help determine the need, costs, impacts and benefits of controlling ammonia in effluent from its Water Pollution Control Centres (WPCCs). The study includes 13 integrated workstreams. The Toxicity-testing workstream is a key component of the Ammonia-Criteria Study designed to establish the toxicity of ammonia in representative indigenous cool-water species. Toxicity test results will be used to calibrate and build the existing (i.e., public-domain) ammoniatoxicity dataset on which current regulatory guidelines are based. The results are also expected to greatly assist in the definition of locally-appropriate ammonia objectives for protection of aquatic biota in the study area rivers. 1.1 AMMONIA TOXICITY A detailed overview of ammonia toxicology is provided by the United States Environmental Protection Agency (USEPA 1998) in the 1998 update of ambient water-quality criteria for ammonia. Briefly, the toxicity of ammonia to aquatic organisms has been primarily attributed to the unionized form of ammonia (i.e., NH 3 ) which exists in equilibrium in aqueous ammonia solutions with the ammonium ion and hydroxide ion (c.f. Emerson et al. 1975). The concentration of ammonia in the unionized form (hereafter, NH 3 ) is primarily influenced by ph and temperature, with the unionized fraction increasing in concentration with increasing ph and temperature. However, when expressed in terms of unionized ammonia, a given concentration of ammonia is generally more toxic at lower temperatures (e.g., 5 C) than higher temperatures (e.g., 25 C). Mechanisms for toxicity in organisms continue to be elucidated. Ammonia is present naturally in low levels in aquatic systems, most commonly as a result of fish excretions and bacterial decomposition of organic matter such as algae. Other sources of ammonia in the Red and Assiniboine rivers include upstream agricultural runoff and some discharges from certain upstream industrial activities. Within the City of Winnipeg, treated effluent from the City s three WPCCs also contributes to ammonia in these rivers at levels that
12 Technical Memorandum No. T1.0 Toxicity-Testing Workstream 1-2 DRAFT 18/04/01 8:12 AM occasionally exceed Manitoba Surface Water Quality Objectives (MSWQO) (Wardrop/TetrES 1991). There has been no evidence to indicate that these levels are harmful to aquatic life (Wardrop/TetrES 1991). However, prior to this study, the specific effects of ammonia on selected species of aquatic life in either the Red or Assiniboine rivers had not undergone comprehensive examination. This is the first study to create and provide data on the ammonia sensitivity of: northern pike; mid-canadian genetic strains of walleye, fathead minnow (a standard test matrix), lake whitefish, lake trout, white sucker, floater mussel, and fingernail clam; and Ontario genetic strains of walleye and Ceriodaphnia dubia. This is only the second public report of ammonia sensitivity using local river water instead of laboratory water (CDM 1997). The previous study at Moorehead, Minnesota, tested only fathead minnows using Red River water as dilution water. 1.2 TOXICITY AND RISK ASSESSMENT OF CHEMICAL MIXTURES Theoretical Considerations Multichemical exposure in receiving environments, especially in such sinks as public waterways, is the rule rather than an exception. Chemical mixtures in the environment can be and generally are complex, consisting of parent compounds, reaction or transformation products along with other residues and potentially inert materials. Exposure of biota to combinations of pollutants may sometimes result in unexpected consequences, i.e., significantly lower or greater toxic response than a simple summation of the response induced by the mixture components taken individually. Such effects, the consequence of a phenomenon termed as toxicological interactions, may be beneficial (one chemical affording protection against the toxic effects of another) or hazardous (one chemical increasing the toxicity of the other) (Canadian Toxicity Information Network 1998).
13 Technical Memorandum No. T1.0 Toxicity-Testing Workstream 1-3 DRAFT 18/04/01 8:12 AM The toxicological interactions are frequently described using terms like antagonism, potentiation and synergism. Antagonism results when one component of the mixture interferes with another in such a way that the total toxic response is less than the sum of the individual responses. The protection against mercury toxicity afforded by selenium is a typical example of this category. Potentiation of responses occurs when substances of negligible toxicity enhance the response of other toxic substances. A classical example of this category of combined responses is the ketone-haloalkane interaction. Synergistic responses occur when all substances in the mixture induce toxicity but their combined response is greater than the sum of the response of the component parts of the mixture. Enhanced toxicity observed during combined exposure to haloacetic acids and haloalkanes is an example of this category (Canadian Toxicity Information Network 1998). A realistic approach to the assessment of risk associated with exposure to toxicants should consider the consequences of combined exposures to them as well; because such exposures - simultaneous or sequential - may produce effects quantitatively and/or qualitatively different from the expected additive responses. Therefore, the identification of the occurrence of toxic interactions among pollutants is logically an important aspect of the overall process of mixture risk assessment. The "quantitative" consideration of interactions in mixture risk assessment, however, continues to represent a challenge to the scientific and regulatory communities (Canadian Toxicity Information Network 1998) Approach in This Study In the present study, the potential interactions of ammonia with other effluent constituents were considered in developing a program to adequately assess ammonia toxicity from WPCC discharges to the Red and Assiniboine Rivers. The approach used included direct comparisons between toxicity data generated from side-by-side and simultaneous laboratory tests using one of two treatments: (a) serial dilutions of ammonia-spiked river water and (b) serial dilutions of ammonia spiked effluent. By keeping all other variables constant, it was intended that the toxic effects of ammonia as the sole toxicant be isolated from those observed in complex ammoniacontaining effluent mixtures.
14 Technical Memorandum No. T1.0 Toxicity-Testing Workstream 1-4 DRAFT 18/04/01 8:12 AM Three possible outcomes were possible from this type of simultaneous testing of chemical mixtures: the toxic effects between the two treatments may be no different from one another - this would suggest that ammonia is the sole effluent constituent capable of producing adverse responses in target organisms; the toxic effects of ammonia as the sole toxicant may exceed the toxic effects of the effluent - this would suggest that a chemical constituent of the effluent produces an antagonistic response, thus reducing ammonia toxicity; or the toxic effects of ammonia as the sole toxicant may be less than those observed when test-populations are exposed to effluent - this would suggest either that a synergistic response has occurred between the ammonia and other effluent constituents or that something in the effluent other than ammonia is capable of producing a toxic response. The first scenario is the most desirable outcome because it eliminates uncertainties and concerns about the adequacy of basing criteria development on tests conducted with spiked river water. Environmentally and economically (for the discharger in this case, the City of Winnipeg), reduced ammonia toxicity in the presence of other effluent constituents is the most desirable outcome because it suggests that the potential risk to aquatic organisms in a waterbody receiving complex ammonia-containing effluent-mixture discharges is significantly less than the risk associated with ammonia discharges only. The third possible outcome would promote the development of a more extensive testing-regime to identify all potentially toxic chemical constituents of the effluent and to quantify the toxicity associated with each chemical separately or in various combinations. Such an extensive toxicity assessment is almost prohibitively costly when using whole mixtures of varying compositions. 1.3 TEST-PROGRAM OBJECTIVE The objectives guiding the planning and execution of this workstream were:
15 Technical Memorandum No. T1.0 Toxicity-Testing Workstream 1-5 DRAFT 18/04/01 8:12 AM to determine site-specific ammonia sensitivity of key indigenous fish and invertebrate species in consideration of local river ph, and temperature regimes and other limnological factors; to derive locally-appropriate protective criteria using site-specific data. 1.4 RATIONALE FOR TOXICITY TESTING PROGRAM Toxicity testing is necessary for a number of reasons, specifically: Of approximately 50 fish species native to the Red and Assiniboine rivers, the sensitivities of only three local species have been documented in the public-domain dataset (USEPA 1998; Table 1-1); - the sensitivity of these three species is moderate and unlikely to represent the full range of fish sensitivities in the study area. - establishing the ammonia sensitivities of key local species allows the published dataset for toxicity to be expanded to allow calculation of protective criteria pursuant to the Resident Species provisions of the USEPA 1998 guidance document for deriving locally-appropriate criteria. - by contrast, once Resident Species provisions (per USEPA 1998) are applied, and irrelevant toxicity data are excluded (as recommended) from the combined toxicological dataset, standard errors can be derived for the dataset, and for taxa of specific interest. This allows determination of dose-response thresholds considered to be significant (e.g., the probable effects zone, where measured response consistently exceeds variability in the dataset attributed to natural variation, experimental error, etc.; e.g., Figure 1-1). Choosing an appropriate significant effects concentration (e.g., EC 20 ), which accounts for the majority (e.g., 80%) of the predictable or probable response to the stressor, is important in determining how much protection is enough. Relying exclusively on the existing public domain toxicity data for derivation of criteria to protect local biota adopts uncertainties and conservativisms associated with test conditions not necessarily representative of the Red and Assiniboine Rivers;
16 TABLE 1-1 GAPS IN AVAILABLE SUB-LETHAL DATASET Aquatic Biota Red River Assiniboine River Documented Toxicity a Native fish species Introduced species (Rainbow trout) b Other fish species Cutthroat trout Sockeye salmon Green sunfish Bluegill Smallmouth Bass Key Sport species Key Forage species Invertebrates Channel Catfish Walleye Sauger Northern pike Goldeye Mooneye Freshwater Drum Yellow perch Emerald shiner Various shiners and minnows Fathead minnow Silver chub Channel Catfish (young) Bullhead catfish (young) Carp (young) White suckers (young) Refer to benthic studies Channel Catfish Walleye Sauger Northern pike Goldeye Mooneye Freshwater Drum Yellow perch Emerald shiner Various shiners and minnows Fathead minnow Silver chub Channel Catfish (young) Bullhead catfish (young) Carp (young) White suckers (young) Refer to benthic studies a From U.S. EPA 1998; list of acceptable chronic (EC 20 ) tests b Non-indigenous Hatchery escapees (Rare) Channel Catfish Fathead minnow Young Channel Catfish White sucker (Young) Pelagic Ceriodaphnia sp. Daphnia magna Benthic Musculium tranversum (Fingernail clam species) Hyallela azteca (amphipod)
 Tissue Zn (µg/g dry wt) Source: Modified from Salazar and Salazar, 1995")

17 EC EC Growth Rate (mg/wk) Seawater TBT (ng/l) EC Tissue Cu (µg/g dry wt) EC Tissue TBT (µg/g dry wt) Tissue Zn (µg/g dry wt) Source: Modified from Salazar and Salazar, 1995 mussl s\01\prop Illustration of use of dose-reponse data to define "effects zones", to assist definition of threshold concentrations of "significant" effects (ie. EC n ) Figure 1-1
18 Technical Memorandum No. T1.0 Toxicity-Testing Workstream 1-6 DRAFT 18/04/01 8:12 AM - this means that criteria so derived could exceed or be less than the real protection requirements of these aquatic environments. Testing of local species during various life stages under spring, summer or winter conditions permits the development of site-specific temporal, spatial and seasonal protective criteria; - this approach is consistent with Manitoba Environment and CCME procedures for derivation of locally-appropriate criteria (cf., Figure 1-2). Determining the ammonia sensitivity of key local species responds to and fulfills Recommendation No. 6 of the Clean Environment commission ( CEC ) in its 1992 report (CEC 1992) which supported the City of Winnipeg s position in recommending that sitespecific and locally-appropriate toxicity testing be done to create confidence in the derivation of appropriate protective water-quality criteria. The CEC stated: "Detailed site-specific studies should be undertaken to determine both the acute toxic and chronic effects of un-ionized ammonia from wastewater effluent on the cool-water aquatic life of the rivers. Members of the scientific community within Manitoba should be invited to collaborate in the study design. Recommendations should be available before July 1997 as to the program required to deal with unionized ammonia in wastewater at the water pollution control sites along the river system being considered. The study results will be utilized to establish the un-ionized ammonia objective at public hearings to be held within six months of the completion of the study." Testing key local species and establishing their sensitivities to NH 3 will help to substantiate the costs or savings that will be realized in considering investment options for wastewater ammonia discharges for WPCCs to meet locally-appropriate protective criteria. 1.5 LINKAGE TO INTEGRATION WORKSTREAM This document summarizes activities performed and information generated during the Toxicity- Testing Workstream of the ammonia-criteria study. Included is a general description of the
19 RELATIONSHIP OF C.C.M.E. AND MANITOBA APPROACHES TO DERIVATION OF WATER QUALITY GUIDELINES C.C.M.E. MANITOBA ENVIRONMENT Initial Guidelines Used to Assess Water Quality Issues Water Quality Management Issues - Existing Toxics Problems - Jurisdictional Disputes - New Inputs - Changing Use Patterns 1. Which water uses are being impaired? 2. What are the water-quality variables causing the impaired use? 3. To what extent do human activities contribute to the impairment? Decision to Develop Objectives Initial Guidelines Used to Determine Potential Impacts On Water Uses Collect Information - Characteristics of Water Body - Current Use Patterns - Most Sensitive Water Use - Social and Economic Considerations Derive Interim Objectives - Recalculate Guideline Values Using Species and Environmental Data Relevant to the Site Program Evaluation - monitoring - compliance - water quality - water uses Economic and Social Considerations Negotiate and Approve Final Water Quality Objectives Control Options 4. What level of control is required to ameliorate the water-quality exceedences? 5. Do control technologies exist in order to achieve the level of reclamation necessary? 6. Does the cost of achieving the water-quality improvement bear a reasonable relationship to the benefits associated with attaining the water use? Sources: CCME 1999; Chapter 4, Fig.2 Williamson, 1990 ccme-env s\01\0110\22 Figure 1-2
20 Technical Memorandum No. T1.0 Toxicity-Testing Workstream 1-7 DRAFT 18/04/01 8:12 AM toxicity-testing program, from original design through program evolution and final implementation. The primary focus of this document is to describe the details of methods used and the results derived during laboratory and in situ toxicity testing. The implications of initial results for criteria development are also briefly discussed. A complete summary of data interpretation will be presented in a related document as part of the "Integration Workstream".
21 Technical Memorandum No. T1.0 Toxicity-Testing Workstream 2-1 DRAFT 18/04/01 8:12 AM 2. DESIGN OF TOXICITY-TESTING PROGRAM 2.1 ORIGINAL DESIGN The original design of the toxicity-testing program was derived from prior work completed by TetrES principals on this issue (MacLaren Plansearch 1987), including a study-scoping report prepared for the City of Winnipeg (by TetrES Consultants (1993). This work was done following the CECs recommendation for site-specific toxicity testing (CEC 1992). The original design was described in the February 1999 Draft Workplan (TetrES Consultants 1999a) and was presented at workshops held on September 24 (cf. TetrES Consultants 1998) and February 18 and 19, An overview of the activities intended to comprise the toxicity-testing workstream is shown in Figure 2-1. As part of the workshop agenda, review and comment of the toxicitytesting program was solicited from workshop attendees that included representatives from municipal, provincial and federal governments (including regulatory agencies), key members of the scientific community, and project consultants. Guidance provided by participants of the workshop helped to organize various components of Phase 1 of the Ammonia-Criteria Study development, as illustrated in Figure 2-1. Some of the suggestions provided at the workshop include the following: Reviewing existing acute and chronic-exposure databases to - determine standard test-acceptability criteria; - validate the reproducibility of key tests that most greatly influence the derivation of current guidelines; and - determine whether these key tests need to be repeated. Re-evaluating work done by Borgmann (1994), (a key test), in which the amphipod species Hyalella azteca was found to be highly sensitive to ammonia, and determining whether this species inhabits Manitoba waters. If H. azteca is indigenous to the Red and Assiniboine rivers, then invertebrate testing was to be expanded to include survival and reproduction effects for this species; - sensitivity analysis on the Hyalella endpoint data had indicated the importance of testing the species under local conditions; - small changes in the Hyalella data would likely have considerable influence on any Ecological Risk Criterion derived for the local aquatic community.
22
23 Technical Memorandum No. T1.0 Toxicity-Testing Workstream 2-2 DRAFT 18/04/01 8:12 AM Establishing river conditions (i.e., effluent mixing zones, flow conditions, annual water chemistry variability, etc.) and preferred fish habitat zones and typical distribution patterns. - it was considered essential to consider fish behaviour and movement in relation to the in situ ammonia gradient to establish the risk of animal-exposure to ammonia. If avoidance behaviour to areas of high ammonia concentration could be demonstrated, then the relative importance of establishing site-specific sensitivities diminishes and time budget and energy expenditures could be redirected into other workstreams. Alternately, if aquatic biota were found to be at medium or high risk to elevated ammonia concentrations, the establishment of typical river conditions could aid in designing laboratory tests that more closely reflect in situ conditions. Determining the species of fish and invertebrates that would provide the most valuable data in the laboratory; - e.g., small home-range species exposed to ammonia should be selected over species that migrate through ammonia plumes because the former have an increased probability of developing toxic effects. Determining the species of fish and invertebrates that are indigenous to the study area and are capable of providing comparable datasets with literature reported in the public domain. Validating that candidate bivalve species are indigenous to the Red and Assiniboine Rivers. - some trade-offs may need to be made between testing species that are most representative of the study area versus those that are most easily attainable. Considering how best to use new technologies. Evaluating all proposed studies for their explicit contribution to weight of evidence and prioritize the studies accordingly; - e.g., prior to initiating the test-program, the relative importance of evaluating other chemical stressors in effluent and their contribution to ammonia toxicity would need to be established. Considering parallel/simultaneous in situ and lab test options for bivalve and other invertebrate communities. The dynamic nature of the toxicity-testing workstream has allowed continuous incorporation of feedback from reviewers (e.g., TetrES Consultants 1999b) and has allowed the toxicity program design to evolve to accommodate factors that have influenced various Phase 2 components of the toxicity-testing workstream.
24 Technical Memorandum No. T1.0 Toxicity-Testing Workstream 2.2 PROGRAM EVOLUTION 2-3 DRAFT 18/04/01 8:12 AM Evolution of the workplan for the toxicity-testing workstream has been influenced by feedback from Ammonia-Criteria Study Workshop participants and a number of other key factors including: availability of appropriate test specimens and rearing facilities; unpredictable weather conditions influencing test-specimen acquisition, mobile-lab facility siting and toxicity-testing schedules; disease outbreaks in test stock, associated with high fungal loads in spring runoff; discovery that the preferred (riverside) site for the mobile laboratory could not be made available and the process of finding ways of doing the testing at the North End Water Pollution Control Centre (NEWPCC); trial and error in developing holding and rearing techniques for test specimens that had not been previously tested for ammonia toxicity; test-schedule alterations influenced by availability of suitable and cost-effective testing facilities and infrastructure; and the possibility of a strike by public-sector workers in the middle of the testing program. To efficiently assess the numerous factors that influenced the design and schedule of the toxicity-testing program, key decisions during the program were made based on the thencurrent availability of critical components necessary for the initiation of a specific toxicity test, using a standardized decision tree (c.f. Figure 2-2). This decision tree was relied upon on many occasions in 1999 and 2000 as the test program evolved in response to a wide variety of externalities. 2.3 FINAL DESIGN FOR 1999 PROGRAM Figure 2-3 illustrates the timing and activities performed as part of the toxicity-testing workstream in 1999 and The toxicity-testing program schedule and activities were dynamic and substantially influenced by factors noted in Section 2.2. The result has been the
25 PREFERRED ACCEPTABLE (if no other option) UNACCEPTABLE Choice of test stock? native NO another test yr. available NO commercial test stock available NO YES YES YES Desired type of exposure? continuous flow NO another test yr. available NO static & semi-static testing acceptable NO YES YES YES Holding / rearing system availablity? available NO Study Stops YES NEWPCC Toxicity test system on riverside site? available NO alternative test facility available NO YES YES initiate testing toxtree s\01\0110\22 Decision-Tree for Design of Toxicity Testing Program Figure 2-2
26 Test Conditions June July August September October November May June July NH 3 -Spiked River Water; serial dilutions Walleye, White Suckers Ceriodaphnia Channel Catfish, Fathead Minnows Whitefish Whitefish Northern Pike White Suckers Fathead Minnows Lake Trout Walleye Hyalella Hyalella NH 3 -Spiked Effluent; serial dilutions (river water) White Suckers, Fathead Minnows Ceriodaphnia White Suckers Fathead Minnows Fluctuating Effluent-NH 3 Dilutions Clams Mussels In situ: Red River (Ambient Effluent NH 3 Variation) Mussels and Clams Notes: Details of these tests are described in Section 3.0 (also ref. Table 3-1) - acute-exposure, static test - acute-exposure, semi-static test toxsced4 s\01\0110\22 - acute-exposure, flow-through test - chronic-exposure, semi-static test - chronic-exposure, flow-through test Ammonia Toxicity-Test Program; 1999 and 2000 Figure 2-3
27 Technical Memorandum No. T1.0 Toxicity-Testing Workstream 2-4 DRAFT 18/04/01 8:12 AM development and execution of an effective toxicity program that has contributed valuable information to the existing dataset while coping with a variety of external constraints. The initial conceptual design of the toxicity program involved the construction and utilization of a temporary and mobile laboratory facility for river-side chronic-exposure testing of various fish and invertebrate species native to the Red and Assiniboine Rivers. Difficulties and delays encountered in siting the facility promoted the implementation of a series of acute-exposure tests conducted under static or semi-static conditions at the NEWPCC (c.f., Figure 2-3). These tests are simpler in design and require less space than flow-through test apparatii and provided valuable information about appropriate ammonia-exposure concentrations to use in subsequent long-term testing. Side-by-side acute-exposure tests using serial dilutions of ammonia-spiked river water and ammonia-spiked effluent were also included in the initial program design for reasons discussed in Section 1.2. When a suitable location was found at the NEWPCC for the flow-through laboratory in the fall of 1999 and the testing apparatus was constructed, long-term (i.e., up to 30 day) chronicexposure tests were initiated. Similar tests were conducted in the flow-through laboratory in the spring and summer of 2000 (cf. Figure 2-3). The species of fish or invertebrates used for ammonia-toxicity testing depended largely on the availability of the target test-specimens and the study team s ability to successfully hold and rear them in the laboratory until they were ready for testing. Although difficulties were encountered during the two-year testing-period, the initial program objectives were successfully met. Tests were completed using 5 indigenous fish species, 2 indigenous bivalve species and 2 species of other invertebrates of ecological, economic or social significance (cf. TetrES Consultants 1999a).
28 Technical Memorandum No. T1.0 Toxicity-Testing Workstream 3. TESTING METHODS 3-1 DRAFT 18/04/01 8:12 AM /2000 PROGRAM Toxicity tests completed during the 1999 and 2000 test-seasons include both acute and chronic unionized ammonia-exposures with seven fish species and four invertebrate species. All test specimens obtained within the Red and Assiniboine River watersheds, or from Ontario, were collected pursuant to provisions of Scientific Collection permits issued by either Manitoba Fish Habitat Management Section of Manitoba Conservation (formerly Manitoba Environment) or the Ontario Ministry of Natural Resources (OMNR). Table 3-1 summarizes the types of toxicity tests performed on each species, referenced by test number. Details of the test conditions are provided in Appendix A. Unless otherwise stated, NH 3 -N in this text refers to total ammonianitrogen and NH 3 refers to unionized ammonia Fish Testing Fish (i.e., channel catfish (Ictalurus punctatus), fathead minnow (Pimephales promelas), lake trout (Salvelinus namacycwl), lake whitefish (Coregonus clupeaformis), northern pike (Esox lucius), walleye (Stizostedion vitreum), and white sucker (Catostomus commersoni),) were exposed to various NH 3 concentration-gradients under static, semi-static and/or continuous-flow conditions for exposure-periods ranging from 72 hours to 30 days (c.f. Appendix A). All testing methods followed ASTM protocols (1996) or USEPA protocols for acute-exposure testing (1993) or chronic-exposure testing (1994). Acute and chronic-exposure effects were determined by comparing the survival and/or growth of test organisms with average exposure-concentrations of NH 3 for each test. Test fish were captured locally (i.e., within Manitoba, Saskatchewan or Ontario waters draining into the Red and Assiniboine drainage basins) or were obtained from North American government or commercial hatcheries (c.f. Appendix A). Collection and Handling Permits obtained from Manitoba Conservation (formerly Manitoba Department of Natural Resources) and the OMNR are provided in Appendix B. Prior to test initiation, fish were either held for a minimum of 24 hours in tanks containing Red River water in the laboratory or they were held off-
29 Technical Memorandum No. T1.0 Toxicity-Testing Workstream 3-2 DRAFT 18/04/01 8:12 AM site in a continuous-flow holding-tank receiving La Salle River water. The holding sites enabled the fish to acclimate to site-specific water-chemistry conditions, specifically temperature, ph and dissolved oxygen (DO), before entering the exposure systems Acute-exposure Testing Newly hatched (i.e., 72-hour) or young (i.e., 8- to 39-day) fathead minnow, white sucker and walleye fry were exposed to a range of NH 3 concentrations in spiked Red River water with and without treated effluent from the North End Water Pollution Control Center (NEWPCC) (c.f. Table 3-1 and Appendix A). Red River water was manually obtained from a location approximately 0.5 km upstream of the NEWPCC outfall and transported in 20L carboys to a laboratory at the NEWPCC. Mortality of the test-organisms was monitored daily. Cumulative percent-survival data measured at 72 or 96 hours (i.e., test-termination) were used in regression analysis in conjunction with analytical measurements to determine the NH 3 concentrations that produced 20% and 50% lethality (i.e., LC 20 and LC 50 ). Ten fry were added to 1-L polyethylene chambers with 500 to 750 ml of test solution (c.f. Appendix A). The exposure solutions were prepared once at the beginning of the static tests (i.e. T1A&B) and daily for all semi-static tests (i.e. T2A&B, T3A&B, T4A&B, T6A&B). Appendix C contains a detailed description of the protocol used to prepare exposure solutions. In summary, a measured amount of ammonium-chloride solution (i.e. NH 4 Cl dissolved in deionized water) was added to either river water or effluent to elevate the NH 3 -N concentration to the highest desired nominal test concentration (e.g. 32 mg/l). Initial NH 3 -N concentrations in the effluent were determined using a CHEMet Ammonia Kit. If the background NH 3 -N concentration was higher than the highest desired nominal concentration, then the effluent was diluted with river water until the desired nominal test concentration was obtained. Subsequent exposure-concentrations were obtained by serially diluting the solutions with river water by a factor of 0.5. Three to four replicates were prepared for each exposure-concentration with the number of replicates being determined by the supply of fish surviving the holding/acclimation period and available for testing (c.f. Appendix A). The 1-L polyethylene chambers were held in continuously flowing water baths bathed by Winnipeg tap water (Figures 3-1 and 3-2) to maintain test temperatures of 15 to 21 o C (c.f. Appendix A).
30 TABLE 3-1 AMMONIA TOXICITY TESTS CONDUCTED DURING THE 1999/2000 PROGRAM TEST-ORGANISM DURATION/TEST-TYPE DILUTION WATER FISH 1999 TESTING Fathead Minnows fry (U.S. Stock Lab Raised) Fathead Minnows - juvenile (U.S. Stock Lab Raised) 96-hr, semi-static 72-hr,. semi-static 72-hr,. semi-static Red River water Red River water Red River water SOURCE OF AMMONIA Effluent and NH 4Cl a NH 4Cl Effluent and NH 4Cl a NOMINAL [NH 3 ] or % EFFLUENT 1.0 to 64 mg/l 1.0 to 32 mg/l 1.0 to 32 mg/l 29-day, flow-through Red River water NH 4Cl 0.5 to 8 mg/l Fathead Minnows - sub-adult (Local Stock Captured) Walleye fry (Local Stock Hatchery Raised) White Sucker fry (Local Stock Reared) Channel Catfish Juvenile (U.S. Stock Lab Raised) FISH 2000 TESTING Northern Pike fry (Local Stock Hatchery Raised) Walleye fingerlings (ON Stock Hatchery Raised) Lake Whitefish fry (Local Stock Hatchery Raised) * Treated for fungal infection prior to test start Lake Whitefish fry (Local Stock Hatchery Raised) * Disease-free Lake Trout fingerlings (Local Stock Hatchery Raised) INVERTEBRATE 1999 TESTING Giant Floater Mussel (Local Stock Collected) Grooved Fingernail Clam (Local Stock Collected) Ceriodaphnia dubia (E.S.G Stock Lab Raised) 30-day, flow-through Red River water NH 4Cl 0.5 to 16 mg/l 96-hr, static Red River water NH 4Cl 1.0 to 125 mg/l 96-hr, static 96-hr, semi-static 96-hr, semi-static 10-day (96-hr), semi-static 10-day (96-hr), semi-static 96-hr, semi-static Red River water Red River water Red River water Red River water Red River water Red River water NH 4Cl NH 4Cl Effluent and NH 4Cl a NH 4Cl Effluent and NH 4Cl a Effluent and NH 4Cl a 1.0 to 125 mg/l 0.5 to 32 mg/l 0.5 to 32 mg/l 0.5 to 32 mg/l 0.5 to 32 mg/l 1.0 to 64 mg/l 30-day, flow-through Red River water NH 4Cl 0.5 to 16 mg/l 12-day, flow-through Red River water NH 4Cl 0.5 to 8.0 mg/l 30-day, flow-through Red River water NH 4Cl 0.5 to 6.0 mg/l 13-day, flow-through Red River water NH 4Cl 0.5 to 8.0 mg/l 5-day, flow-through Red River water NH 4Cl 0.5 to 8.0 mg/l 30-day, flow-through Red River water NH 4Cl 0.5 to 8.0 mg/l 66-day laboratory semi-static 62-day in-situ chronic exposure 8-day laboratory semi-static 62-day in-situ chornic exposure 7-day, semi-static 7-day, semi-static Red River water Red River water (in situ) Red River water Red River water (in situ) Red River water Red River water Effluent Effluent; varying distances from outfall Effluent Effluent; varying distances from outfall NH 4Cl Effluent and NH 4Cl a 1.5% - 100% effluent variable 1.5% - 100% effluent variable 2 to 64 mg/l 2 to 64 mg/l INVERTEBRATE 2000 TESTING Hyallela (Lab Stock) 30-day, semi-static 96-hr semi-static Red River water Red River water NH 4Cl NH 4Cl 0.5 to 8.0 mg/l 1.9 to 60 mg/l Notes: a = ammonium chloride (NH 4Cl reagent grade) was used to adjust ammonia concentration in effluent if it was less than the highest exposureconcentration 0110a22/Report/Amy s Work/Fish tox tests/table 3-1 NEW.doc TetrES CONSULTANTS


31 watrbath s\01\0110\22\99tox Test Chambers and Waterbaths used for Static and Semi-static Fish Toxicity Testing Figure 3-1


32 Scientific Advisor, Gordon Craig, adjacent to water baths and test chambers for acute lethality tests (trying to appease angry test fish by calling out for pizza) White Sucker fry used in toxicity tests staticlab s\01\0110\22 Static and Semi-Static Fish Toxicity Testing Facility at the NEWPCC Figure 3-2
33 Technical Memorandum No. T1.0 Toxicity-Testing Workstream 3-3 DRAFT 18/04/01 8:12 AM Temperature, ph, dissolved oxygen (DO), and conductivity measurements were recorded daily for all test chambers or a representative sample of test chambers. Representative-samples were obtained from randomly selected test chambers at high, medium and low exposure concentrations under the assumption that all test conditions across the exposure gradient would be represented in the samples. Mortality checks were preformed once daily for all test chambers and dead fish were noted and removed from the exposure system. During semistatic testing, mortality checks were conducted prior to replenishing test solutions and water quality measurements were collected within 4 hours after test solution exchange. NH 3 -N concentrations were determined from 5 to 30 ml samples of test solution collected daily from one replicate of each exposure concentration per species tested. Analyses were done onsite at the NEWPCC lab using a Technicon Auto Analyser II (Figure 3-3) and the phenate colourimetric method (c.f. Clesceri et al. 1998). All samples not analysed within 24 hours were preserved with 0.5 to 1.0 ml of mercuric chloride (HgCl 2 ) and stored in a refrigerator at 4 o C. Results reported by the NEWPCC lab are documented in Appendix D. These data, together with test-temperature and ph measurements, were used to calculate average NH 3 concentrations according to Emerson et al. (1975), as described in Appendix E. Percentsurvival data were used with NH 3 exposure concentrations to estimate LC 20 and LC 50 concentrations by linear interpolation, as described in Appendix F. Modifications to the test system were made as relative size differences and age classes of test species changed, thus altering space requirements and rates of DO and food consumption for the fish. Test solution volume, and the addition of continuous aeration and feeding-regimes, changed accordingly (c.f. Appendix A). During the first four tests (i.e., T1A&B, T2A&B), the fry retained yolk sacs and were not actively feeding. On the third day of T1A and T1B, one drop of Wardley Liquid-Baby-Fish Food was placed into each test chamber, but was not eaten by the fry. During the third and subsequent tests, fish began actively feeding and were fed approximately 4.4 mg (dry weight) of newly hatched, live, brine shrimp twice daily for all but the final day of the each test (c.f. Appendix A). Fish were not fed within 24 hours of test termination to ensure that all food was completely digested and eliminated from the gut prior to making whole-body dry-weight measurements.


34 nh3anyl s\01\0110\22 Determining Ammonia Concentrations in Toxicity Test Water Samples Figure 3-3
35 Technical Memorandum No. T1.0 Toxicity-Testing Workstream 3-4 DRAFT 18/04/01 8:12 AM At the end of each test, live fish were removed from the exposure chambers, counted, placed on labeled and tared aluminium foil sheets and dried at 103 o C for at least 2 and not more than 24 hours. The foils holding the fish were removed from the oven and weighed to the nearest 10-4 grams to quantify differences in fish weights across the exposure gradient Chronic-Exposure Testing Seven species of fish (i.e., white sucker, fathead minnows, channel catfish, walleye, northern pike, lake whitefish and lake trout) of various age classes were subjected to chronic unionized ammonia-exposure for 5 to 30 days (c.f. Appendix A). Two of the tests (i.e., T3A&B) with white sucker were semi-static and test protocols have been described in Section and Appendix C. All other chronic tests (i.e., T8, 9, 11, 14, 15, 18, 20 and 21) were conducted in a flow-through exposure system described below. A flow-through laboratory was constructed in the dewatering building of the NEWPCC (Figure 3-4) and was continuously supplied with water from the Red River to facilitate site-specific testing. The river water was pumped from a point approximately 0.5 km upstream from the NEWPCC outfall (Figure 3-5), pushed through a 900-meter underground pipeline and deposited into a 2500-liter holding-tank (Figure 3-6) within the laboratory. The holding tank served as a primary settling chamber for suspended solids and provided a two-hour water-reserve necessary for maintaining water supplies within the laboratory when the river-water-pump intake needed cleaning. A settling chamber was necessary since high suspended solids in the Red River (100 to 400 mg/l) would have plugged the diluters (described later). From the holding tank, water was pumped through a filter and into an 80-liter container (referred to as the river water-chamber ) secured near the top of a 12-ft heavy-duty shelving unit (Figure 3-7). From this chamber, water was distributed to a series of testing tables (Figures 3-8 and 3-9) and holding tanks (Figure-3-10) through two gravity-fed, 1¼-inch ABS pipes (Figure 3-11). River water was also directed through (a) a PVC gate valve for tests conducted in 1999 and (b) a swing arm device for tests conducted in 2000 both to control the flow of water into an 80-liter mixing-chamber located three feet beneath the river water chamber (Figures 3-7 and 3-12). Flow rates through the swing-arm were controlled by adjusting the height of an extension of tubing directed at 90 o angles from the side of a bucket. This motion altered the head-pressure


36 Location of the continuous flow toxicity lab at the dewatering building,city of Winnipeg North End Water Pollution Control Center Figure 3-4 labloc; s\01\0110\22 River water supply pump located on the Red River adjacent to the Bergen Cut-Off Figure 3-5


37 river water River water holding tank Figure 3-6 ammonia Water distribution tower with the river water and ammonia distribution chambers Figure 3-7 tanktower; s\01\0110\22\99tox


38 Continuous flow toxicity laboratory within the Dewatering Building at NEWPCC Figure 3-8 Toxicity lab from another perspective Figure 3-9 labview; s\01\0110\22

39 fishhold; s\01\0110\22 Fish holding facilities continuously supplied with Red River water Figure 3-10
40 Fish Holding Tanks Water Tower River Water Distribution Chamber Filter Supply Pipes River Water Distribution Chamber Overflow Pump Swing-Arm Diluters Distribution Manifold River Water Holding Tank Test Chambers River Water Pipe Line toxlabschem s\01\0110\22 Schematic of Toxicity Lab Layout at NEWPCC Figure 3-11


41 Ammonia mixing chamber on water tower Figure 3-12 Ammonia NH 4 Cl stock container and dosing pump Figure 3-13 nh3mix; s\01\0110\22
42 Technical Memorandum No. T1.0 Toxicity-Testing Workstream 3-5 DRAFT 18/04/01 8:12 AM differential between the overflow drain near the top of the bucket and the mouth of the tubing, thus controlling the flow of water through the arm. The swing-arm system replaced the gate valve in the second year of testing because it was more stable and the water flow could be adjusted with a higher degree of accuracy. Ammonia was introduced to the system through a LMI dosing pump that supplied a highly concentrated solution of dissolved ammonium chloride (NH 4 Cl) from NH 4 Cl-stock container to the mixing-chamber (Figure 3-13). The NH 4 Cl stock was prepared according to the protocol described in Appendix G. From the mixing-chamber, an ammonia-solution was distributed to the testing tables through a second set of ABS piping arranged in a similar configuration as that used to distribute the river water. At each testing table, exposure-solutions were prepared using a diluter system that was fed a continuous supply of ammonia solution and river water. Exposure concentrations were controlled by adjusting the flow rates in the diluter system with a series of PVC gate valves and swing arms (Figures 3-14 and 3-15) (c.f. Appendix G). A flow-splitting device (referred to as the distribution-manifold ) directed the exposure solution to test chambers equipped with overflows and designed for continuous test-solution replenishment (Figure 3-16). The minimum daily replacement rate of test solution was 29 times per day. Four replicate test chambers were used for all flow-through tests except tests 20 and 21 which had only 3 replicates each due to lower fish density prior to test start and limited space availability at each testing table (cf. Appendix A). The number of organisms distributed to each test chamber was a function of test type and animal size and density at test start. Ten organisms were held in each test chamber for both semi-static tests and between 12 and 26 were used in flow-through tests (Appendix A). Fish were fed with food recommended by government and commercial hatcheries, as described in Appendix A. Fish were not fed within 24 hours of test termination to ensure that all food had been completely digested and eliminated from the gut prior to whole-body dry-weight measurements. The dilution system was checked daily to ensure that nominal NH 3 -N concentrations were maintained. Adjustments were made to the flow rates, if necessary, to achieve the desired nominal concentrations. Once the system stabilized, water temperature, ph and DO


43 River water and ammonia swing arm diluters at the 0.5mg/L exposure table Figure 3-14 Top view of the river water and ammonia swing arm diluters Figure 3-15 swingarm; s\01\0110\22

44 Distribution manifold manifold; s\01\0110\22 Water in the test chamber is continuously renewed by water supplied through the distribution manifold Figure 3-16
45 Technical Memorandum No. T1.0 Toxicity-Testing Workstream 3-6 DRAFT 18/04/01 8:12 AM measurements were obtained from a representative sample of test chambers for each species. During 1999 testing, actual NH 3 -N exposure concentrations were measured from 60 ml samples collected prior to and following calibration using a Chemet Ammonia Kit and the NEWPCC s Technicon Auto Analyzer II, respectively. Measurements were taken twice daily to account for variability in exposure concentrations due to changes in flow rates in the diluter systems resulting from sediment build-up. For tests conducted in 2000, both methods of NH 3 -N analysis were completed for the first 10 days of testing, but improved stability of the test system from changes made to the primary and secondary diluters eliminated the necessity of collecting duplicate samples. For the remainder of the 2000 test program, water samples were collected following calibration and analysed with the Techinon Auto Analyzer II only. All water samples analyzed by the NEWPCC lab were obtained, preserved, and stored according to the protocol described for the acute-exposure tests (cf. Section ). Results are reported in Appendix D. Fish mortality for each test was checked daily using one of two methods of inspection; (a) visual-inspection method and (b) net-collection method. Visual inspections of the fry were possible because fry were held in small test chambers with screened bottoms inserted into a second set of containers equipped only with drains. Using this design, the inner container could be lifted and the volume of water within the container reduced, thus enabling dead fish to be counted and removed from the test chambers. Juvenile fish were held in larger containers and because the turbidity of the water ( mg/l TSS) made it impossible to see the fish, a net was used to swipe the bottom of the test chambers and collect and remove dead fish. Dead fish were counted and recorded, then discarded. At the end of each test, surviving fish were removed from the test chambers, counted and terminated using either a lethal dose of MS-222 (tricane or Finquel), or thermal shock with hot tap water. The fish were then placed on labelled and tared aluminium-foil trays, dried at 103 o C for 24 to 48 hours then weighed to the nearest 10-4 gram. Average NH 3 concentrations for each chronic test were calculated based on daily temperature, ph and NH 3 -N concentrations according to Emerson et al. (1975) (c.f. Appendix E). Survival and growth data were used with the NH 3 exposure concentrations to estimate the LC 50/20 and EC 50/20 concentrations by linear interpolation, as described in Appendix F.
46 Technical Memorandum No. T1.0 Toxicity-Testing Workstream Bivalve Tests 3-7 DRAFT 18/04/01 8:12 AM An in situ field bioassay and a concurrent laboratory toxicity-test were conducted using two species of local bivalves, floater mussels (Pyganodon grandis) and fingernail clams (Sphaerium simile). Approximately 1600 floater mussels and 4000 fingernail clams ranging in age between 1 and 3 years were collected from La Salle River, Starbuck, Manitoba (Figure 3-17). A temporary work-site was established in Starbuck for test preparations that included sorting the bivalves (Figure 3-18), obtaining morphometric measures (e.g., initial weights and lengths) using electronic balances and electronic vernier calipers (Figure 3-19), and securing the testorganisms in thin nylon mesh bags (Figure 3-20). The mussels and clams were placed into mesh bags to facilitate measuring shell lengths, whole-animal wet weights, and end-of-test tissue and shell weights on individuals. For the field study, the floater mussels were distributed with 39 individuals per bag; the fingernail clams were distributed with 100 per bag. For the laboratory test, the floater mussels were distributed with 19 individuals per bag; the fingernail clams were distributed with 50 per bag. Cinched cable ties were used to separate bivalves in the mesh bags and maintain position within the bag. Ample water circulation and equal exposure to test-conditions was ensured by placing the individuals into compartments made of an open mesh material. The goal of the in situ field study was to quantify exposure to effluent discharged from the NEWPCC through bioaccumulation and/or morphometric and survivorship measurements and to quantify effects of that exposure through growth measurements. The goal of the laboratory test was to expose the bivalves to treated effluent concentrations that were similar to in situ exposure-concentrations and determine the concentrations that produced a lethal or sub-lethal effect (i.e., growth) in 20% and 50% of the animals based on percent survival and whole-animal wet weight (WAWW) measurements In situ Test A complete description of the in situ bioassay is provided as a separate report, Appendix H. A summary of the study is provided here. After making beginning-of-test (BOT) WAWW and shelllength measurements, and securing them in mesh bags, the bags were secured to frames made from rigid 0.6 m x 1.0 m PVC material. Each PVC frame contained three bags of floater


47 scrnsort s\01\0110\22 Screening and Sorting Bivalves from the LaSalle River Figure 3-17


48 facility s\01\0110\22\99tox Facilities Used for Preparation of Bivalve Test Cages and Sorting of Bivalves Figure 3-18


49 Measuring Bivalve Morphometric Parameters and Recording Data measure s\01\0110\22\99tox Figure 3-19


50 Preparing Mussel Strings Preparing Clam Strings Preparing Strings of Mussels and Clams for in situ Test Cages string prep s\01\0110\22 Figure 3-20
51 Technical Memorandum No. T1.0 Toxicity-Testing Workstream 3-8 DRAFT 18/04/01 8:12 AM mussels and two bags of fingernail clams. The PVC frame was then wrapped in heavy plastic mesh (mesh size: 8 mm) to deter predators (Figure 3-21). Three replicate cages were prepared for each of the seven field stations shown in Figure For each station, one temperature monitor was fastened to one of the three replicate cages. To complete the deployment array, lines and floats were attached to the cages in such a manner that the three cages assigned to a given site were tied together (Figure 3-23). The locations of the seven field stations were identified in the field with a Global Position System (GPS) and the three cages assigned to a given station were deployed as a unit. Distribution of each set of replicate cages at each sample station had been predetermined by reference to a model simulation of the centreline of the plume for the river flow rate just prior to deployment (Figure 3-24). Prior to their release, anchors were fastened to each cage to increase the sinking rate and reduce the horizontal travel distance of the cages before they settled to the river floor. Subsurface floats marked the location of the submerged cages and all cages were secured to the shoreline with a weighted, camouflaged line. Initial deployment sites and details of deployment cages and protocol are given in Table 3-2 with termination locations given in Table 3-3 and Appendix H. The Red River flow rate varied greatly (as did other quality parameters) over the summer, especially during the test program (Figure 3-25 & Table 3-3). High flows during cage deployment in July gave way to lower rates in August. Lower flow rates meant that the NEWPCC effluent plume had greater momentum entering the river, moving the mixing zone further offshore and away from the cages. To maintain exposure of the cages to the effluent plume, they were moved to the new plume centreline on August 18, When flows rose dramatically in September 1999 and the mixing-zone plume moved closer to the shore, the cages were again re-deployed along the apparent centreline of the plume, to attempt to maintain their exposure to the NEWPCC effluent (c.f. Figure 3-25). Water chemistry was monitored at each station in the river, once the cages had been deployed, in July, August and September 1999 (c.f. Tables 3-5, 3-6, and 3-7). The caged bivalves were deployed for 65 days beginning on July 14, While it was intended that the exposure would be longer, a dramatic increase in floating logs and other debris present in the river because during late-summer flooding (c.f. Figure 3-25) threatened the integrity of the cages and therefore the entire in situ program.


52 Clam and Mussel String Positions on Cage Frame Attaching Predator Mesh Cage Construction for in situ Bivalve Test cageconst s\01\0110\22\99tox Figure 3-21
53 Caged Mussel Deployment Configuration at NEWPCC Max [Ammonia] (mg/l) NEWPCC Discharge Red River Conceptual Output: Plume Centreline Concentration (Effluent Concentration = 20 mg/l) Winter Fall Upstream Reference (Control) Treatment Stations 1 through 6 Distance (m)


54 Cage Stations Kept Submersed Prior to Transportation to Deployment Sites Cage Stations Taken Individually by Boat to Deployment Sites Preparation for Deployment of Bivalve Stations deploy Figure 3-23 s\01\0110\22

55
56 TABLE 3-2 Initial Bivalve Station Positions, July 14, 1999 Station # Cage #'s* Distance from Outfall (m) UTM Northing UTM Easting 1 2,10, ,17, ,7, ,8, ,18, ,15, Reference 12,16, m upstream *Note: Approximately 3 meters distance between cages (positions and distances from outfall are approximate due to high river velocites while setting mussel cages). TABLE 3-3 Order of Bivalve Stations At Termination of In Situ Experiment Station # Cage #'s Distance from Outfall (m) Date Pulled Order of Pulling* 1 2,10,13 5 Sept ,6,24 25 Sept ,8,14 40 Sept ,22,18 60 Sept ,7, Sept , 15, Sept Reference 12,19, m upstream Sept *Notes: Stations were not pulled in order due to limited visability of all float markers. Station and Cage positions were altered at some sites during the course of the experiment due to very high water velocities and snagging of cages while setting cages and monitoring water chemistry.
57 700 Flow Rate (m³/s) Jul Initial Cage Deployment 13-Aug 1st Redeployment 1999 Flows Sample Date 14-Sep 2nd Redeployment "EOT" 0 14-Jul 21-Jul 28-Jul 4-Aug 11-Aug 18-Aug 25-Aug 1-Sep 8-Sep 15-Sep Legend "BOT" - Beginning of test "EOT" - End of test 99flows s\01\0110\22 Red River Flows at Lockport in 1999 During In Situ Mussel Tests Figure 3-25
58 Table 3-4 River Conditions and Theoretical Plume Centreline During In Situ Mussel Tests Date River Temperature Distance Downstream in metres Jul * 22-Jul Jul Aug * 12-Aug Aug Aug Sep Sep * 16-Sep *Sample Dates Flow (m³/s) Effluent Temperature Ammonia Concentration at Centreline of Plume as Extimated by CORMIX TetrES CONSULTANTS INC. In Situ Mussel CORMIX
59 TABLE 3-5 Water Chemistry Monitoring at Bivalve Placement Stations, July 20, 1999 Station # Bivalve Cage #'s Distance from Outfall (m) Ammonia Concentration a (mg/l) 2m Depth 3m Depth Ph Temp. ( o C) D.O. b (mg/l) Cond. c us Velocity (m/sec) 1 2,10, / 7.6 d 22.6 / / / / ,17, / / / / / ,7, / / / / / e 4,8, ,18, / / / / / f 11,15, Reference 12,16, m upstream / / / / / 1.0 a = Ammonia concentrations taken using a ChemMet Kit b D.O. = Disolved Oxygen c Cond. = Conductivity d = For all other parameters, measurements taken at 2m and 3m depth, respectively, are separated by "/" e = Float marker not visable; parameters not measured. f = Water pump failed; surface Ammonia = 0.2 mg/l, ph = 8.3, Temp. = 23.4
60 Station # TABLE 3-6 Water Chemistry Monitoring at Bivalve Placement Stations, Aug. 13, 1999 Bivalve Cage #'s Distance from Outfall (m) Max. Depth (m) Ammonia Concentration a (mg/l) 1 2,10, (<0.3) / 7 (6.9) d 7.3 / / / / / ,17, / 4 (6) 7.4 / / / / e Surface (S) = 4 S = 7.6 S = 21.3 S = m S = ,8, m = 3 5m = 7.7 5m = 21.2 = m = 750 3m = 7.6 3m = m = m = ,18, m = 4 5m = 4 5m = 7.6 5m = m = m = 760-3m = 3 (3.7) 5m 3m = 7.7 3m = m = m = ,7, = 4 5m = 7.6 5m = m = m = 860-3m = 7.8 3m = m = m = ,15, m = 3 4m = 4 4m = 7.7 4m = m = m = Reference 12,16, m upstream 4.5 3m = 0.1 (<0.3) Ph Temp. ( o C) D.O. b (mg/l) Cond. c us Velocity (m/sec) a = Ammonia concentrations from samples analyzed at the NEWPCC lab = ( ), other measurements taken using ChemMet kit b D.O. = Disolved Oxygen c Cond. = Conductivity d = Measurements taken at 2m and 4m depth, respectively, are separated by "/" e = Velocity meter not working
61 Station # TABLE 3-7 Water Chemistry Monitoring at Bivalve Placement Stations, Sept. 14, 1999 Bivalve Cage #'s Distance from Outfall (m) Ammonia Concentration a (mg/l) Temp. ( o C) D.O. b (mg/l) 1 2,10, d ,17,24 25 < ,8,14 40 < ,18,23 60 <0.5 [1.5 ] 8.1 [7.4] 14.5 [14.6] [8.8] 520 [550] 3 5,7, <0.5 [1.5] 8 [7.4] 14.5 [14.6] 8.79 [9] 510 [530] 4 11,15, < Reference 12,16, m upstream Ph Cond. c us a = Measurements taken using ChemMet kit b D.O. = Disolved Oxygen c Cond. = Conductivity d = All measurments taken at 3m depth; measurements taken in morning, with those taken in afternoon denoted [ ]. Note: High river velocities resulted in variable plume position. Plume was closer to shore at the time morning measurements were taken. Plume position was variable during the day. During the afternoon, the three stations furthest from the plume were exposed to effluent as indicated by ph of 7.7 or less. Other cages were not moved closer to shore where the plume was due to shallow water.
62 Technical Memorandum No. T1.0 Toxicity-Testing Workstream 3-9 DRAFT 18/04/01 8:12 AM At the end of the exposure period the cages were retrieved from the river (c.f. Table 3-4) and transported to the NEWPCC laboratory for end-of-test (EOT) measurements. For the floater mussels, the number of dead individuals was recorded and all live mussels were measured for WAWW, shell length, tissue weight and shell weight (Figure 3-26) (c.f. Appendix H). Tissues were removed from the shells, weighed and retained for chemical analysis for coprostanol and cholesterol by the Centre Saint-Laurent in Monteal. The ratio of coprostanol to cholesterol ( Cop: Chol ) is a biomarker for exposure to human sewage (Gagne pers. comm. 2000). The purpose of the mussel tissue-chemical analyses was to verify and quantify, if possible, exposure to NEWPCC effluent. The fingernail clams experienced high mortality and therefore, measurements focused primarily on survival rather than growth. Some fingernail clams were measured for WAWW and shell length, but no tissues were collected, weighed, or retained for chemical analysis. Data from the temperature monitors, recorded in 15-minute intervals, were downloaded using the instruments data recovery software following test termination. Water chemistry measurements were made three times throughout the test (i.e. near the beginning, middle and end) to verify exposure concentrations along the dilution gradient in the river Laboratory Test Floater mussels and fingernail clams were exposed to a series of effluent concentrations under semi-static conditions for a period of 66-days and 8-days, respectively. Effluent concentrations ranged between 1.5% and 100% and represented decreasing effluent concentrations from the NEWPCC outfall. The selected exposure concentrations of effluent were intended to correspond to the concentrations expected at the field stations. River water collected manually 0.5 km upstream from the NEWPCC outfall was used to achieve the desired dilutions of effluent. It was also used as the control water. For the laboratory bivalve tests, the test-chambers consisted of 36 inch, PVC pipes capped at the bottom (Figure 3-27). For the floater mussels, 2.5L of test-solution was added to each chamber; 1.0L of test-solution was used for the fingernail clams. Six effluent concentrations (i.e. 100%, 25%, 12.5%, 7%, 3% and 1.5%) plus a control of pure river water were replaced daily according to the procedure described below:


63 muslmeas s\01\0110\22\99 tox Re-measuring Mussels at Termination of Bivalve Tests Figure 3-26


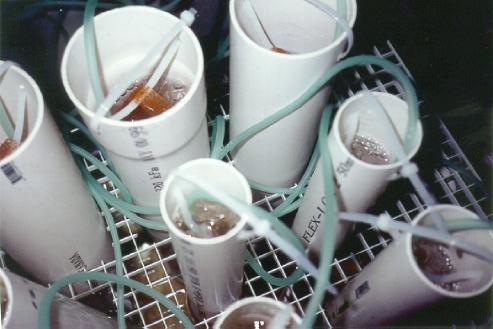
64 Laboratory Bivalve Test Set-up labsetup s\01\0110\22\99tox Figure 3-27
65 Technical Memorandum No. T1.0 Toxicity-Testing Workstream 3-10 DRAFT 18/04/01 8:12 AM 1) Remove bivalves from test-chambers containing 100% river water and 100% treated effluent. Discard and replace old test-solution with daily grab samples of river water and effluent. Replace bivalves. 2) Mix 5-L of treated effluent with 15-L of river water to obtain an effluent concentration of 25%. 3) Remove bivalves from test-chambers containing 25% effluent. Distribute 10-L of the solution mixed in (2) to the test-chambers and replace bivalves. (Note: retain excess 10-L solution). 4) Add 10-L of river water to the 10-L of 25%-solution. (i.e., dilute by a factor of 0.5). 5) Repeat steps (3) and (4) until the mixture has been diluted in half 5 times (i.e., effluent concentration = 1.56%). Three replicate chambers were prepared for each effluent concentration and the controls. Test chambers were distributed between two water baths and secured with plastic screens (cf. Figure 3-27). The water baths were used to maintain an average temperature of approximately 21 o C. The test chambers were aerated continuously at a rate of 235 to 285 ml/min (cf. Appendix A). DO concentrations, ph, temperature, conductivity and NH 3 -N concentrations were measured daily from one replicate of each exposure concentration and control group for each species. Mortality checks were completed at least three times per week for all test chambers and everyday for test chambers containing 100% or 25% effluent. If any dead organisms were found during the mortality check, they were removed from the mesh bags, their lengths were measured and recorded, and they were discarded. On the 14 th day of the floater mussel-test, approximately 0.4 grams of organic material collected from La Salle River were added to each test-chamber to supplement the food supply already present in the effluent river water mixture. From Day 15 until the end of the test on Day 66, 0.1 to 0.4 grams of this organic material, live brine shrimp or dissolved Spirulina algae pellets were added to the test chambers to provide a varied diet for the floater mussels. At test termination, the number of dead floater mussels was recorded and all live mussels were measured for WAWW, shell length, tissue weight and shell weight (Figure 3-26) (c.f. Appendix H). Tissues were removed from the shells, weighed, and retained for chemical analysis for coprostanol and cholesterol by the Centre Saint-Laurent. The net change in mass of each
66 Technical Memorandum No. T1.0 Toxicity-Testing Workstream 3-11 DRAFT 18/04/01 8:12 AM floater mussel from the BOT to EOT was paired with nominal treated effluent concentrations to generate inhibitory concentrations affecting the growth of 50% and 20% of the test-population (c.f. Appendix F). Similarly, percent-survival data were used together with nominal treated effluent concentrations to generate LC 50/20 values for the floater mussels and the fingernail clams (c.f. Appendix F). Growth metrics were not used for response-analysis of fingernail clams to NH 3 exposure Other Invertebrate Testing Ceriodaphnia dubia Two semi-static tests were conducted on Ceriodaphnia dubia over seven days to assess the survival and reproduction of organisms exposed to varying concentrations of NH 3 in (1) Red River water and (2) treated effluent diluted with Red River water. Tests were conducted by ESG International laboratories in Guelph, Ontario, according to Environment Canada protocol (EPS 1/RM/21). Copies of ESG s reports are provided in Appendix I. ESG International Inc. is accredited/certified by the Canadian Association for Environmental Analytical Laboratories (CAEAL) and the Standards Council of Canada (SCC). Two grab samples of Red River water were collected by TetrES personnel and transported in 20 L carboys to ESG International at the start of the study. Similarly, grab samples of treated effluent were shipped on the first, second and sixth days of the tests. Sufficient supplies of effluent were sent on Day 2 to be used on the third, fourth and fifth days of the tests. All river water and effluent samples were stored at a temperature of 6 o C prior to use (c.f. Appendix I). The test-organisms were cultured from ESG stock and only neonates (i.e. <24 hr) were used. Each test consisted of six NH 3 concentrations plus a control group to which 10 replicate testchambers containing one organism each were exposed. Test-organisms were fed 0.2 ml of YCT food and algae once daily. Test-solutions were replenished daily according to the protocol described by ESG in Appendix I. Test-organisms were checked daily for mortality and/or offspring and daily initial and final
67 Technical Memorandum No. T1.0 Toxicity-Testing Workstream 3-12 DRAFT 18/04/01 8:12 AM measurements of temperature, ph, DO and conductivity were obtained. A summary of testconditions for both tests (i.e., T12A&B) is provided in Table 3-1 and Appendix A. Prior to and following daily replacements of river water and effluent test-solutions, ESG personnel collected 30 ml samples of each exposure-solution for analysis by the NEWPCC laboratory. Results are reported in Appendix D. The NH 3 -N data generated was used to calculate NH 3 concentrations as described previously for acute-exposure tests with fish (i.e., Section and Appendix E). Similarly, this information was used together with survival and reproduction data to generate LC 50/20 and EC 50/20 concentrations by linear interpolation (c.f. Appendix F) Hyalella azteca Pollutech Enviroquatics Limited was retained by TetrES to conduct a 28-day, chronic-exposure test and a 96-hr acute-exposure test on Hyalella azteca using ammonia-spiked Red River water. Grab samples of river water were collected from a pump located approximately 0.5 km upstream of the NEWPCC outfall. The water was shipped to Pollutech for use in acclimating the test-organisms and subsequently as the toxicant-containing medium. Details of the testconditions are reported in Table 3-1 and Appendix A. The test procedure was very similar to that used by Borgman (1994), considered the seminal test published to date of Hyalella sensitivity to ammonia. In brief, 104-day old H. azteca were held in one-litre clear plastic cups containing approximately 450 ml of ammonia/river-water solution. Five exposure concentrations ranging between 0.5 mg/l and 8.0 mg/l (total ammonia) plus a control group containing only river water were used for the 28-day test. Organisms used in the 96-hr test were held in 6 different test solutions ranging between 1.9 mg/l and 60 mg/l (total ammonia) plus a control group. The highest nominal exposure concentrations were obtained by the addition of ammonium chloride stock solution to river water in predetermined volumes. The remaining concentrations were made using a half by half dilution series. Five replicates of each exposure concentration and ten replicates of control solution were used during the 28-day test. Each replicate contained 20 organisms each. Two replicates containing 10 organisms each were in place for control and exposure test solutions during the 96-hr test.
68 Technical Memorandum No. T1.0 Toxicity-Testing Workstream 3-13 DRAFT 18/04/01 8:12 AM Test solutions were aerated vigorously prior to use and were replaced as indicated in Appendix A. Appendix A also describes the feeding regimes for these two tests. Survival and reproduction were measured at least once per week during the 28-day test. The number of neonates produced per adult female was used to quantify reproduction rates. Survival rates were monitored daily for the acute-exposure test, but due to the short test duration, reproduction was not an appropriate endpoint. Unionized ammonia concentrations were calculated at the end of each test using testtemperature, test ph and nominal total-ammonia concentration measurements. Temperature and ph measurements were obtained using a VWR ph meter Model Nominal totalammonia concentrations were verified on-site with a Hach kit for both tests and off-site for the 28-day test using an Auto Analyser stationed at the NEWPCC in Winnipeg. Unionized ammonia concentrations together with the respective survival and reproduction data were entered into the ICPIN program and used to derive EC 50/20 and/or LC 50/20 results.
69 Technical Memorandum No. T1.0 Toxicity-Testing Workstream 4. RESULTS 4-1 DRAFT 18/04/01 8:12 AM 4.1 FISH TESTING A key focus of the design of the testing program was satisfaction of applicable test protocols, such as ASTM, OECD, USEPA or Environment Canada. The degree of satisfaction of either ASTM or USEPA protocols for acute- and chronic-exposure toxicity tests conducted with fish is shown in Appendix J, Tables J-1 and J-2. Explanations are provided when test conditions deviated from recommended test-acceptability criteria Acute-exposure Ten acute-exposure tests were completed under static or semi-static conditions using walleye, white sucker and fathead minnow fry. Each test produced a mortality response for 20% and 50% of the organisms in each test population and corresponding LC 50/20 values are documented in Appendix K, Table K-1. Where more than one test was conducted for a single species, the geometric mean of all LC 50 and of all LC 20 values was calculated and is reported in Table 4-1. These data indicate relative sensitivities of fish-species exposed to NH 3 in (a) river water and (b) treated effluent. NH 3 concentrations in spiked river water that were lethal to 50% of the walleye, white sucker and fathead minnow test-organisms (i.e., LC 50 s) were mg/l, mg/l and mg/l, respectively (c.f., Table 4-1). These data suggest the following relative species sensitivity: walleye > white sucker > fathead minnow. However, this trend was not maintained with lower NH 3 concentrations. NH 3 became acutely toxic to 20% of walleye test-populations at mg/l and to white sucker test-populations at mg/l, suggesting that walleye are less sensitive to NH 3 exposure than white sucker. Fathead minnows continued to show the greatest degree of tolerance when tested under local conditions, obtaining an LC 20 value of mg/l. When the relative sensitivities of white sucker and fathead minnows to NH 3 exposure in treated effluent were compared, stressor concentrations that produced mortality responses in 50% or 20% of the test-populations were similar to one another, being values between and 0.298
70 TABLE 4-1: LETHAL CONCENTRATIONS OF NH 3 FOR TEST POPULATIONS OF FISH AFTER ACUTE-EXPOSURE Test Species Pooled LC 50 values (mg NH 3 /L) River Water Spiked with NH 3 Effluent Spiked with NH 3 Pooled LC 20 values (mg NH 3 /L) River Water Spiked with NH 3 Walleye (1) (1) Effluent Spiked with NH 3 White Sucker (3) (3) (3) (3) Fathead Minnow (1) (2) (1) (2) Notes: 1. Pooled refers to the average percent-response of test-organisms in n replicate-exposure vessels (where n = the number of replicates as given in Appendix A). 2. LC x = the concentration of a stressor that is estimated to be lethal to x% of test-organisms over a specific time interval (e.g., 96 hr LC 50). 3. NH 3 = unionized ammonia (i.e., stressor). 4. The number of tests (n) used to derive LC 50 and LC 20 values is given in brackets. When n>1, the geometric mean of the corresponding number of tests is reported. Lethal ammonia concentrations for each test (denoted by test number and duration) are reported in Table K-1, Appendix K. 5. All LC 50/20 values were derived via linear interpolation using the ICPIN program as described in Appendices F and F-1. Main Text Tables.doc (AP)
71 Technical Memorandum No. T1.0 Toxicity-Testing Workstream 4-2 DRAFT 18/04/01 8:12 AM mg/l (c.f., Table 4-1). These results suggests that a threshold limit of NH 3 tolerance in effluent exists at approximately mg/l. Below this limit, the mortality rate is relatively low (<20%), but above this threshold value, mortality rates increase substantially. LC 20 values for fish exposed to NH 3 in river water and effluent are not significantly different, however the tolerance of white sucker and fathead minnow to NH 3 decreased by 22% and 50%, respectively, when they were held in spiked effluent. This suggests a synergistic response between NH 3 and other constituents in treated effluent for these species when the NH 3 concentration is greater than about mg/l. Growth effects were quantified based on whole body dry weights at test termination, but no statistically significant effects were observed. NH 3 concentrations were calculated at end of each test based on daily temperature, ph and NH 3 -N data. These data and results are reported in Appendix E-1, Tables E1-E10. In general, higher NH 3 -N concentrations in test-chambers produced higher NH 3 concentrations. However, 3 of 10 tests using NH 3 -spiked effluent deviated from this trend (i.e., Tests 4A, 4B and 6B). During these tests, exposure vessels containing the highest NH 3 -N concentrations had lower proportions of NH 3 than subsequent exposure concentrations in the dilution series. A substantial reduction in ph was observed at higher exposure concentrations in each of these three tests, and it is likely that the greater percentage of effluent lowered the ph and shifted the ratio of ionized to NH 3 in favour of the former. In general, the number of surviving test organisms decreased with increasing NH 3 exposure and in 6 of 10 tests, and 100% mortality was attained in the highest exposure-concentrations (c.f., Appendix F-1, Tables F1-F10). Partial mortality was observed in at least two exposure concentrations for all tests. The USEPA recommends that survivorship in the controls equal 90% or greater during acute-exposure testing (Appendix J, Table J-1) and in 7 of 10 tests documented here, control group survival was greater than 95%. Higher mortality rates of 30% and 23% were observed in control groups for Tests 1A and 2A&B, respectively but these data were smoothed and adjusted for control-mortality during statistical analysis as explained in Appendix F so that the toxic effects of NH 3 would not be overestimated (c.f., Appendix F). Between six and eight exposure concentrations were used for all 10 acute-exposure tests, but a control group containing 100% river water was in place for only 8 of 10 tests. Where such
72 Technical Memorandum No. T1.0 Toxicity-Testing Workstream 4-3 DRAFT 18/04/01 8:12 AM controls were lacking, test chambers containing the lowest effluent concentration that produced survival rates similar to those experienced by control-organisms in other acute-exposure tests were used as surrogate controls during data analysis (Appendix F-1, Tables F-7 and F-8). DO concentrations for acute-exposure tests measured between 62% and 93% saturation (Appendix L, Table L-1). Tests 1A and B had mean percent saturation values of 78% and 77% plus or minus 17% and 15%, respectively. The variation in DO levels observed throughout Tests 1A and B is typical of non-aerated static testing because the fixed amount of DO present in solution initially is gradually consumed throughout the test. Similar results are reported in the public-domain literature (e.g., Bergerhouse 1992). Tests 6A and B were aerated continuously and therefore maintained DO levels close to the saturation point (i.e., 93% ± 5%) Chronic-exposure Ten semi-static or flow-through chronic-exposure tests ranging in length between 5 and 30 days were completed using white sucker, lake whitefish, and northern pike fry and juvenile channel catfish, fathead minnows, walleye and lake trout. Exposure periods of fish held in the flowthrough laboratory were variable due to: the occurrence of cannibalism in the northern pike (test T18 terminated for this reason after 12 days), a pump failure (test T14 terminated after 5 days); and control-organism mortality greater than 20% (test T15 terminated after 13 days). Tests with lake trout and whitefish were conducted opportunistically, as benchmark tests, but these results will be discussed independently of the derivation of a site-specific Ecological Risk Criterion because the fish are not indigenous to the Red and Assiniboine Rivers. Average NH 3 concentrations and the corresponding mortality or growth effects on test fish as measured by percent survival and dry weights at test termination are tabulated in Appendix F-2, Tables F11-F29. LC 20 results created with these data are reported in Table 4-2 and suggest that northern pike is the most sensitive local species tested, followed by channel catfish and walleye. LC 20 values for these three tests are mg/l, mg/l and mg/l,
73 TABLE 4-2: LETHAL AND EFFECTIVE CONCENTRATIONS OF NH 3 FOR TEST POPULATIONS OF FISH AFTER CHRONIC-EXPOSURE Test Species White Sucker Pooled LC 50 values (mg NH 3 /L) (3A 10 day) a Endpoint: Survival Pooled LC 20 values (mg NH 3 /L) Pooled EC 50 values (mg NH 3 /L) (3B 10 day) b (3B 10 day) b ** (3A 10 day) ** a Endpoint: Growth Pooled EC 20 values (mg NH 3 /L) Channel Catfish (T8 30 day) a (T8 30 day) a ** ** Local Fathead Minnow ** >0.575 (T9 30 day) a ** >0.575 (T9 30 day) a ** (T9 30 day) a Imported Fathead Minnow ** >0.303 (T11 29 day) a ** >0.303 (T11 29 day) a ** ** Walleye ** >0.243 (T21 30 day) a (T21 30 day) a ** ** Northern Pike (T18 12 day) a (T18 12 day) a ** ** Lake Whitefish untreated -treated -treated (T14 5 day) a (T15 5 day) a (T15 13 day) a (T14 5 day) a (T15 5 day) a (T15 13 day) a Not measured Not measured Not measured ** ** Not measured Not measured Not measured Lake Trout (T20 30 day) a (T20 30 day) a ** ** Notes: 1. Endpoint refers to a biological response that can be measured and described quantitatively. Here, survival is quantified as the percentage of live organisms at test-termination; growth is measured as a change (increase/decrease) in body weight (based on dry weights at test-termination) across test-exposure gradients compared to dry weights of the controls. 2. Pooled refers to the average percent-response of test organisms in n replicate-exposure vessels (where n = the number of replicates, as given in Appendix A). 3. NH 3 = unionized ammonia (i.e., stressor). 4. LC x = the concentration of a stressor that is estimated to be lethal to x% of test organisms over a specific time interval (e.g., 10 day LC 50). 5. EC x = the concentration of a stressor that is estimated to be effective in producing a sub-lethal biological response in x% of test organisms over a specific time interval (e.g., 10 days EC 50). 6. Test number and duration of exposure are given in brackets. 7. ** No linear interpolation estimate could be calculated for LC/EC 50 or LC/EC 20 value since none of the pooled group response means were less than 50% or 80% of the control response means, respectively. The LC 50/20 values are logically greater than the highest exposure concentration tested. 8. a Ammonia Source: ammonium chloride (NH 4Cl) b Ammonia Source: treated effluent and NH 4Cl 9. untreated fish were not afflicted with a fungal infection prior to test-start treated fish were afflicted and treated for a fungal infection prior to test-start 10. Reported LC 50/20 and EC 50/20 values were derived via linear interpolation using the ICPIN program described in Appendices F and F-2. Main Text Tables.doc (AP)
74 Technical Memorandum No. T1.0 Toxicity-Testing Workstream 4-4 DRAFT 18/04/01 8:12 AM respectively. White sucker were exposed to NH 3 in both river water and effluent and showed a higher degree of tolerance in 20% of the test population than walleye, regardless of the treatment (i.e., white sucker LC 20 [spiked river water] = mg/l, white sucker LC 20 [spiked effluent] = mg/l versus walleye LC 20 [spiked river water] = mg/l). However, when white sucker were exposed to spiked, treated effluent, 50% of the test population died in mg NH 3 /L, a concentration almost half as much as needed to kill 50% of the population in spiked river water but only 22% greater than needed to kill 20% of the population in spiked effluent. This suggests that there is a constituent in effluent that enhances the toxicity of NH 3 to white sucker at NH 3 concentrations between mg/l and mg/l. No measurable effects on growth were detected during these tests. Test 9 (i.e., local fathead minnows exposed to NH 3 in river water) had a consistently low percent-mortality of approximately 5% for all exposure-concentrations and Test 11 (i.e., imported fathead minnows exposed to NH 3 in river water) had a control mortality of 14% with similar or lower mortality responses in exposure chambers (c.f., Appendix F-2, Tables F-17, F- 19 and Graphs F-17, F-19). Point estimates of lethal NH 3 concentrations could not be computed statistically, but the highest concentrations of NH 3 tested that did not result in significant differences in mortality across exposure gradients in comparison with the controls (i.e., the no-observable-effective-concentration or NOEC) for Tests 9 and 11 are reported in Table 4-2 as mg/l and mg/l, respectively. Growth effects, based on dry weights per fish at test termination, were observed in 20% of the local fathead minnow test population (i.e., T9), yielding an EC 20 of mg NH 3 /L (c.f., Table 4-2). The dry weights and corresponding NH 3 concentrations used to calculate the EC 20 are tabulated in Appendix F-2, Table F-18 and are plotted in Appendix F-2, Graph F-18. Two tests were completed using lake whitefish treated for a fungal infection prior to test start (T15) and disease-free lake whitefish (T14). A pump failure terminated T14 after only 5 days of exposure and results are based on mortality counts obtained prior to the shut-down. Only one exposure concentration (i.e., nominal NH 3 -N concentration = 2.0 mg/l) was affected by the pump failure during Day 2 of T15 and the test was allowed to continue for 11 days. On Day 13, the control mortality had risen to 20% and the test was therefore terminated. The results produced by T14 have been validated with results generated by T15 after 5 days of exposure. The LC 50 and LC 20 values reported in Table 4-2 for these two tests (i.e., LC 50 = mg/l
75 Technical Memorandum No. T1.0 Toxicity-Testing Workstream 4-5 DRAFT 18/04/01 8:12 AM [T14], mg/l [T15]; LC 20 = mg/l [T14], mg/l [T15]) differed by <6%, suggesting that reproducible data had been generated from these tests. However, after 13 days of exposure, the degree of tolerance to NH 3 by 50% and 20% of the lake whitefish testpopulation had dropped to mg/l and mg/l, respectively (c.f. Table 4-2). Lake trout fingerlings held in exposure chambers for 30 days lost 20% of their test population at an exposure concentration of mg/l (cf. Table 4-2). However, the concentration of unionized ammonia required to produce ~50% mortality was mg/l, a concentration similar to that required to produce the same effect on white sucker, lake whitefish and (potentially) on walleye (cf. Table 4-2). NH 3 concentrations were calculated daily and averaged at the end of each test. The temperature, ph and NH 3 -N data used during these calculations have been averaged for presentational purposes and are compiled in Appendix E-2, Tables E-11 to E-21. In 1999, test organisms were exposed to NH 3 concentrations ranging from 0.02 to 0.87 mg/l with background (i.e. Red River) levels of <0.01 mg/l (i.e., T3A, T3B, T8, T9, and T11). In 2000, the NH 3 concentrations ranged from 0.03 to 0.72 mg/l, with background levels of <0.03 mg/l (i.e., T14, T15, T18, T20 and T21). Sufficient DO levels were maintained throughout each chronic-exposure test that oxygen tension ought not to have been a factor in the observed responses (c.f., Appendix L, Table L-2). Test solutions were replaced daily during tests 3A and B and yielded DO concentrations of 68% ± 10% saturation. Tests 8, 9, 11, 14, 15 had continuous test-solution replacement that maintained DO levels near the saturation/super-saturation point. Mean percent-saturation levels dropped to 90% and 87% during Tests 20 and 21 despite continuous-flow conditions, probably because of elevated summer temperatures and higher biochemical oxygen demand (BOD) in the Red River. On Day 13 of T20 and Day 9 of T21, all test chambers were aerated to maintain sufficient DO levels and as a contingency against a pump-failure event. 4.2 BIVALVE TESTING In situ, Chronic-exposure Tests
76 Technical Memorandum No. T1.0 Toxicity-Testing Workstream 4-6 DRAFT 18/04/01 8:12 AM Verifying Plume Exposure in Mussels The late-summer flooding that caused the termination of the test at Day 65 arose from peak flows that changed the dispersion pattern of the NEWPCC effluent plume in the river (c.f. Figure 3-24). As noted in section , high river flows in July, followed by lower late summer (August) flows, followed by high September summer flows, caused changes in the exposures of the in situ test cages to the effluent plume (c.f. Figure 3-25). Notwithstanding efforts to redeploy the cages to remain placed down the centreline of the plume in August and September, variation in river flows revised uncertainty about the extent of consistent exposure of the test organisms to the plume. TetrES accordingly retained the Centre Saint-Laurent of Environment Canada to test mussel tissues for cholesterol and coprostanol as these steroids are considered biomarkers of human sewage. A high-pressure thin-layer chromatographic technique (Hoskin and Bandler 1987) offered the potential for verifying and quantifying chronic exposure to sewage biomarkers and was relied upon for testing of 21 end-of-test ( EOT ) soft-tissue mussel samples from each of the 7 hypothetical plume-centreline monitoring stations. Table 4-3a provides the data on the concentrations of the human fecal steroids in the EOT mussel-tissue samples, and also the coprostanol:cholesterol ( Cop:Chol ) ratio. Table 4-3b provides the same dataset where possible data outliers are removed. These data are presented in graphical format as Figures 4-2a and 4-2b. The data indicate a linear trend for the EOT Cop:Chol ratio with downstream distance from the NEWPCC outfall. Because the ratio is considered a more precise biomarker for human fecal exposures than the concentrations of either coprostanol or cholesterol alone (Gagne pers. comm ), the linearity of the trend lines appears to confirm: chronic exposure to sewage effluent distinct from river-water exposure; that if exposure to the plume was inconsistent over the 65-day exposure period, sufficient quantities of human-sewage steroids present in effluent were nevertheless accumulated in the mussels to demonstrate exposure; and that effluent exposure can be quantified by means of an indirect or inferential measurement (such as the Cop:Chol ratio).
77 TABLE 4-3a Ratio of Coprostanol/Cholesterol in the Complete Mussel Dataset Exposed to the NEWPCC Effluent Distance from Outfall Upstream Referenc e 5 to 25 metres 30 to 100 metres 150 metres Sample identification Station # Coprostanol ug/g Cholesterol ug/g Coprostanol/Cholesterol Average Ratio by Plume Sector Std Dev /16/2001Analysis of the Coprostanol analytical results
78 TABLE 4-3b Ratio of Coprostanol/Cholesterol in the Mussel Dataset Exposed to the NEWPCC Effluent with Outliers Removed Distance from Outfall Upstream Referenc e 5 to 25 metres 30 to 100 metres 150 metres Sample identification Station # Coprostanol ug/g Cholesterol ug/g *' *' *' Coprostanol/Cholesterol Average Ratio by Plume Sector Std Dev Note: "*" values have been removed from the analysis as anomalous results due to the elevated cholesterol values noted. 3/16/2001Analysis of the Coprostanol analytical results
79 Coprostanol/Cholestrol Ratio Upstream Reference 5 to 25 metres 30 to 100 metres 150 metres Distance from the NEWPCC Outfall Figure 4-1a Ratio of Coprostanol/Cholesterol in the Mussels Exposed to the NEWPCC Outfall - Complete Dataset Coprostanol/Cholesterol ratio Upstream Reference 5 to 25 metres 30 to 100 metres Distance From the NEWPCC Outfall 150 metres Figure 4-1b Ratio of Coprostanol/Cholesterol in the Mussels Exposed to the NEWPCC Outfall with Outliers Removed 3/16/2001Analysis of the Coprostanol analytical results
80 Technical Memorandum No. T1.0 Toxicity-Testing Workstream Survival and Growth Responses 4-7 DRAFT 18/04/01 8:12 AM All cages were successfully retrieved after the 65-day deployment period. Survival for floater mussels was very high while survival for fingernail clams was much lower than expected. The study accomplished its major objectives: (1) to evaluate exposure and effects of ammonia associated with effluent from the COW - NEWPCC, and (2) to critically evaluate the utility of existing ammonia criteria based on a combination of laboratory and field toxicity tests. Notwithstanding the evidence of a linear trend in exposure to effluent with distance downstream (cf. Figure 4-1a, 4-1b), there was no statistically significant difference in floater mussel survival among stations. There were, however, differences in growth for several metrics. Length growth rate was the most discriminating metric in terms of detecting differences among stations; length and length growth rate were the most discriminating for establishing relationships with distance from the diffuser and measured ammonia concentrations. Average mussel survival for floater mussels was 98% over the 65-day exposure period. Survival ranged from 95.7% at Station 70 m downstream from the outfall to 100% at Station 150 m downstream from the outfall. Increases in average shell lengths were relatively small but consistent across stations, with an overall average of approximately 3%. Increases in average weight were moderate at all stations, with an overall average of approximately 27%. Average tissue and shell weights increased 26 and 35%, respectively, when compared to the beginning-of-test (BOT) estimates. Length growth rates were calculated to facilitate comparisons with literature values that are commonly expressed in terms of shell length increase per unit time. Length growth rates among stations ranged from to mm/week with an overall average of mm/week (cf. Appendix H). The highest length growth rate were found for mussels at the Reference Station located upstream of the NEWPCC outfall and the lowest at Station 1, the nearest station downstream of the outfall. All mussels in exposure station had significantly lower growth rates than the reference except mussels at Station 5, situated 70 m downstream of the outfall. There was significant fingernail clam mortality that precluded making many of the growth measurements. There was no statistically significant difference in fingernail clam survival among stations, but a statistically significant relationship between survival and distance from the outfall was found. Based on the whole-animal wet-weight measurements made on surviving individuals, there was little to no growth in the fingernail clams during the exposure period.
81 Technical Memorandum No. T1.0 Toxicity-Testing Workstream 4-8 DRAFT 18/04/01 8:12 AM A complete presentation of the results for the in-situ field bioassay is provided under separate cover (i.e., Appendix H) Laboratory, Chronic-exposure Tests Exposure to the various concentrations of effluent produced growth and survival responses in the floater mussels and a survival response in the fingernail clams as shown in Table 4-4. Lethal concentrations of treated effluent to 50% and 20% of the floater mussel test-population after 66 days of exposure are 62.9% and 30.1%, respectively. It should be noted, however, that control mortality, although accounted for during statistical analysis, was high at test termination (c.f., Appendix F-3, Table F-30) and increased from 16% to 39% during the final 11 days of exposure. This result reflects difficulties experienced with holding bivalves for prolonged periods of time in a laboratory setting, particularly in regards to maintaining an adequate food supply, and results should be considered with caution. Growth of the floater mussels, quantified as a net change in weight from the beginning to the end of the test when exposed to low concentrations of treated effluent (i.e., 1.56% and 3%), was enhanced by 23-32% compared with growth of the control organisms (c.f., Appendix F-3, Table F-31 and Graph F-31). This result suggests that in low concentrations, one or more constituents of the treated effluent provided a food source that was unavailable to organisms exposed to pure river water. ANOVA statistical analysis of the dataset indicated growth to be lower in all effluent concentrations except the 1.5% test concentration (c.f., Appendix H). Multiple Range testing failed to identify the lowest effluent exposure as different from the controls (c.f., Appendix H). This is probably due to the fact that any change in growth within the laboratory system was very slight. Growth inhibition to 50% and 20% of the test population exposure was determined, using ICPIN analysis, to be 5.9% and 4.3% treated effluent, respectively (cf. Table 4-4). Because of the high mortality, the fingernail clam test (i.e., T5B) was terminated after 8 days and survival data were generated (c.f., Appendix F-3, Table 32). A mortality-response curve in the data for the fingernail clams indicates an LC 50 of 52.6% and an LC 20 of 22.2% (Table 4-4, Appendix F-3, Graph F-32). No other endpoints were measured for the fingernail clams.
82 TABLE 4-4: LETHAL AND EFFECTIVE CONCENTRATIONS OF TREATED EFFLUENT FOR TEST POPULATIONS OF BIVALVES AFTER CHRONIC-EXPOSURE Test Species Test No./ Duration Pooled LC 50 values (% effluent) Endpoint: Survival Pooled LC 20 values (% effluent) Pooled EC 50 values (% effluent) Endpoint: Growth Pooled EC 20 values (% effluent) Floater mussels T5A - 66 days Fingernail clams T5B 8 days Note: 1. Endpoint refers to a biological-response that can be measured and described quantitatively. Here, survival is quantified as the percentage of live organisms at test-termination; growth is measured as a change (increase/decrease) in net whole animal weight (WAWW) across test-exposure gradients compared to the net WAWW in the controls. 2. Pooled refers to the average percent-response of test organisms in n replicate-exposure vessels, where (n = the number of replicates as given in Appendix A). 3. LC x = the concentration of a stressor that is estimated to be lethal to x% of test organisms over a specific time interval (e.g., 66 day LC 50). 4. EC x = the concentration of a stressor that is estimated to be effective in producing a sub-lethal biological response in x% of test organisms over a specific time interval (e.g., 66 day EC 50). 5. Reported LC 50/20 and EC 50/20 values were derived via linear interpolation using the ICPIN program described in Appendices F and F-3. Main Text Tables.doc (AP)
83 Technical Memorandum No. T1.0 Toxicity-Testing Workstream 4-9 DRAFT 18/04/01 8:12 AM Average DO concentrations were maintained near the saturation point for both bivalve-tests (Appendix L, Table L-3). For the first few days of the test, problems were experienced with the aeration system and DO levels in select test-chambers dropped to concentrations below 50% for short periods of time up to a few hours. After this problem was corrected, aeration was constant for the duration of the test Other Invertebrate Testing Ceriodaphnia dubia Two chronic-exposure tests, 7-days in duration, were completed using Ceriodaphnia dubia neonates. In the first test (i.e., T12A), the neonates were exposed to river water spiked with ammonia; in the second test (i.e., 12B), the neonates were exposed to treated effluent spiked with ammonia. Results of the tests show that NH 3 in river water produces an inhibitory effect on reproduction (measured as the total number of offspring produced during 7 days) in 50% of females at mg/l and in 20% of females at mg/l (Table 4-5). Similarly, NH 3 in treated effluent produced an inhibitory effect on reproduction in 50% and 20% of females at mg/l and mg/l, respectively (Table 4-5). These results, contrary to those produced during acute-exposure tests with fish, suggest that a constituent may be present in the effluent that reduces the toxicity effects of ammonia for this invertebrate. This result is most obvious at lower NH 3 levels that affect up to 20% of the population. Test organisms could tolerate NH 3 levels in spiked effluent that were twice as concentrated as ammonia levels in spiked river water. Average NH 3 concentrations were calculated at the end of each test based on daily testtemperature, test-ph and NH 3 -N data (c.f., Appendix E-3, Tables E22-E23). These values together with the average number of offspring produced in all replicates of each exposure concentration, were analyzed using the linear interpolation method and the ICPIN program (c.f., Appendix F). Appendix F-3, Graphs F-33 and F-34 provide a visual representation of the datasets and the calculated EC 50/20 values. Average DO concentrations reported in Appendix L, Table L-3 were maintained near the saturation point with only a small standard deviation of ± 8%.
84 TABLE 4-5: LETHAL AND EFFECTIVE CONCENTRATIONS OF NH 3 FOR TEST POPULATIONS OF Ceriodaphnia dubia and Hyalella azteca Note: Test Species Pooled LC 50 Values (mg NH 3 /L) Endpoint Survival Pooled LC 20 Values (mg NH 3 /L) Endpoint Reproduction Pooled EC 50 Values (mg NH 3 /L) Pooled EC 20 Values (mg NH 3 /L) Ceriodaphnia dubia Not calculated Not calculated (T12A-7 day) a (T12A-7 day) a (T12B-yday) b (T12B-7 day) b Hyalella azteca >0.783 (T22-28 day) a >0.783 (T22-28 day) a ** (T23-96 hr) a (T23-96 hr) a not measured ** not measured 1. Endpoint refers to a biological response that can be measured and described quantitatively. Here, survival is quantified as the percentage of live organisms at test termination; reproduction is measured as a change (increase/decrease) in the number of neonates produced per female across testexposure gradients compared to the number produced per female in the controls. 2. Pooled refers to the average percent-response of test organisms in n replicate-exposure vessels, where (n = the number of replicates as given in Appendix A). 3. NH 3 = unionized ammonia (i.e., stressor). 4. LC x = the concentration of a stressor that is estimated to be lethal to x% of test organisms over a specific time interval (e.g., 28 day LC 50). 5. EC x = the concentration of a stressor that is estimated to be effective in producing a sub-lethal biological response in x% of test organisms over a specific time interval (e.g., 28 day EC 50). 6. Test number and duration of exposure are given in brackets. 7. **No linear interpolator estimate could be calculated for LC/EC 50 or LC/EC 20 values since none of the pooled group response means were less than 50% or 80% of the control response mean, respectively. The LC 50/20 values are logically greater than the highest exposure concentration tested. 8. a Ammonia Source: ammonium chloride (NH 4Cl) b Ammonia sources: treated effluent and NH 4C1 9. Reported LC 50/20 and EC 50/20 values were derived via linear interpolation using the ICPIN program as described in Appendices F and F-3. Main Text Tables.doc (AP)
85 Technical Memorandum No. T1.0 Toxicity-Testing Workstream Hyalella azteca 4-10 DRAFT 18/04/01 8:12 AM Two tests were completed using Hyalella azteca adults exposed to ammonia spiked river water for 28 days (i.e., T22) or 96 hours (i.e., T23). The longer of the two tests was conducted first and survival or reproduction effects of exposed organisms were not statistically different than responses observed in control organisms. Consequently, the concentration of unionized ammonia required to produce a response in this invertebrate species is greater than mg NH 3 /L, the highest exposure-concentration tested (c.f. Table 4-5). To define the level of unionized ammonia required to generate a response in H. azteca, a 96 hour LC 50/20 test was conducted using toxicant concentrations that were significantly higher than those used during the first test. From these data, it was determined that a 20% lethal-response occurs after 96 hour of exposure to 2.18 mg NH 3 /L (c.f., Table 4-5). Also, 50% of the organisms died when exposed to 3.03 mg NH 3 /L for the same amount of time. Overall, these results suggest that although unionized ammonia is toxic to H. azteca at elevated concentrations, the tolerance level of this organism is high compared to that of many other aquatic organisms (c.f. Tables 4-1, 4-2, and 4-5). The data used to generate these results are recorded in Appendix E-3, Tables E24-E25 and Appendix F-3, Tables F36-F37 and are plotted together with ICP-generated results in Appendix F-3, Graphs F36-F37. Average DO concentrations for the 28 day test were maintained at % saturation. The 96 hour test had average DO concentrations of % saturation (c.f., Appendix L, Table L-3). The former test may have had a slightly lower average DO concentration and higher standard deviation than the latter because test-solutions were replaced less frequently (i.e., once every 3 or 4 days instead of every second day). Also, a greater number of organisms was held in each test-chamber of the 28-day test.
86 Technical Memorandum No. T1.0 Toxicity-Testing Workstream 5. DISCUSSION 5-1 DRAFT 18/04/01 8:12 AM In 1999, the USEPA published its Update of Ambient Water-quality Criteria for Ammonia for the protection of freshwater aquatic life. Both acute and chronic-exposure data are documented. Chronic-exposure data generated in studies reported by the USEPA (1999) can be compared with data derived by TetrES Consultants in the toxicity-testing program for the City of Winnipeg. Table 5-1 tabulates LC/EC 20 s for chronic-exposure studies with three species of fish (i.e., fathead minnows, white sucker and channel catfish) and two species of invertebrates (i.e., Ceriodaphnia dubia and Hyalella azteca) that are common to both the EPA dataset and to TetrES dataset. All public domain results have been converted from total ammonia to NH 3 by reversing the calculations described by USEPA (1999, p. 107). Datasets were considered comparable if test-duration, life-stage of test-organisms, and endpoint-of-interest were the same or similar for a particular species. Fathead minnow survival data showed a high degree of variance between LC 20 s calculated using data generated by Mayes et al. (1986) versus TetrES Consultants. The lethal unionized ammonia concentration affecting 20% of the test-population studied by Mayes et al. (1986) was 0.33 mg/l. Alternately, neither of the two tests conducted by TetrES on fathead minnows produced a lethality response in more than 20% of the population. Therefore, the concentration required to achieve this result is greater than the highest exposure concentration used during the two tests (i.e., >0.58 mg NH 3 /L and >0.30 mg NH 3 /L) (c.f., Table 5-1). These variances may reflect differences between test-conditions used by the two research groups, varying sensitivities between the test-populations or age differences between test-populations. The third suggestion is probable because TetrES conducted tests on juvenile fish whereas fathead minnow fry were tested by Mayes et al. (1983). Generally, fish fry exhibit a higher degree of sensitivity to environmental stressors than older, juvenile fish (USEPA, 1999). Test-conditions established by each of the two research groups were similar; both exposed fathead minnows to various concentrations of dissolved ammonium chloride diluted with river water for 28 to 30 days. However, differences in test-temperatures, test-phs, exposure-technique, and source of river water may have also influenced the relative sensitivities of the two test-populations.
87 Public-Domain results Species *Reference (from USEPA 1999) /Test No. (TetrES) Test Description Endpoint a LC/EC b 20 (mg NH 3 /L) c Fathead minnow Swigert and Spacie (1983) 30-day ELS d test with fry e biomass f N Fathead minnow Mayes et al. (1986) 28-day ELS d test with fry e survival Y TetrES' results Fathead minnow T9 30-day ELS d test with juveniles g growth N Fathead minnow T9 30-day ELS d test with juveniles g survival >0.58 Y Fathead minnow T9 29-day ELS d test with juveniles g survival >0.30 Y Reinbolt and Pescitelli Public-Domain results White sucker (1982 a ) 31-day ELS d test with fry e survival >0.245 Y TetrES ' results White sucker T3A 10-day ELS d test with fry e survival Y Public-Domain results Channel Catfish Swigert and Spacie (1983) 30-day ELS d test with fry e biomass f N Reinbolt and Pescitelli Channel Catfish (1982 b ) 30-day ELS d test with fry e growth N Channel Catfish Colt and Tchobanoglous (1978) 31-day ELS d test with juveniles g survival > <0.936 Y TetrES ' results Channel Catfish T8 30-day ELS d test with juveniles g survival Y Public-Domain results Ceriodaphnia dubia Willingham (1987) 7-day LC h test with neonates i reproduction Y Ceriodaphnia dubia Nimmo et al. (1989) 7-day LC h test reproduction Y TetrES ' results Ceriodaphnia dubia T12A 7-day LC h test with neonates i reproduction Y Public-Domain results Hyalella azteca Borgmann (1994) 10-wk LC h test with neonates i reproduction <0.091 Y TetrES ' results Hyalella azteca T22 28-day LC h test adults reproduction >0.783 Y a - Endpoint refers to a biological response that can be measured and expressed quantitatively b - LC 20 = the concentration of a stressor that produces a mortality-response in 20% of test-organisms EC 20 = the concentration of a stressor that produces an inhibitory, sublethal-response in 20% of test-organisms c- NH 3 = unionized ammonia d - ELS = early life-stage (i.e., from shortly after fertilization through embryonic, larval, or early juvenile development) e - fry = newly hatched or young fish f - biomass = the product of a survival and a growth response g - juvenile = young fish that have not reached sexual maturity h - LC = life cycle (i.e., all life stages including the reproductive cycle) i - neonates = newly hatched (<24hrs) invertebrates Table 5-1 COMPARISON BETWEEN TETRES' RESULTS AND RELEVANT PUBLIC-DOMAIN RESULTS FOR SELECTED CHRONIC-EXPOSURE TESTS Comparable Datasets? new mar 27 table 5-1 TetrES CONSULTANTS INC.
88 Technical Memorandum No. T1.0 Toxicity-Testing Workstream 5-2 DRAFT 18/04/01 8:12 AM A 20% reduction in growth of juvenile fathead minnows studied by TetrES was observed at 0.52 mg NH 3 /L, a concentration more than 1.5X greater than the lethal concentration produced from data generated by Mayes et al. (1986). Also, a 30-day early life-stage test conducted by Swigert and Spacie (1983) reported sublethal responses at concentrations much lower than that required by TetrES test-population (c.f. Table 5-1). The endpoint used by Swigert and Spacie (1983) was biomass, the product of survival and weight data, and generated an EC 20 value of 0.17 mg NH 3 /L. This value is more than 3X lower than the one generated by TetrES (i.e., 0.52 mg NH 3 /L). The greater degree of tolerance to sublethal toxicity-effects exhibited in TetrES test-organisms is consistent with observations noted above and may also reflect differences in life stages of the fish, test-conditions used or relative sensitivities of the test-organisms themselves. Results generated by TetrES regarding NH 3 toxicity to white sucker are comparable with those reported by Reinbolt and Pescitelli (1982a) because both research groups conducted chronicexposure tests with fry using survival as an endpoint. However, the exposure-concentrations used by Reinbolt and Pescitelli (1982a) were not high enough to bracket a 20% reduction in survival and therefore, an undefined concentration greater than 0.25 mg/l, (i.e., the highest exposure-concentration tested) is required to produce this result. This conclusion supports TetrES results of an LC 20 of 0.36 mg/l (c.f., Table 5-1). TetrES test-results with channel catfish are most readily comparable with results generated by Colt and Tchobanoglous (1978). Both research groups conducted ammonia toxicity tests on juvenile channel catfish for one-month using survival as an endpoint. However, LC 50 values generated by these tests vary considerably (c.f. Table 5-1) and results generated by TetrES suggest that channel catfish are approximately 5X more sensitive to unionized ammonia exposure than data reported by Colt and Tchobanoglous (1978) would otherwise suggest. Furthermore, tests conducted by Swigert and Spacie (1983) and Reinbolt and Pescitelli (1982b) using channel catfish fry (i.e., a more sensitive life-stage than juveniles) monitored growth to yield EC 20 's of 0.50 mg NH 3 /L and 0.54 mg NH 3 /L, respectively that are 3X greater than the LC 20 value of 0.17 mg NH 3 /L (c.f. Table 5-1) reported by TetrES. An EC 20 for Ceriodaphnia dubia calculated by TetrES was similar to, but slightly more conservative than, the EC 20 reported by Nimmo et al. (1989) (i.e., 0.50 mg NH 3 /L versus 0.64 mg NH 3 /L). However, both of these studies suggest that the sensitivity of C. dubia to NH 3 is
89 Technical Memorandum No. T1.0 Toxicity-Testing Workstream 5-3 DRAFT 18/04/01 8:12 AM more than two times greater than results produced during a similar test by Willingham (1987) would otherwise indicate. Willingham (1987) reported an EC 20 of 1.30 mg NH 3 /L (c.f. Table 5-1). Finally, tests conducted on Hyalella azteca yield vastly different results as illustrated in Table 5-1. Borgmann (1994) conducted two 10-week life-cycle tests with less than one week old H. azteca and found that reproduction (measured as the number of neonates produced per replicate) in the lowest exposure-concentration tested was compromised by 25% compared to the control group. From these results USEPA (1999) report an EC 20 value of <1.58 mg N/L at ph=7.94 and 25 o C which is equivalent with an EC 20 of <0.09 mg NH 3 /L. Alternately, reproduction was not affected by 20% at unionized ammonia concentrations up to 0.78 mg/l in H. azteca tested by Pollutech and reported by TetrES. This test was conducted for 28 days using adult amphipods, but these variations in test-protocols cannot fully explain the 9-fold increase in tolerance levels of H. azteca to unionized ammonia. The more probable explanation is that a constituent of Red River water reduces the toxicity effects of unionized ammonia to Hyalella observed by Burgmann. In general, the local tests indicated both more and less sensitivity than the public domain dataset for the same species. No simple trend was observed indicating the importance of comprehensive testing of local species using local river water to develop criteria.
90 Technical Memorandum No. T1.0 Toxicity-Testing Workstream 6-1 DRAFT 18/04/01 8:12 AM 6. SUMMARY AND CONCLUSIONS Throughout the Toxicity Workstream, 26 ammonia toxicity tests were completed on 11 different species of aquatic life including 7 fish species and 4 invertebrate species. This is a considerable technical accomplishment when compared with: 27 tests completed on 13 species which were found to be technically acceptable in an Environment Canada literature review of world-wide ammonia toxicity tests used to evaluate the toxicity of ammonia and in deriving a national protective criteria for Canada; and 28 tests completed on 12 species accepted by the USEPA in its world-wide literature review of the tests applicable for deriving a protective ammonia criteria for the USA. Of the tests completed, in the present study, seven can be used directly in the derivation a chronic-criteria for ammonia. These tests were conducted on five fish species and two invertebrate species. Each test meets the objective of being an in-laboratory chronic-exposure test, using ammonia spiked river water (as opposed to effluent spiked river water), on local species found in the Red and Assiniboine rivers. A summary of these tests and the LC 20 or EC 20 values for each species is given in Table 6-1. Three of the tests were completed using the most sensitive key sport species, northern pike, channel catfish and walleye and have very good time-exposure-mortality datasets which can be used in the development of speciesspecific risk assessments. Ten acute-toxicity tests were done on three fish species using both NEWPCC effluent and ammonia treatments. Resulting LC 20 values are very similar despite the treatment and consequently, these tests confirm that ammonia is likely the main toxicant in NEWPCC effluent. Four tests on two species of bivalves were done both in the laboratory and in situ downstream of the NEWPCC discharge-plume. The exposure to effluent of the in situ test was confirmed using coprostanol/cholesterol ratio. This ratio is considered a biomarker for human fecal exposures. The in-laboratory testing of bivalves showed signs of high mortalities in the controls indicating that laboratory testing of bivalves is difficult due to problems with feeding. The in situ bivalve tests assessed the impact of NEWPCC effluent (rather than ammonia only) and
91 Fish Invertabrates Common Name Species Name Number of tests Un-ionized Ammonia µg/l¹ Catfish Ictalurus punctatus Fathead Minnow Northern Pike Pimephales promelas Esox lucius Walleye Stizostedion vitreum White Sucker Catostomus commersoni Ceriodaphnia dubia Hyalella azteca 1 >780 TABLE 6-1 Summary of Tests to be Used Directly in Criteria Development Test Type EndPoint² Duration Days Mean ph³ Mean Temperature³ ºC Flow Through LC Flow Through EC20-Growth Flow Through LC Flow Through LC Semi Static LC Semi Static EC20-Reproduction Semi Static LC20 EC- 20 Reproduction Notes: 1. All Tests used Ammonium Chloride as ammonia source (rather than effluent) and Red River water for dilution. 2. The lowest of either the LC20 (lethal concentrations at with 20% mortality) or EC20 (effective concentration with 20% reduction and specific effect) was used as the critical endpoint in criteria development 3. Temperature and ph varied throughout the test (details given in Appendix A) MAR 29 TABLE 6-1.xls TetrES Consultants Inc.
92 Technical Memorandum No. T1.0 Toxicity-Testing Workstream 6-2 DRAFT 18/04/01 8:12 AM therefore are useful as other lines-of-evidence to corroborate that the site-specific criteria selection is appropriate.
93 Technical Memorandum No. T1.0 Toxicity-Testing Workstream 7. REFERENCES 7-1 DRAFT 18/04/01 8:12 AM 7.1 LITERATURE CITED American Society for Testing and Materials (ASTM) Biological Effects and Environmental Fate, Biotechnology; Pesticides. Volume Water and Environmental Technology. Bergerhouse, D.L Lethal effects of elevated ph and ammonia on early life stages of walleye. North American Journal of Fisheries Management. 12: Camp Dresser & McKee Site-Specific Limits for Un-ionized Ammonia Red River of the North for the City of Moorehead, Minnesota. March Canadian Council of Ministers of the Environment (CCME) Canadian environmental quality guidelines. Canadian Council of Ministers of the Environment, Winnipeg, Manitoba. CCME The Canadian Council of Ministers of the Environment Business Plan Winnipeg, Manitoba. Chapman, P.M., A. Fairbrother and D. Brown A critical evaluation of safety (uncertainty) factors for ecological risk assessment. Environ. Tox. And Chem. 17: Clean Environment Commission Report on Public Hearings. Application of Water Quality Objectives for the Watershed Classification of the Red and Assiniboine Rivers and Tributaries Within and Downstream of the City of Winnipeg. Winnipeg. June pp. Clesceri, L.S., A.E. Greenburg and A.D. Eaton, eds Standards and methods for the examination of water and wastewater. 20 th Edition. American Public Health Association, American Water Works Association and Water Environment Federation, Maryland, U.S.A. Colt, J. and G. Tchobanoglous Chronic Exposure of Channel Catfish, Ictalurus punctatus, to Ammonia: Effects on Growth and Survivor Aqueculture 15: Emerson, K., R.C. Russo, R.E. Lund and R.V. Thurston Aqueous ammonia equilibrium calculations: effect of ph and temperature. J. Fish. Res. Board Can. 32: Environment Canada Ammonia in the aquatic environment. Canadian Environmental Protection Act Priority Substances List II, Supporting Document. Draft version. Environment Canada, Ottawa, Ontario, Canada. Environment Canada/Health Canada Priority Substances List Assessment Report Ammonia in the Aquatic Environment. May Draft Report for Public Comments. 125 pp. Kemper, B.J., W. Kindzierski, C. Gaudet, D. Moore Evaluation of risk-based approaches in environmental guideline and standard setting. Part 1: Executive and Policy Summary. Prepared for Canadian Council of Ministers of the Environment, Winnipeg, Manitoba. By Kemper & Associates Inc.
94 Technical Memorandum No. T1.0 Toxicity-Testing Workstream 7-2 DRAFT 18/04/01 8:12 AM MacLaren Plansearch Inc Ammonia Toxicity and Red River Fish. Report to City of Winnipeg Waterworks, Waste and Disposal Department. Winnipeg. Mayes, M.A., H.C. Alexander, D.L. Hopkins, and P.B. Latvaiks Acute and Chronic Toxicity of Ammonia to Freshwater Fish: A Site-Specific Study. Environ. Toxicol. Chem.5: Moore, D.R.J. and P.-Y. Caux Estimating low toxic effects. Environ. Toxicol. Chem.16: Nimmo, D.W.R. D. Link, L.P. Parrish, G.J. Rodriguez, W. Wuerthele, and P.H. Davies Comparison of ON-Site and Laboratory Toxicity Tests: Derivation of Site-Specific Criteria for Un-ionized Ammonia in a Colorado Transitional Stream. Environ. Toxicol. Chem.8: NRC Science and Judgment in Risk Assessment. National Research Council of Canada, Ottawa. Reinbold, K.A., and S.M. Pescitelli. 1982a. Acute Toxicity of Ammonia to the White Sucker Report to U.S. EPA by the Illinois Natural History Survey, Champaign, IL. Reinbold, K.A., and S.M. Pescitelli. 1982b. Acute Toxicity of ammonia to Channel Catfish. Report to U.S. EPA by the Illinois Natural History Survey, Champaign, IL. Swigert, J.P. and A. Spacie Survival and Growth of Warmwater Fishes Exposed to Ammonia Under Low Flow Condition. PB National Technical Information Service, Springfield, VA. TetrES Consultants Inc Responses to Clean Environment Commission Recommendation No. 6 and Other guidance regarding Regulation of Unionized Ammonia. Report to City of Winnipeg Waterworks, Waste and Disposal Department. Winnipeg. TetrES Consultants Inc Information Package Ammonia Study Workshop #1. Report to City of Winnipeg Waterworks, Waste and Disposal Department. Winnipeg. TetrES Consultants Inc. 1999a. Red and Assiniboine Ammonia-Criteria Study DRAFT WORKPLAN. Report to City of Winnipeg Waterworks, Waste and Disposal Department. Winnipeg. TetrES Consultants Inc. 1999b. Red and Assiniboine Criteria Study WORKSHOP REPORT PHASE 2. Report to City of Winnipeg Waterworks, Waste and Disposal Department. Winnipeg. United States Environmental Protection Agency (USEPA) Manual for the evaluation of laboratories performing aquatic toxicity tests. EPA/600/4-90/031. United States Environmental Protection Agency (USEPA) Methods for measuring the acute toxicity of effluents and receiving waters to freshwater and marine organisms. 4 th Edition. EPA/600/4-90/027F.
95 Technical Memorandum No. T1.0 Toxicity-Testing Workstream 7-3 DRAFT 18/04/01 8:12 AM United States Environmental Protection Agency (USEPA) Short-term methods for estimating the chronic toxicity of effluents and receiving waters to freshwater organisms. 3 rd Edition. EPA/600/4-91/002. United States Environmental Protection Agency (USEPA) Update of ambient water-quality criteria for ammonia. Office of Water. EPA 822-R , August United States Environmental Protection Agency (USEPA) Update of ambient water-quality criteria for ammonia. EPA 822-R , U.S. Environmental Protection Agency, Washington, D.C. USA. Wardrop Engineering Inc./TetrES Consultants Inc The Red and Assiniboine Rivers Surface Water Quality Objectives. Report to the City of Winnipeg Waterworks, Waste and Disposal Department. Winnipeg. Willingham, T Acute and Short-term Chronic Ammonia Toxicity to Fathead Minnows (P. mephales promelas) and Ceriodaphnia dubia using Laboratory Dilution Water and Late Mead Dilution Water. U.S. EPA, Denver, CO. 40 pp.
96 APPENDIX A AQUATIC TOXICITY-TEST CONDITIONS
97 APPENDIX A AQUATIC TOXICITY TEST CONDITIONS FISH TESTS INVERTEBRATE TESTS Acute-Exposure Warmwater Test Conditions a Chronic-Exposure Coldwater Test Conditions Chronic-Exposure Warmwater Test Conditions Chronic-Exposure Warmwater Test Conditions TEST NUMBER 1A 1B 2A/2B 3A/3B 4A 4B 6A/6B A 5B 12 A/B SPECIES - Common Name - Scientific Name Walleye Stizostedion vitreum White Sucker Catostomus commersoni White Sucker Catostomus commersoni White Sucker Catostomus commersoni White Sucker Catostomus commersoni Fathead Minnow Pimephales promelas Fathead Minnow Pimephales promelas Channel Catfish Ictalurus punctatus Fathead Minnow Pimephales promelas AGE at Test Start 8 days 18 days 24 days 29 days 39 days 72 hours 72 hours 117 days ~ 90 days b days 2½ - 3 weeks 3-3½ weeks 1½ weeks 5-5½ months 39 days 1 3 years 1 3 years < 24 hrs 104 days 28 days LIFE-CYCLE STAGE c fry fry fry fry fry fry fry juvenile juvenile juvenile d fry fry fry juvenile juvenile neonate adult adult WET WEIGHT ~ 1.7 mg e ~ 1.98 mg e, f ~ 3.1 mg e ~ 3.5 mg e ~ 7.4 mg e ~.46 mg e ~.46 mg e ~ 5000 mg ~ 1300 mg ~ 47 mg SOURCE TEST TYPE (Static, Semistatic, flow-through) SERM Fish Cultural Statio n (SK) Grand Rapids (Cedar Lake) (MB) Grand Rapid s (Cedar Lake) (MB) Grand Rapids (Cedar Lake) (MB) Grand Rapids (Cedar Lake) (MB) Aquatic Biosystems Inc. (CO, USA) Aquatic Biosystems Inc. (CO, USA) Aquatic Research Organisms (NH, USA) Local Drainage Pond/Winnipeg (MB) Fathead Minnow Pimephales promelas Aquatic Resources (CA, USA) Lake Whitefish (not diseased) Coregonus clupeaformis Lake Whitefish (treated for a fungal infection prior to test start) Northern Pike Esox lucius Lake Trout Salvelinus namacycush Walleye Stizostedion vitreum Floater Mussels Pyganodon grandis not measured not measured ~.23 mg e 650 mg mg weight: 1.8 g length: 26.6 mm Grand Rapids Hatchery (MB) Grand Rapids Hatchery (MB) Static Static Semi-static Semi-static Semi-static Semi-static Semi-static Flow-through Flow-through Flow-through Flow-through Flow-through Flowthrough DURATION 96 hrs 96 hrs 96 hrs 96 hrs 10 days SERM Fish Cultural Sta tion (SK) Grand Rapids Hatchery (MB) Leonard s Walleye Culture (ON) La Salle River (MB) Fingernail Clams Sphaerium simile weight: g length: mm La Salle River (MB) Daphnia Ceriodaphnia dubia not measured ESG International s stock (ON) Flow-through Flow-through Semi-static Semi-static Semi-static 96 hrs 96 hrs 72 hrs 30 days 30 days 29 days 5 days 13 days 12 days 30 days 30 days 66 days 8 days 7 days Amphipod Hyalella azteca not measured AIB (Amphipods in Bioassays) (ON) Semi-static Amphipod Hyalella azteca not measured offspring of adults used as controls in T22 Semi-static 28 days 96 hrs EXPOSURE VOLUME 600 ml 600 ml 500 ml 500 ml 500 ml 500 ml 750 ml 10 L 10 L 1 L 700 ml 700 ml 700 ml 8 L 8 L 2.5 L 1 L 15 ml 450 ml 450 ml REPLACEMENT RATE none none 500 ml/d 500 ml/d 500 ml/d 500 ml/d 750 ml/d 200 ml/min 200 ml/min 200 ml/min 400 ml/min 400 ml/min 400 ml/min 400 ml/min 400 ml/min 2.5 L/d 1.0 L/d 15 ml/d 450 ml per 3-4d NUMBER OF ORGANISMS/VESSEL NUMBER OF REPLICATES/CON AERATION RATE (ml/min.) none none none none none none ~ 45 ml/min none none none none none none ~310 ml/min ~310 ml/min ~ 235mL/min ~ 285mL/min D.O. RANGE: mean ± SD (mg/l) g TEMPERATURE RANGE: mean ± SD ( C) g 8.1 ± ± ± hrs 7.4 ± days 6.9 ± ± ± ± hrs 17.5 ± days 17.5 ± 1.0 PH RANGE (min max) g hrs days FOOD TYPE FEEDING RATE Notes: Liquid Baby Fish Food 1 drop on day 3 Liquid Baby Fish Food 1 drop on day 3 Not fed Live Shrimp Brine Live Shrimp Brine Live Shrimp Brine n/a 2 x daily ~ 4.4 mg dry wt. 7.9 ± ± ± ± ± ± ± ± ± ± ± ± ± A: 8.4 ± B: 8.6 ± ± ± ± ± ± ± ± ± ± ± ± ± ± A: 24.0 ± B: 24.0 ± A: B: x daily ~ 4.4 mg dry wt. 2 x daily ~ 4.4 mg dry wt. Live Shrimp Brine Trout Chow Trout Chow Live Shrimp Brine 2 x daily ~ 4.4 mg dry wt. Day 1-23: 1.0g Day 24-30: 1.5g Day 1-23: 1.0g Day 24-30: 1.5g 0.2 g x 2 daily wet weight Kyowa 400B dry food Kyowa 400B dry food live daphnia 3 x daily 0.06g 3 x daily 0.06g 2.6 g 3x daily (a) live daphnia or (b) trout chow 3 x daily (a) 2.6 g or (b) 1.7g (a) live daphnia or (b) frozen daphnia 3 x daily (a) 2.6 g or (b) 2.7g Varied organic material collected from LaSalle River, newly hatched brine shrimp, Spirulina algae g daily b/w Days Not fed n/a 450 ml on Day Control 10 Other 5 none None None YCT and algae 0.2 ml daily 6.5 ± ± ± ± Tetra Min ground food 5 mg 3x/wk (min) 2 Not fed n/a a 2 of the 10 tests (i.e., T3A/T3B) also include a chronic-exposure test because statistical analysis was done on data collected after 96 hrs (i.e., acute-exposure) and 10-days (i.e., chronic-exposure) b fish were captured locally, therefore, exact age approximated c Fry = very young or newly hatched fish; Juvenile = young fish that have not reached sexual maturity; Neonates = newly hatched (<24 hrs) invertebrates d age class is similar to that of white sucker (T4A) which are denoted as fry, but the mean weight is 6 times greater, so the fathead minnow test population for T11 is denoted as juvenile e dry weights were measured and converted to wet weights based on body-water:tissue ratio of 77.8%:22.2% f dry weights were determined by graphical extrapolation of fish weight data from T2A/B, T3A/B, T4A g only control group test conditions reported TetrES CONSULTANTS
98 APPENDIX B LIVE FISH COLLECTION AND HANDLING PERMITS
99
100
101
102
103
104
105
106
107
108
109
110
111
112 APPENDIX C PREPARATION OF TEST-SOLUTIONS FOR STATIC AND SEMI-STATIC TESTS CONDUCTED ON FISH
113 Ammonia Stock Preparation: Time Prepared: beginning of test Ammonia Source: ammonium chloride (NH 4 Cl) Desired stock concentration: 1 mg NH 3 -N/ml solution Q: To prepare 1000 ml of stock with an NH 3 -N concentration of 1.0 mg/ml, 1000 mg NH 3 -N is needed. NH 3 -N is obtained through the addition of NH 4 Cl to deionized water. How many grams of NH 4 Cl are required to produce the desired concentration? Molecular weight of N = µ Molecular weight of NH 4 Cl = µ So, 1.0g NH 3 -N = µ x g NH 4 Cl µ x = 3.82 g NH 4 Cl A: 3.82 g NH 4 Cl must be added to each 1.0 L of deionized water to prepare an ammonia-stock with 1.0 mg NH3-N/mL solution. Procedure for Preparing River Water (RW) Stock: Time Prepared: (a) prior to initiation of static-tests (b) prior to initiation of semi-static tests and once daily in 24hr intervals following test-start Assume: (1) Test-solution volume = 500 ml (2) Highest nominal N-NH 3 concentration = 32 mg/l Procedure: (1) Pour 32 ml of ammonia-stock (@1.0 mg NH 3 -N/mL) into a 1.0 L graduated cylinder and fill to 1.0 L with river water (i.e. concentration = 32 mg/l) (FigureC-1).


114 dilute s\01\0110\22\99tox Preparing Ammonia Test Solutions for Static and Semi-static Fish Toxicity tests Figure C-1