The Land/Ocean Biogeochemical Observatory data set: what s it good for? Ken Johnson & lots of LOBO personnel MBARI
|
|
|
- Felicity Boone
- 5 years ago
- Views:
Transcription

1 The Land/Ocean Biogeochemical Observatory data set: what s it good for? Ken Johnson & lots of LOBO personnel MBARI
2

3
4 Atm. CO2 (ppmv) The Keeling Curve, Atmospheric CO 2 measured at Mauna Loa 01/55 01/65 01/75 01/85 01/95 01/05 Charles David Keeling's measurements of the global accumulation of carbon dioxide in the atmosphere set the stage for today's profound concerns about climate change. They are the single most important environmental data set taken in the 20th century. C. Kennel

5

6
 is all about sensors, software and platforms to observe change in the coastal")
7 Environmental chemistry data are often the best record of environmental change. Easy to do in the atmosphere, can we do it in the ocean? That s what the Land/Ocean Biogeochemical Observatory (LOBO) is all about sensors, software and platforms to observe change in the coastal ocean.
8

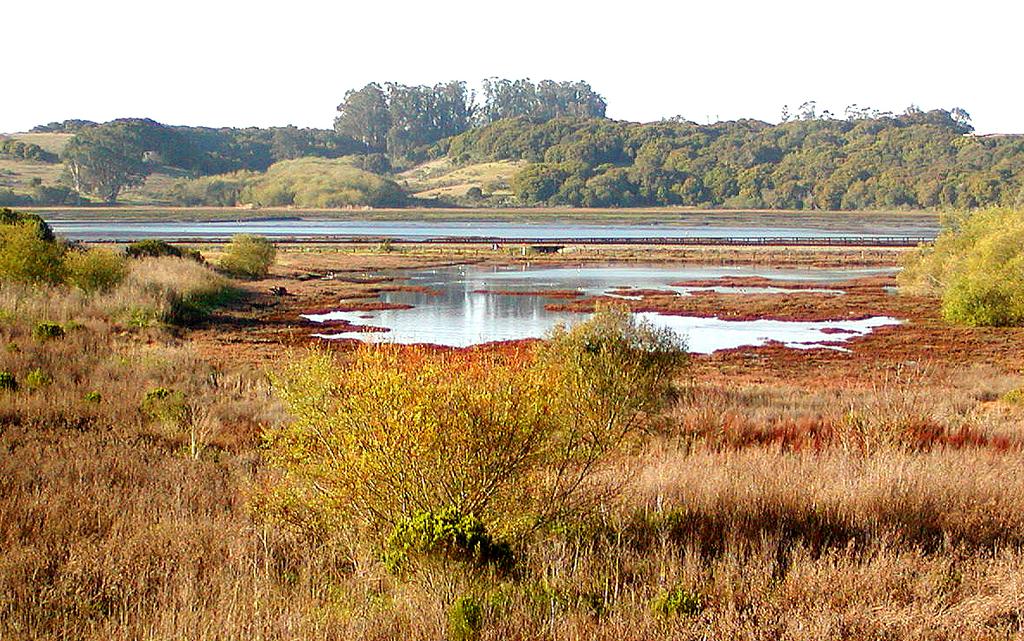
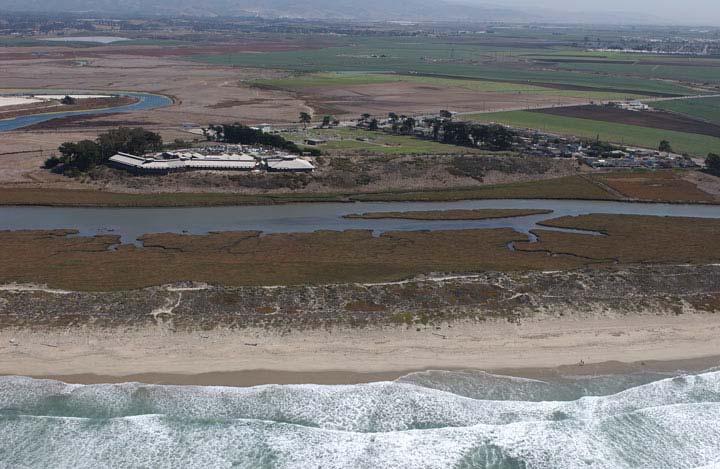
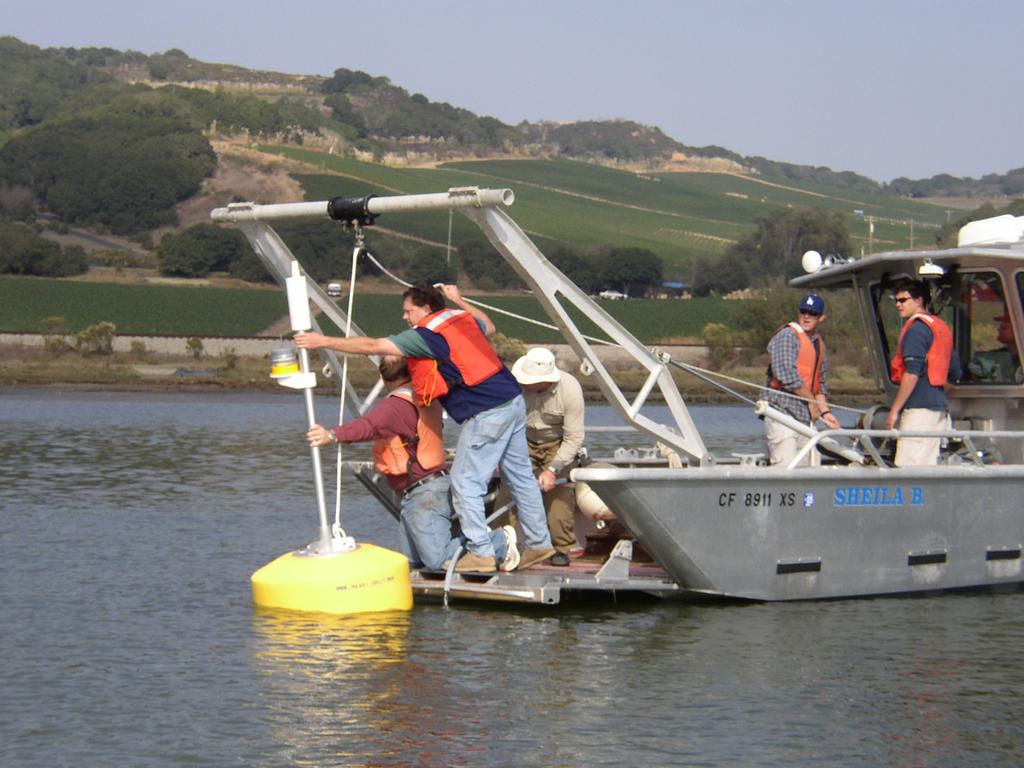
9 Goals of the Land/Ocean Biogeochemical Observatory (LOBO) Project Design and operate an autonomous network of chemical sensors to study the biogeochemistry of complex coastal environment. Elkhorn Slough National Estuarine Research Reserve Demonstrate the potential of an extended chemical sensor networks to significantly improve our observational capabilities and advance our understanding of ecosystem biogeochemistry. AVIRIS photo courtesy of John Ryan, MBARI


10 What types of processes can we observe? How can these observations be used to manage the environment? Ecosystem Based Management Can we use this system as an educational tool? How do observations relate to California Science Standards?
11 2006/December/19/local/stories/04local.ht m
 Note not true in fresh water P is limiting.")
12 Effect of nutrients on plant growth in experimental mesocosms (Fig. 3-1, Clean Coastal Waters, Natl. Acad. Press) Note not true in fresh water P is limiting. Chlorophyll Primary Production Control +N + P + N&P
 now equals natural rate.")
13 Human production of fixed nitrogen (nitrate, ammonia, urea) now equals natural rate. Original source, Vitousek et al.
14 Cloern 2001

15


16 Plants sink from the surface and, in subsurface waters bacteria consume oxygen, which can t be replenished from the atmosphere.

17 Results of hypoxia off Oregon coast but probably not from eutrophication
18
19
20 US farmers in the mid 1990's actually use less fertilizer than they did in the early 1980's! Fertilizer use in developing countries surpassed use in developed countries for the first time in China is now the world leader, with the US in second place. This is a big change -- in 1960, the developing world accounted for only about 12 % of world fertilizer use, whereas by 2002, that percentage had increased to ~ 60 %.
21 Global fertilizer use per person Grain area per person
22 Norman Borlaug, father of the Green Revolution and 1970 Nobel Peace Prize winner -- the application of low-cost nitrogen derived from synthetic ammonia, has become an indispensable component of modern agricultural production (nearly 80 million tonnes consumed annually). It is estimated that 40% of today s 6 billion people are alive, thanks to the Haber-Bosch process of synthesizing ammonia (Borlaug, 2000). You can t just stop using fertilizer! Presumably, one has to offer an alternative, which might be more efficient use of fertilizer.
23

24
25

26


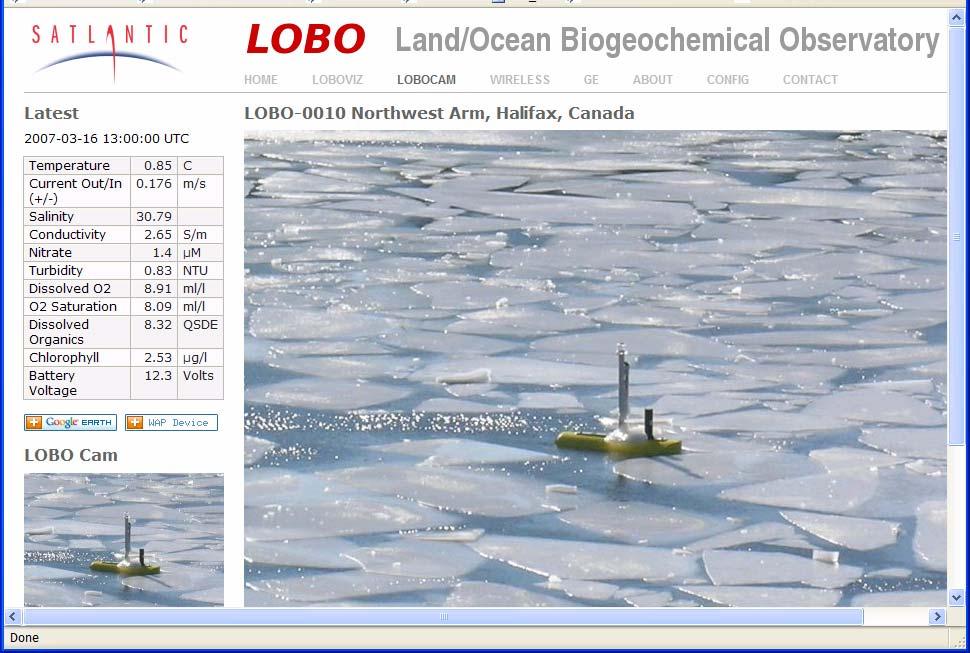
27 Data access is available through LOBOViz an online program for creating user defined graphs of LOBO data LOBO on the WEB - lobo
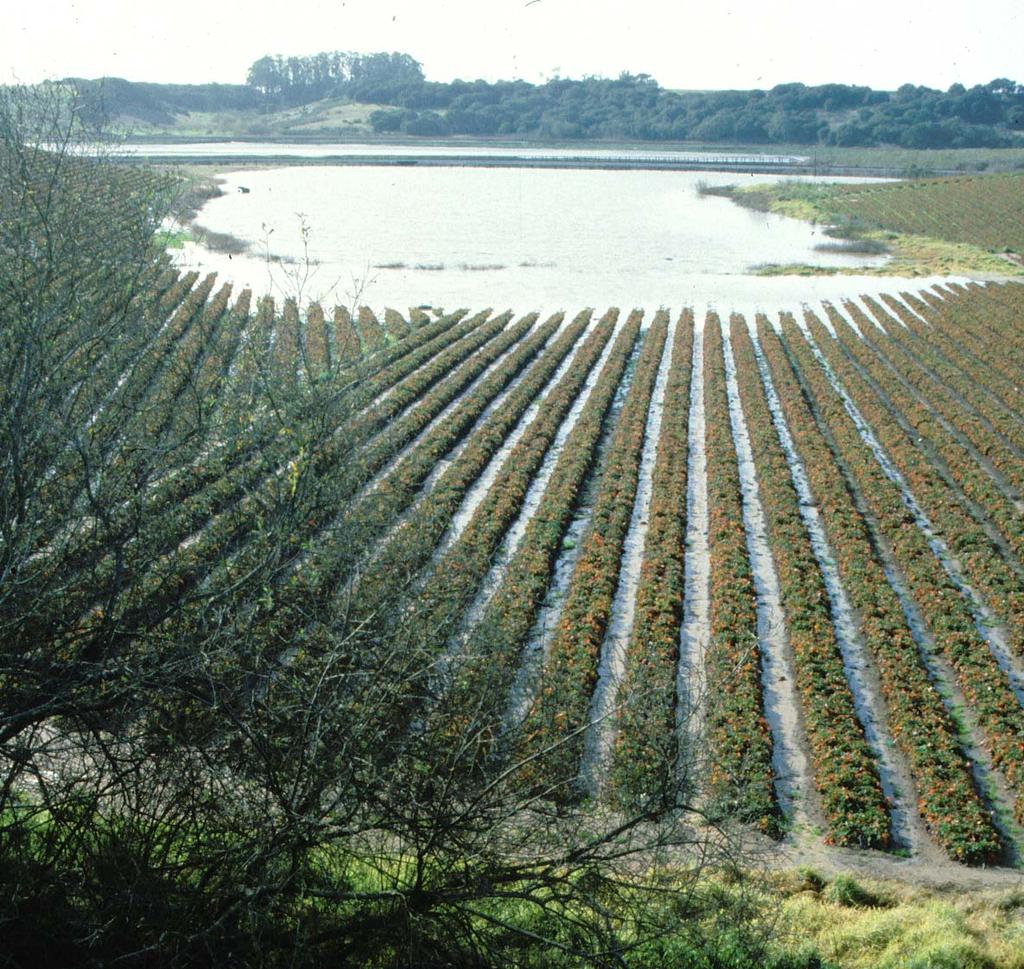
28 Past Management Plans The most serious problem in Elkhorn Slough is the erosion of wetland habitats from tidal currents Elkhorn Slough Wetland Management Plan (ABA Consultants 1989, prepared for the CA State Coastal Conservancy and Monterey County Planning Department) The manipulation of marsh hydrology is one of the most serious threats to Elkhorn Slough resources strategies include identifying actions and policies that reduce tidal scouring Elkhorn Slough Watershed Conservation Plan, (Scharffenberger 1999, prepared for the ESF and TNC)


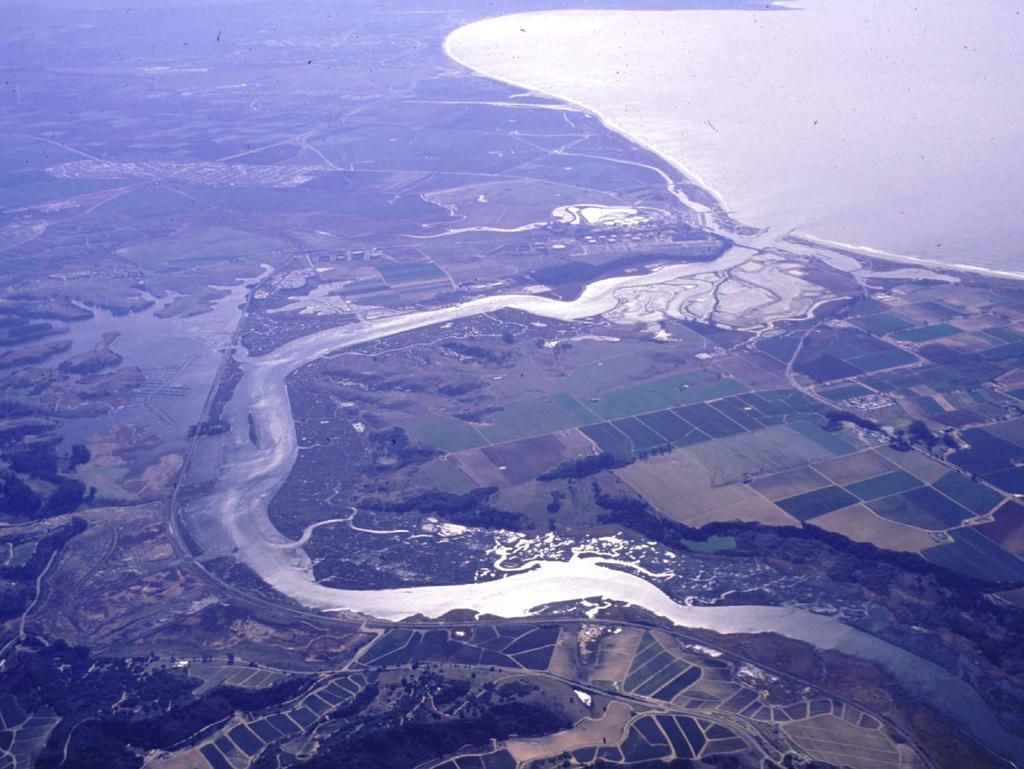
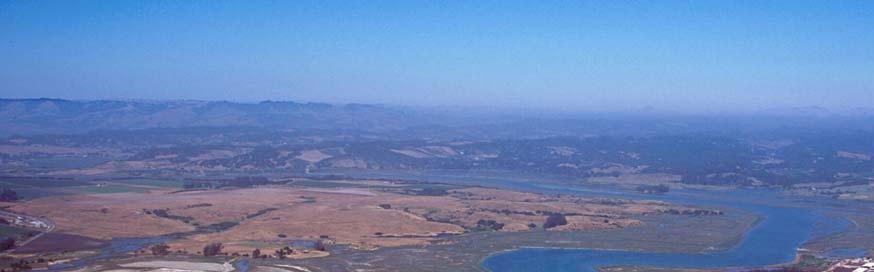
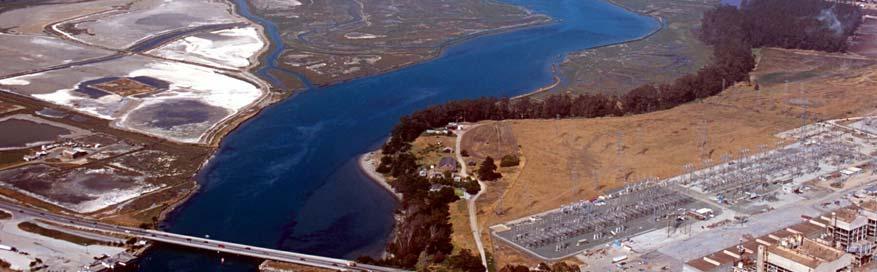
29 TIDAL EROSION INCREASED TIDAL FLOW DUE TO ARTIFICIAL MOUTH 1854, Coastal Geodetic Survey Map Note mouth north of main channel 1999, Infrared Aerial Photograph Note mouth in line with main channel
30 Generalized focus of principal investigators on EBM grant HUMAN FRAMEWORK HUMAN USES / VALUES KEY SPECIES HABITAT EXTENT ECOSYSTEM ASSETS & SERVICES WATER QUALITY PHYSICAL DRIVERS K. Johnson HUMAN IMPACTS RESTORATION STRATEGIES POLICY OPTIONS
31 Ecosystem Based Management HABITAT EXTENT Extent of salt & brackish marsh, mudflat, & channel habitat WATER QUALITY Salinity, dissolved oxygen, turbidity, nutrients, pollutants PHYSICAL DRIVERS Geomorphology Topography, bathymetry, tectonics Tidal exchange Tidal range, velocities Sediments Supply, size and deposition Freshwater inputs Rivers and groundwater Climate Freshwater, storms, sea level HUMAN ALTERATIONS Tidal restriction diking/ draining Artificial mouth increased tidal prism Polluted inputs Nutrients and pesticides in sediments and freshwater River diversion Salinas redirected Groundwater overdraft for agriculture Global warming sea level rise MANAGEMENT STRATEGIES Restore formerly diked sites increase tidal prism in stagnant restricted areas; add sediment to restore elevation of subsided areas Decrease tidal exchange to some of the undiked areas Reduce pollution improve land use practices Re-connect rivers Re-establish riverine sediment sources Increase freshwater Inputs or retention patterns Allow migration Purchase land upstream to allow estuarine migration
32 Focus of this talk hydraulic change, water quality, options. Data and models. PHYSICAL DRIVERS HABITAT EXTENT Extent of salt & brackish marsh, mudflat, & channel habitat Tidal exchange Tidal range, velocities WATER QUALITY Salinity, dissolved oxygen, turbidity, nutrients, pollutants Sediments Supply, size and deposition Freshwater inputs Rivers and groundwater HUMAN ALTERATIONS Tidal restriction diking/ draining Artificial mouth increased tidal prism Polluted inputs Nutrients and pesticides in sediments and freshwater River diversion Salinas redirected Policy Options Restore formerly diked sites increase tidal prism in stagnant restricted areas; add sediment to restore elevation of subsided areas Decrease tidal exchange to some of the undiked areas Reduce pollution improve land use practices MANAGEMENT STRATEGIES
33 Water quality issues: External sources of nutrients: historically EXTREMELY high Internal sources of nutrients: sediments (~15% organic carbon) are LARGE sources of ammonia. Nutrients lead to high organic carbon production potential for oxygen loss worsens as tidal exchange rates diminish. Conclusions: Hydraulic solutions to the erosion problems may well exacerbate water quality.

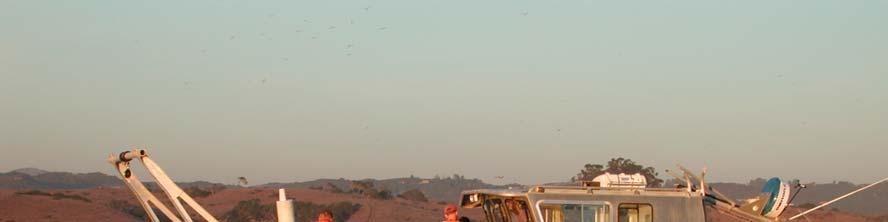
34 LOBO chemical sensor network: Next 2 slides at L01

35 One year of nitrate in Elkhorn Slough and nutrient-rich Monterey Bay. 3 ppm 2 ppm 1 ppm 0.15 ppm Green line is Chesapeake Bay target level for inorganic nitrogen.
36 Nitrate source external: appears on rising tide. 1 ppm 0.15 ppm
37
38 Annual nitrate transport past L03 exceeds combined annual transport of San Lorenzo, Pajaro, Salinas and Carmel Rivers.
39 NH 4+ source internal. Largest values on falling tide NH4 TIDE NH 4 (µm) Tide Height, m 0 8/10/05 8/11/05 8/12/05 8/13/05-0.5
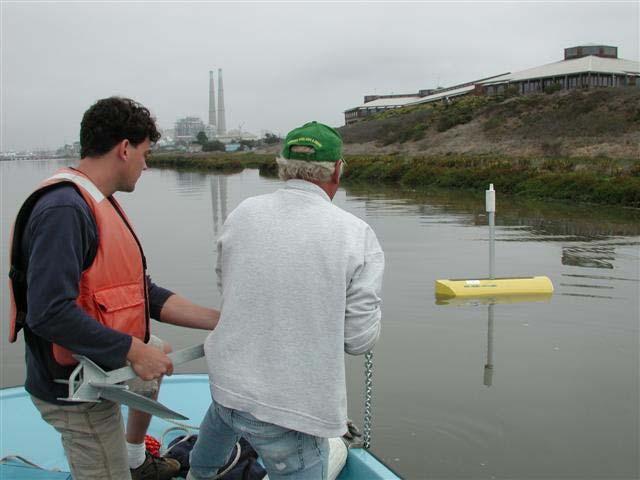
40 Internal NH 4+ source is flux from sediment. Benthic flux chamber near Kirby Park Note rapid increase in ammonia and drop in oxygen. NO3 & NH4 (µm) NH4 NO3 O O2 (µm) 0 5/31 16:26 5/31 22:26 6/1 4:26 0
 in Cloern")
41 High water velocity is good: nutrient export less eutrophication and bad: erosion and wetlands loss Nixon et al (1996) in Cloern (2001)
42 Water quality constrains erosion control options. Reduced tidal exchange = lower oxygen. External nutrient inputs must be limited. Natural variability provides test. Sediment sources of ammonia will confound solutions. Annual Avg. Nitrate (µmol/l) /05 05/06 03/04 06/07 Ocean Background Annual Precip (mm/yr)
43 Ecology Stability in an ecosystem is a balance between competing effects. As a basis for understanding this concept: Students know biodiversity is the sum total of different kinds of organisms and is affected by alterations of habitats. Students know how to analyze changes in an ecosystem resulting from changes in climate, human activity, introduction of nonnative species, or changes in population size. Students know how fluctuations in population size in an ecosystem are determined by the relative rates of birth, immigration, emigration, and death. Students know how water, carbon, and nitrogen cycle between abiotic resources and organic matter in the ecosystem and how oxygen cycles through photosynthesis and respiration. Students know a vital part of an ecosystem is the stability of its producers and decomposers. Students know at each link in a food web some energy is stored in newly made structures but much energy is dissipated into the environment as heat. This dissipation may be represented in an energy pyramid. * Students know how to distinguish between the accommodation of an individual organism to its environment and the gradual adaptation of a lineage of organisms through genetic change.
44 California Science Standards Biogeochemical Cycles Each element on Earth moves among reservoirs, which exist in the solid earth, in oceans, in the atmosphere, and within and among organisms as part of biogeochemical cycles. As a basis for understanding this concept Students know the carbon cycle of photosynthesis and respiration and the nitrogen cycle. Students know the global carbon cycle: the different physical and chemical forms of carbon in the atmosphere, oceans, biomass, fossil fuels, and the movement of carbon among these reservoirs. Students know the movement of matter among reservoirs is driven by Earth's internal and external sources of energy. * Students know the relative residence times and flow characteristics of carbon in and out of its different reservoirs.
 --> C 6 H 12 O 6 + 6 O 2 + 6 H 2 O About 1 mole of oxygen produced for each")
45 The scientific tools: what can you do with biogeochemical sensor data? Oxygen as an example. The Light Bottle/Dark Bottle or Oxygen method of determining primary production: 6 CO H 2 O (+ sunlight) --> C 6 H 12 O O H 2 O About 1 mole of oxygen produced for each mole of carbon incorporated into organic compounds. Oxygen traces primary production and respiration.
46

47 L02 Jan 2006 to present
48 California Science Standards Biogeochemical Cycles Each element on Earth moves among reservoirs, which exist in the solid earth, in oceans, in the atmosphere, and within and among organisms as part of biogeochemical cycles. As a basis for understanding this concept Students know the carbon cycle of photosynthesis and respiration and the nitrogen cycle. Students know the global carbon cycle: the different physical and chemical forms of carbon in the atmosphere, oceans, biomass, fossil fuels, and the movement of carbon among these reservoirs. Students know the movement of matter among reservoirs is driven by Earth's internal and external sources of energy. * Students know the relative residence times and flow characteristics of carbon in and out of its different reservoirs.
49
50

51
52


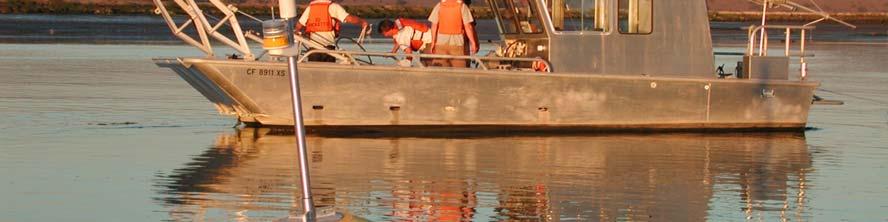
53 Acknowledgements LOBO is funded by the NSF Biocomplexity in the Environment program, with additional support from the David and Lucile Packard Foundation. IDEA: Instrumentation Development for Environmental Activities Special thanks to: John Douglas and the Moss Landing Marine Labs Small Boat Operations facility
54