What s Up in Hawaii? Pacific Northwest Demand Response Project February 25, 2015
|
|
|
- Alice Maxwell
- 5 years ago
- Views:
Transcription

1 What s Up in Hawaii? Pacific Northwest Demand Response Project February 25, 2015


2 Hawaii Electric Systems 4 electric utilities; 6 separate grids Kauaʻi Kauai Island Utility Cooperative 27 MW PV (24 MW in development) System Peak: 78 MW Customers: 32,700 Oʻahu Maui Electric Maui: 60MW PV / 72MW Wind System Peak: Maui 200 MW Lana i: 1MW PV System Peak: Lana i: 5 MW Moloka i: 1.2 MW PV System Peak: Moloka i: 5.5 MW Customers: 68,000 Hawaiian Electric 221 MW PV / 100 MW Wind / 69 MW WTE System Peak: 1,100 MW Customers: 300,000 Molokaʻi Lanaʻi Maui Hawaiʻi Source: Hawaii Natural Energy Institute Hawaii Electric Light 39 MW PV / 30 MW Wind / 38 MW Geothermal / 16 MW Hydro System Peak: 190 MW Customers: 81,000
3 A Tiny Bit of History Oahu: centralized power since 1891 Other islands originally sugar mill based systems; island-wide after WWII. IRP process and EE Funding created 1992 Cost Recovery, LRAM, Shareholder Incentive; Gamed by HECO from 1994 to 2006 Hawaii Energy Regulation and Taxation Report (2003) Decoupling plus third-party EE in
4 Big Island Crisis Puna CT failed; 2 years to reconstruct Negative reserve margin Consumer Advocate engaged me Hotel, water, sewer standby generators Install diesels at wind projects Replace all light bulbs and shower heads 4

5 Hawaii Clean Energy Initiative USDOE / Hawaii MOU 2008 High oil costs devastating to state economy. 35% state solar tax credit. 40% RPS by Step up of EE 5

6 Cost Drivers In Hawaii Highest rates and bills in USA $.35 - $.40/kWh; $200/month vs: $.125/kWh; $100/month 30% Federal + 35% State Tax Credit 6

7 Grid Parity in Hawaii: We re A Little Past That Point! 7
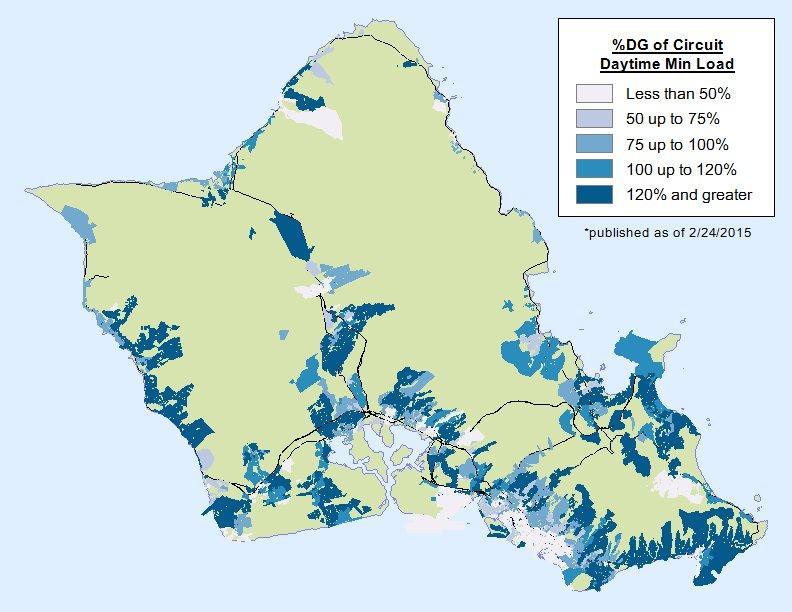
8 Solar Saturation 8

9 Residential Solar PV Currently 11% saturation ~20% in Single Family IEEE Limits Long Passed 85% of Min Load 100% of Min Daytime Load 120% of Min Daytime Load Proposed: 250% of Min Daytime Load With smart inverters 9


10 Ramping Issues Becoming Severe 10


11 April 30, 2014: Four Orders of the Apocalypse Integrated Resource Plan rejected. Renewable Standards Working Group DSM Program Review MECO Rate Case - Decoupling 11

12 Commissioner s Observations Exhibit A: 30 pages Creating a 21 st Century Power System Creating Modern T&D Grids Policy and Regulatory Reforms Focus on Performance Incentive Measures Revise rate design to address PV issues 12
13 Demand Response Direction Can benefit company and customers, by enabling capital avoidance and lower cost Develop detailed estimates for 5, 10, 20 yrs Evaluate third-party implementation Wide range of benefits: peak reduction, load shifting, frequency management, spinning reserves, ramping. 13
14 Existing Demand Response Programs Residential (RDLC): 32,350 water heaters 3,750 AC units 15 MW Commercial Large C&I with Generators Small C&I water heat and AC 13 MW 14
 38 / 4 customers 6 MW")
15 Existing DR Programs (cont d) Fast DR (Oahu and Maui) 38 / 4 customers 6 MW 15

16 Maui Wind 200 MW peak demand Night load ~80 MW 72 MW wind Minimum thermal load Spilling ~15% DR Report: 6,200 water heaters 16

17 What Needs Can DR Provide? 3/5/

18 What Services From Which Programs 18

19 Alternative Communication Networks 19

20 Proposed Future Programs 20
21 Pilot Programs Grid Integrated Water Heating Two technologies deployed EV Charging TOU Pilot 21


22 Power Supply Improvement Plan Retire Old Steam Build Marine Diesels 22
23 Some Things NOT Happening Full deployment of GIWH Water Pumping Controls: Not accepted by water agencies. Deployment of Air Conditioning thermal storage TOU pricing 23
 ~75 MW of potential peak load reduction (6%) Incremental cost <$100/kW if integrated at")
24 Potential for GIWH ~150,000 electric water heaters; 70% in multi-family ~600 MW of potentially dispatchable load (40%) ~75 MW of potential peak load reduction (6%) Incremental cost <$100/kW if integrated at manufacturing. 24

25 It s Easy To Spot a Water Heater 25

26 Water Pumping Uses ~5% of Hawaii kwh $0.20/kWh when power is cheap $0.50/kWh when power is expensive


27 AC Storage Simple technology; great peak relief. No programs to deploy 27


28

29 Current Rate Design Options No AMI; all require special metering Rider I: Interruptible 4 custs; 3 MW Rider M: 2 Hours Curtailable >10 MW Rider T: 2-Period TOU Rate + 3 cents on-peak; -2 cents off peak Schedule U: 3-Period TOU Rate 5 9 PM Priority Peak EV Charging TOU Pilot 29
30 Residential Rate Design Current HECO Residential Rate Customer Charge $9.00/month First 350 kwh $0.34 Next 850 kwh $0.35 Over 1,200 kwh $0.37 Principles-based Residential Rate Customer Charge $9.00/month Off-Peak On-Peak Power $0.10 $0.30 Delivery $0.05 $0.15 ONLY the Power rate credited for power fed to the grid.
31 Large Commercial Rate Design Current: Customer: $60/mo Demand: $11.69/kW Energy: $.216/kWh Alternative Customer: $60/mo Demand: NCP: $2.00/kW 4 8 PM: $9.00/kW Energy: Off-Peak: $.12/kWh On-Peak: $.25/kWh Critical: $.75/kWh 31
32 Current Chaos Dockets Underway: Decoupling Renewable Interconnection / Net Metering HECO Rate Case New Chairman Acquisition of HEI by NextEra Longstanding tension between energy future scenarios 32
33 Biofuels NextEra Merger Decentralized Big Wind and Solar


34 Will Hawaii Ride The Wave of Change? Or Wipe-Out? 34

35 About RAP The Regulatory Assistance Project (RAP) is a global, non-profit team of experts that focuses on the long-term economic and environmental sustainability of the power and natural gas sectors. RAP has deep expertise in regulatory and market policies that: Promote economic efficiency Protect the environment Ensure system reliability Allocate system benefits fairly among all consumers Learn more about RAP at jlazar@raponline.org