A Forecast to 2050 Tekna April 11, 2018
|
|
|
- Anabel Potter
- 5 years ago
- Views:
Transcription


1 A Forecast to 2050 Tekna April 11, 2018 Bent Erik Bakken - Senior Principal Scientist, Deputy Director Energy Transition Programme, Group Technology and Research Bent.erik.bakken@dnvgl.com


2 Well placed to see into the energy future DNV GL, professionals in 100 countries, 70% of whom are serving the energy industries Equal exposure to both the fossil and renewable energy worlds; our aim has been to produce a objective, balanced view of the future Daily involvement across entire energy supply chains: complex offshore infrastructure, onshore oil and gas installations, large- and small-scale wind, solar and energy efficiency projects, and electricity transmission and distribution grids Remi Eriksen Group President & CEO, DNV GL


3 eto.dnvgl.com 3

4 Regions NEE NAM EUR MEA IND CHN SSA SEA LAM OPA 4
5 ETO Model Population GDP per Capita Energy, Climate and Tax Policy Demand Trade Supply 2018 WIP: - GDP per Capita reformulated to regional (not global) - Hydrogen considered as additional energy carrier - Growth/Decline rate constraints, including resource availability - More in-depth reflections of policy - Effect of digitalization
 Population: projected global")


6 Key inputs Economic growth: Gross World Product (GWP) will grow 130% by 2050 (from 2015) Population: projected global population in 2050 of 9.2 billion Cost Learning Curves: forecast average cost reduction per doubling of installed capacity - e.g. wind and solar PV, each about 16% Remi Eriksen Group President & CEO, DNV GL Public policy: Substantial but decreasing preferential treatments for Evs, Wind and PV as renewables share in mix increase. Exogenous regional carbon pricing.
7 Demand Transport Road Aviation Maritime Rail Manufacturing Goods Base materials Non-energy (=feedstock) Buildings Residential Commercial
8 Supply Fuel Extraction Oil (Conv, Unconv, Offshore) Gas (Conv, Unconv, Offshore) Coal (Lignite, Steam) Power Coal Gas Nuclear Renewables Biomass, PV, Wind (on/offshore), Hydro
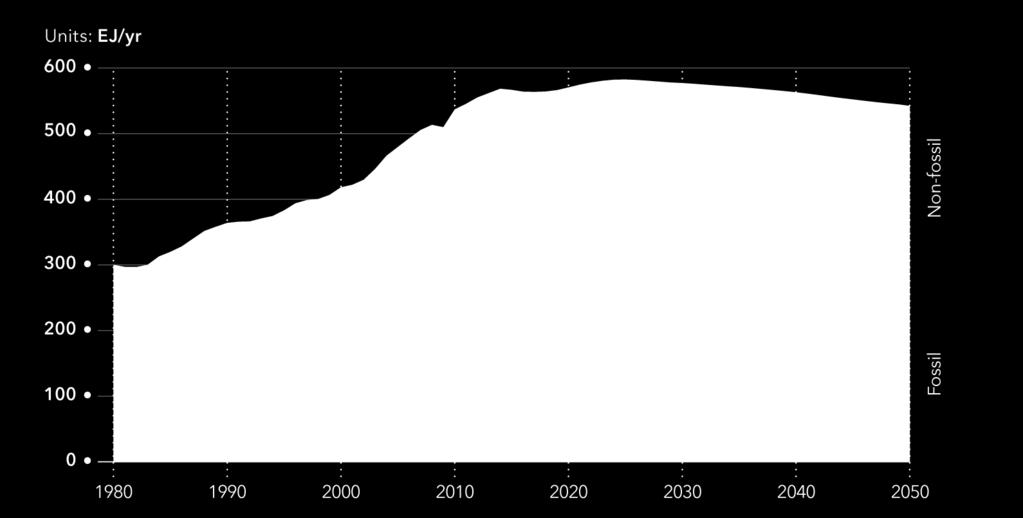
9 Trade (within/between the 10 regions) Volumes Oil Gas Bulk Power Containers Prices Power Oil Gas Coal
10 Policy example: Carbon Prices 70 Carbon Prices ($/ton CO2) EUR OPA NAM CHN MEA NEE SSA IND SEA LAM

11 Electric Vehicles (EVs) and the S-Curve The uptake of EVs will follow an S-shaped curve, reflecting the adoption of new products and technology Remi Eriksendescribed by the Bass Diffusion Model, with the steepness of the S-curve is determined Group President by fitness & CEO, to DNV early GLadoption data.


12 The average European GJ/year GJ/year In progress 12
13 Key issues Demand 2018: Feedback from energy costs on fuel mix 2019: Feedback from energy costs on fuel mix and energy efficiency Supply Global cost war between 3 crude extraction technologies and 10 regions (not influenced by the negligible transportation costs Global cost extraction war between 3 natural gas extraction technologies and 10 regions (Regionally adjusted for transportation costs) Global cost coal extraction war between 10 regions (Regionally adjusted for transportation costs) 10 separate regional cost wars between power producing technologies, including subsidies Learning curves based on volumes driving down costs -> year on year cost decline most pronounced for new renewables and batteries 13
 population and economic growth.")
14 Key results I: Decoupling Remi Eriksen Group President & CEO, DNV GL World energy growth has historically gone hand-in-hand with population and economic growth. Not only will energy decouple from carbon in the coming decades, but global energy supplied will peak and slowly decline in the context of continued (but slowing) population and economic growth. This is linked to improved energy efficiency, driven in the main by the growing share of electricity in the energy mix

15 Key results II: Demand - flattening Remi Eriksen Group President & CEO, DNV GL Total final energy demand by 2050 will be at 430 exajoules (EJ), up from 400 EJ in 2015, with almost all of this 7% growth occurring before 2030 The slow-down in demand growth is related to decelerating population and productivity growth, and to improvements in energy efficiency Demand appears deceptively stable across sectors in this chart masking dramatic shifts in, e.g. transport

16 EJ/yr Forecast fossil energy use Oil Gas Coal


17 Forecast world primary energy supply 17
18 Key results IV: Supply - peaking % 0.6 % 0.4 % 14 % 0.2 % 0.5 % 0.2 % 13 % 10 % 11 % 5 % 4 % 3 % 5 % 24 % 25 % 29 % 19 % 28 % 8 % Global primary energy supply will peak within the forecast period. World energy use, currently 570 EJ, will grow slowly over the next decade, reaching a peak of 580 EJ in 2025, and thereafter decline to some 550 EJ in 2050 Remi Eriksen Group President & CEO, DNV GL By 2019, coal will be overtaken by gas, and in 2034, gas will pass oil to become the largest energy source. The fossil share of world s primary energy mix will decline from 81% currently to 52% in 2050.


19 The world is electrifying Energy carrier Electricity generation to increase rapidly globally, by 140% from 73 EJ to 174 EJ 12% 24% 36% Electricity generation source By 2050 well over 80% of electricity will be generated by renewable sources Solar PV will grow 80-fold and wind (combined offshore and onshore) 30-fold.

20 Global energy expenditure as a fraction of Global GDP 20

21 Global warming and carbon budget 21

22 Comparing DNV GL ET with other central outlooks Contributions to growth of energy consumption, % per annum 1.4% 1.2% 1.0% 0.8% 0.6% 0.4% 0.2% 0.0% DNV GL IEA SDS Renewables Hydro Nuclear Coal Gas Oil -0.2% BP ET CNPC EIA IEA IEEJ IHS OPEC Statoil XOM scenario Technical note: for ease of comparison outlooks have been rebased to a common set of data for 2016 taken from the BP Statistical Review. The IEA case shown is the New Policies Scenario, for IHS it is Rivalry Scenario and Statoil it is the Reform Scenario. The OPEC, EIA and IEEJ cases are each publication s reference case. For full sources and data definitions see pages 122 and

23 EUROPE a: All GDP figures in this report are based on purchasing-power-parity (PPP) and in international 2005 USD b /p: per person 23 DNV GL DNV GL Europe Energy 04 December 2017Transition (2017)

24 Regional characteristics Europe consists of all European countries including the Baltics, but excludes Russia, all former Soviet Union republics, and Turkey. Europe is dominated by the European Union. Europe countries are a key part of the OECD, but there are considerable differences in wealth between the richer north and west and the less rich south and east. Energy use is moderate considering its developed state, especially compared to other OECD regions. Key European countries such as Germany, UK, and Denmark have led the development and deployment of renewable energy. Coal continues to dominate the electricity generation mix in Poland and the Baltics. A rapid energy transition is underway in Europe, but with continued discussion and disagreement within the EU over each policy step. 24 DNV GL DNV GL 04 December Europe Energy 2017Transition (2017)

25 Likely to remain best in class PIONEER IN ENERGY TRANSITION Europe has been a leader in efficient and environmentally friendly use of energy. Decarbonisation and climate will remain priorities at national and EU level. RIVALRY FOR BEST-IN-CLASS Europe will compete with China on a clean energy system and will strive to maintain the lead, achieving this for energy intensity. LOW RECORD ON EMISSIONS Europe will overtake Sub-Saharan Africa as the lowest carbon intensity region and will more than halve its carbon intensity from 45 to 21 tonnes CO2/TJ in DNV GL DNV GL 04 December Europe Energy 2017Transition (2017)
26 Final energy demand by sector EUR Final Energy Demand by Sector Units: EJ/yr Sector Non-Energy Other Manufacturing Buildings Transport DNV GL DNV GL 04 December Europe Energy 2017Transition (2017)
27 Final energy demand by energy carrier EUR Final Energy Demand by Energy Carrier Units: EJ/yr Energy Carrier Direct heat Biomass Coal Natural gas Oil Electricity DNV GL DNV GL 04 December Europe Energy 2017Transition (2017)
28 Crude oil production by field type EUR Crude Oil Production by Field Type Units: Mbpd Field Type Unconventional onshore Offshore Conventional onshore DNV GL DNV GL 04 December Europe Energy 2017Transition (2017)
29 Natural gas production by field type EUR Natural Gas Production by Field Type Units: Gm³/yr Field Type Unconventional onshore Offshore Conventional onshore DNV GL DNV GL 04 December Europe Energy 2017Transition (2017)
30 Crude oil production capacity additions by field type EUR Crude Oil Production Capacity Additions by Field Type Units: Mbpd/yr Field Type Unconventional onshore Offshore Conventional onshore DNV GL DNV GL 04 December Europe Energy 2017Transition (2017)
31 Natural gas capacity addition by field type EUR Natural Gas Production Capacity Additions by Field Type Units: Gm³/yr² Field Type Unconventional onshore Offshore Conventional onshore 31 DNV GL DNV GL 04 December Europe Energy 2017Transition (2017)
32 Primary energy consumption by source EUR Primary Energy Consumption by Source EJ/yr Units: Energy source Geothermal Wind Solar thermal Solar PV Biomass Nuclear Hydropower Natural gas Crude oil Coal 32 DNV GL DNV GL 04 December Europe Energy 2017Transition (2017)
33 Fossil energy use EUR Fossil Energy Use Units: EJ/yr Fossil Fuel Coal Oil Gas DNV GL DNV GL 04 December Europe Energy 2017Transition (2017)
34 Electricity generation by power station type EUR Electricity Generation by Energy Source Units: PWh/yr Energy source Geothermal Offshore wind Onshore wind Solar thermal Solar PV Biomass-fired CHP Biomass-fired Hydropower Nuclear Oil-fired Gas-fired CHP Gas-fired Coal-fired CHP Coal-fired 34 DNV GL DNV GL 04 December Europe Energy 2017Transition (2017)
35 Electricity capacity by power station type EUR ELECTRICITY CAPACITY BY ENERGY SOURCE Units: TW Energy source Geothermal Offshore wind Onshore wind Solar thermal Solar PV Biomass-fired CHP Biomass-fired Hydropower Nuclear Oil-fired Gas-fired CHP Gas-fired Coal-fired CHP Coal-fired 35 DNV GL DNV GL 04 December Europe Energy 2017Transition (2017)
36 Bent Erik Bakken - Senior Principal Scientist, Deputy Director Energy Transition Programme, Group Technology and Research Bent.erik.bakken@dnvgl.com SAFER, SMARTER, GREENER The trademarks DNV GL, the Horizon Graphic and Det Norske Veritas are the properties of companies in the Det Norske Veritas group. All rights reserved 36