groundwater/surface-water interactions Evan Christianson, PG Barr Engineering Company
|
|
|
- Gary Newton
- 5 years ago
- Views:
Transcription

1 groundwater/surface-water interactions Evan Christianson, PG Barr Engineering Company
2 Discussion of. Groundwater/Surface-Water Interactions Groundwater Recharge Impacts from Pumping Potential effect on water appropriations permitting
3 Groundwater/Surface-Water Interactions
4 discharge lake/wetland graining stream Mostly receives groundwater inflow
5 recharge lake/wetland losing stream Mostly loses water as seepage to groundwater Rate of loss dependent on: difference between aquifer hydraulic head and water stage lake/stream bed characteristics aquifer characteristics
6 flow-through lake/wetland Groundwater flow both into and out of lake/wetland Rate of loss dependent on: difference between aquifer hydraulic head and water stage lake/stream bed characteristics aquifer characteristics
7 disconnected lake/wetland/stream shallow water table Water table slightly below lake/wetland/stream bottom Fluctuations in water table affect flow dynamics
8 disconnected lake/wetland/stream deep water table Water table far below lake/wetland/stream bottom Loss of water to the unsaturated zone Change in water table has no effect on lake/wetland/stream


9 non-karst spring karst spring Flow from spring controlled by porous media flow Flow from spring controlled by karst flow and/or lowpermeability layers
10 Vulnerability to Changes in Groundwater System Connected or Disconnected (perched) Connection type (flow-through, discharge etc.) Geology Glacial Sediments Bedrock Soils Surface-water characteristics Depth, Geometry, etc. Sensitivity of Biota

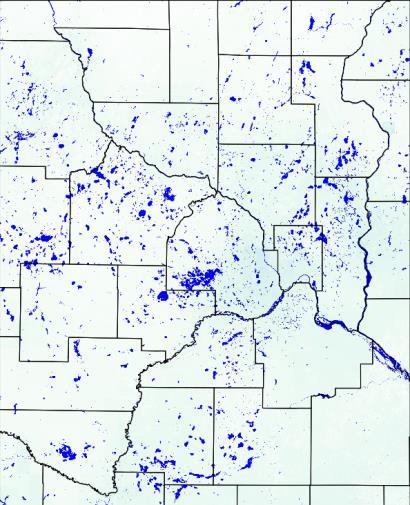
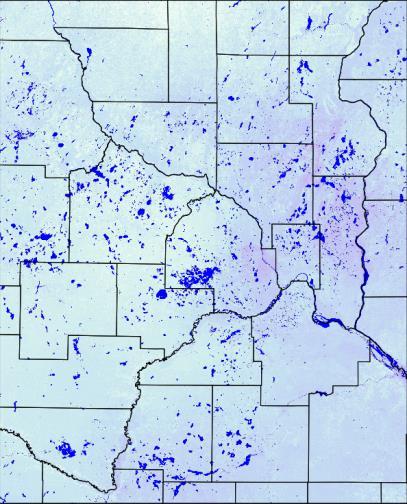
11 potential vulnerability of surface-water features to groundwater pumping Available data indicate likely not vulnerable to pumping Available data indicates potentially vulnerable to pumping Potentially vulnerable with wide littoral zone
12 Groundwater Recharge
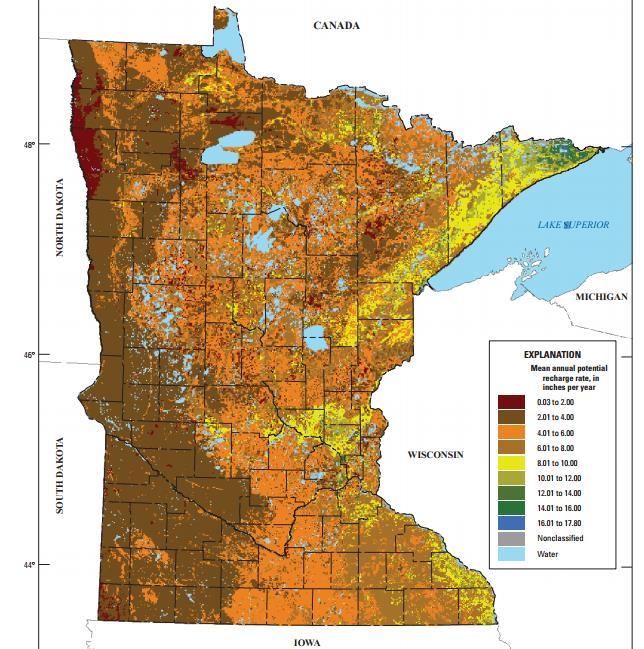
13 Smith and Westenbroek, 2015
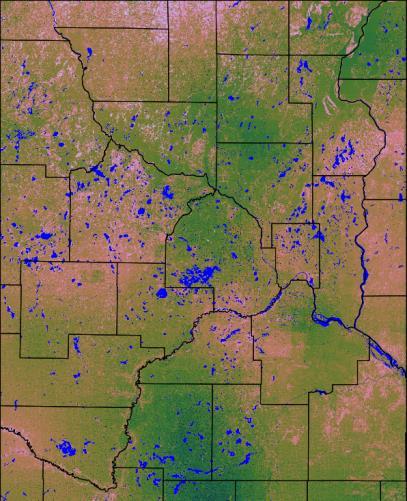
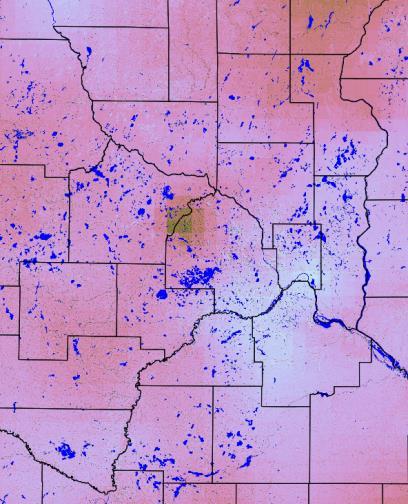
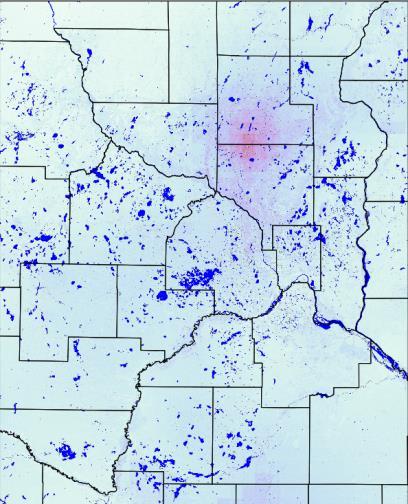
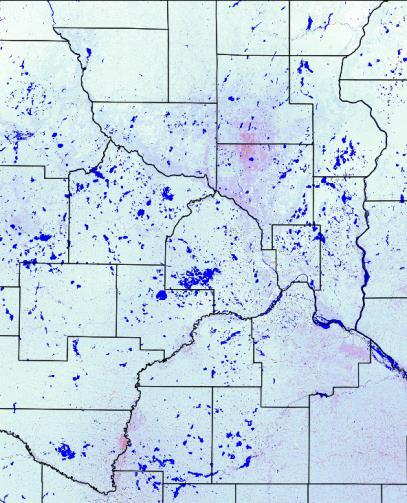
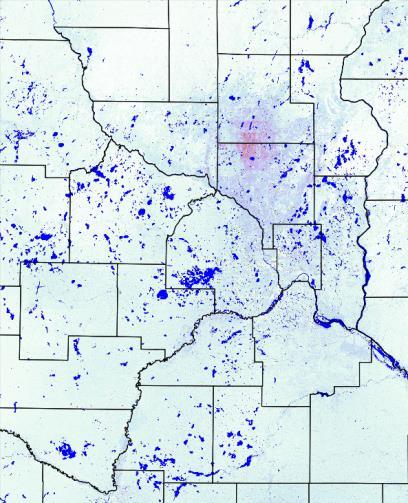
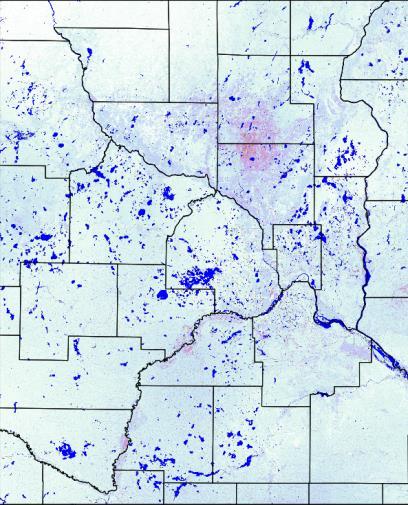
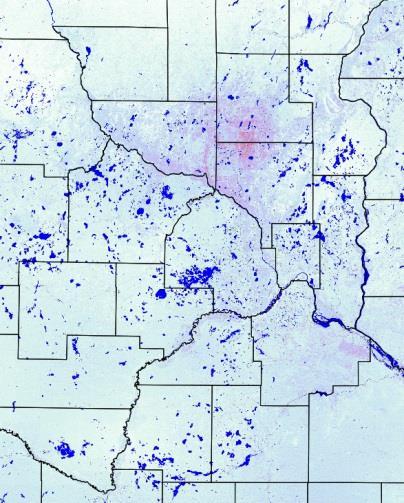
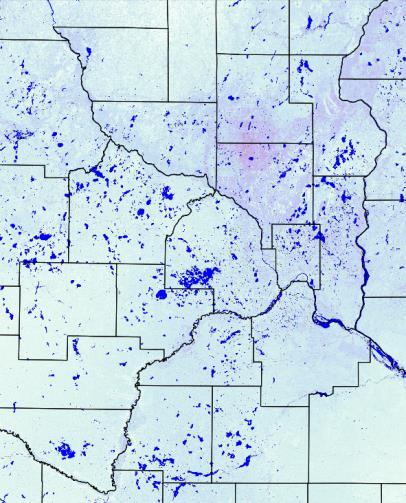
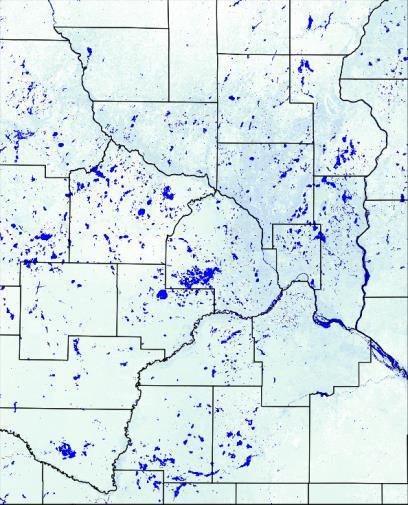
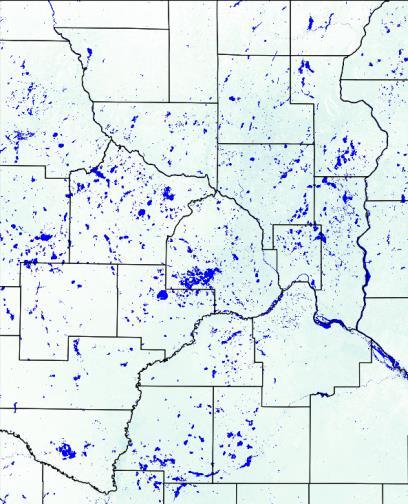
14 0 Avg. Infiltration (in/month)

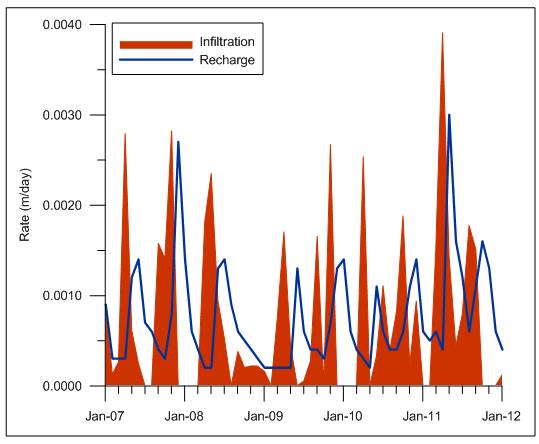
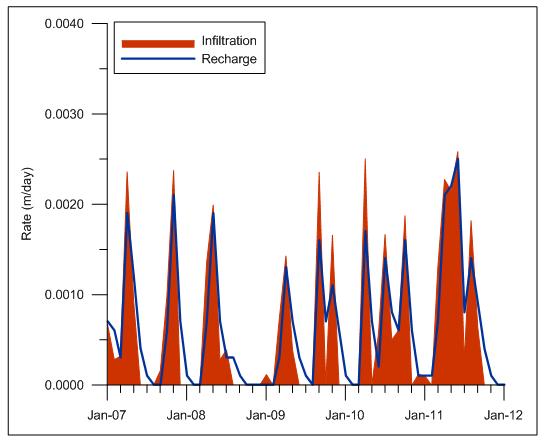
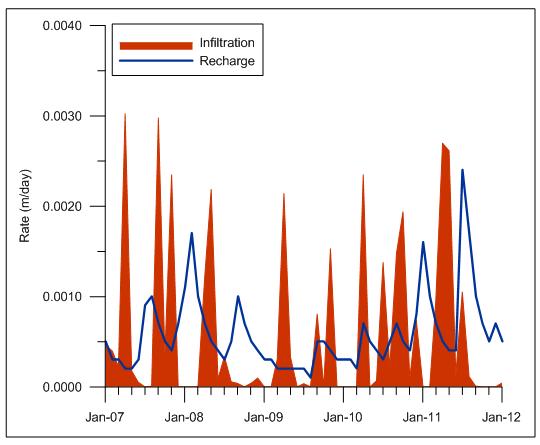
15 Time lag between infiltration and recharge
16 Impacts of Groundwater Pumping


17 Groundwater Pumping 7- County Metro Area 316 Million Gallons Per Day > 200,000 gpm Equivalent to 2.2 inches per year across the metro Approximately 27% of average recharge Or 100% recharge in this area

18 natural conditions recharge = ground water discharge well pumping at rate, Q1 well captures water that would have discharged to stream groundwater divide forms between stream and well (Alley et al., 1999) well pumping at higher rate, Q2 well captures water that would have discharged to stream and pulls water directly from the stream groundwater divide forms between stream and well
19 Any pumping will reduce groundwater flow to lakes and streams - Conservation of mass The aquifer that water is withdrawn from only affects: 1) the location/areal extent of the reduction 2) time lag
20 MN 103G.272 Subdivision 2 Groundwater appropriations that will have potential impacts negative impacts to surface waters are subject to applicable provisions in section 103G.285 Original language from 2010 modified in G.285 = Surface water appropriations; process and limits What is a negative impact?
21 MN DNR Thresholds Report to the Minnesota State Legislature: Definitions and Thresholds for Negative Impacts to Surface Waters, January 2016 Streams Diversion limit of no more than 10% of the August median base flow Lakes with constant stream outflow = apply stream threshold without constant stream outflow = protection elevation Goal is to maintain characteristic hydrology, ecology, and riparian uses of the lake most of the time Wetlands Currently proposing establishing target hydrographs for various wetland types Currently very limited wetland-related hydrologic data
22 Effect on permitting process 1.) Establish negative impact thresholds for surface water bodies 2.) Establish sustainable diversion limits that will maintain protected flows and protection elevations for those water bodies 3.) Conduct groundwater modeling to determine the effects of groundwater withdrawals on the surface water bodies 4.) Assess to what degree individual groundwater withdrawals may need to be adjusted.
23 Minnesota Water Priority Classes Riparian water law system New permit applicants have same priority as existing permit holders, assuming water is for the same purpose If a conflict exists, water users have the opportunity to develop a plan for proportionate distribution of limited water available among all users in the same priority class. Minnesota Water Use Priority Classes 1.) Municipal water supply and power production with contingency plan 2.) < 10,000 gallons per day 3.) Agriculture irrigation and agriculture processing 4.) Power production in excess of contingency plan 5.) Other > 10,000 gal/day 6.) nonessential uses
24 Local Thought Experiment 3000 feet New Well 1000 gpm Glacial Till St. Peter Prairie du Chien Jordan Sandstone

25 Drawdown in Jordan Aquifer Near Pumping Well Rapid response in source aquifer near pumping well Less than 2 days to get over 90% steady-state drawdown Steady-State Equilibrium

26 At Water Table Near Pumping Well Steady-State Equilibrium Slow Response at Water Table 84% of steady-state drawdown after 10 years

27 Change in Baseflow for Small Reach Near Well

28 Metro Model 3 covers 11-county metro


29 fault fault fault fault All Major Aquifers and Aquitards A McLeod Co. Carver Co. Scott Co. Dakota Co. A Model Row 267 Vertical exaggeration ~ 150x Quaternary Sediments Cretaceous and Paleozoic sandstone and siltstone St. Peter Sandstone Prairie du Chien Group Jordan Sandstone St. Lawrence Formation Tunnel City Group Wonewoc Sandstone Eau Claire Formation Mt Simon Hinckley Sandstone


30 Metro Model 3 Pumping from all high capacity wells Recharge from SWB model Incorporation all detailed bedrock and glacial geology Steady-state and transient Extensive calibration process Pumping Wells Head Targets

31 Jordan Aquifer
32