Geothermal Energy. Dr. Mazen Abualtayef. Environmental Engineering Department Islamic University of Gaza, Palestine
|
|
|
- Magdalen Simpson
- 5 years ago
- Views:
Transcription
1 Geothermal Energy Dr. Mazen Abualtayef Environmental Engineering Department Islamic University of Gaza, Palestine
2 Adapted from a presentation by Professor S.R. Lawrence Leeds School of Business, Environmental Studies University of Colorado, Boulder, CO, USA
3 AGENDA Geothermal Energy Geothermal Overview Extracting Geothermal Energy Environmental Implications Economic Considerations Geothermal Installations Examples
4 Geothermal Overview
5 Geothermal in Context Energy Source P Total a Fossil Fuels Coal Coal Coke Net Imports Natural Gas b Petroleum c Electricity Net Imports Nuclear Electric Power Renewable Energy Conventional Hydroelectric Geothermal Energy Biomass d Solar Energy Wind Energy U.S. Energy Consumption by Energy Source, (Quadrillion Btu)

6 Advantages of Geothermal
7 Heat from the Earth s Center Earth's core maintains temperatures in excess of 5000 C Heat radual radioactive decay of elements Heat energy continuously flows from hot core Conductive heat flow Convective flows of molten mantle beneath the crust. Mean heat flux at earth's surface 16 kilowatts of heat energy per square kilometer Dissipates to the atmosphere and space. Tends to be strongest along tectonic plate boundaries Volcanic activity transports hot material to near the surface Only a small fraction of molten rock actually reaches surface. Most is left at depths of 5-20 km beneath the surface, Hydrological convection forms high temperature geothermal systems at shallow depths of m.
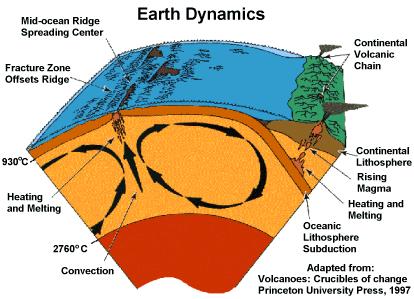
8 Earth Dynamics

9 Earth Temperature Gradient

10 Geothermal Site Schematic Boyle, Renewable Energy, 2 nd edition, 2004

11 Geysers Clepsydra Geyser in Yellowstone

12 Hot Springs Hot springs in Steamboat Springs area.

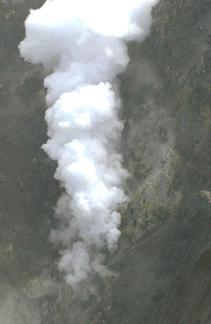
13 Fumaroles Clay Diablo Fumarole (CA) White Island Fumarole New Zealand

14 Global Geothermal Sites

15 Tectonic Plate Movements Boyle, Renewable Energy, 2 nd edition, 2004

16 Geothermal Sites in US
17 Extracting Geothermal Energy

18 Methods of Heat Extraction
19 Units of Measure Pressure 1 Pascal (Pa) = 1 Newton / square meter 100 kpa = ~ 1 atmosphere = ~14.5 psi 1 MPa = ~10 atmospheres = ~145 psi Temperature Celsius (ºC); Fahrenheit (ºF); Kelvin (K) 0 ºC = 32 ºF = 273 K 100 ºC = 212 ºF = 373 K
20 Dry Steam Power Plants Dry steam extracted from natural reservoir ºC ( ºF) 4-8 MPa ( psi) 200+ km/hr (100+ mph) Steam is used to drive a turbo-generator Steam is condensed and pumped back into the ground Can achieve 1 kwh per 6.5 kg of steam A 55 MW plant requires 100 kg/s of steam Boyle, Renewable Energy, 2 nd edition, 2004

21 Dry Steam Schematic Boyle, Renewable Energy, 2 nd edition, 2004
22 Single Flash Steam Power Plants Steam with water extracted from ground Pressure of mixture drops at surface and more water flashes to steam Steam separated from water Steam drives a turbine Turbine drives an electric generator Generate between 5 and 100 MW Use 6 to 9 tonnes of steam per hour

23 Single Flash Steam Schematic Boyle, Renewable Energy, 2 nd edition, 2004
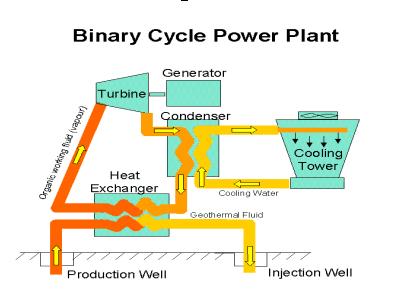
24 Binary Cycle Power Plants Low temps 100 o and 150 o C Use heat to vaporize organic liquid E.g., iso-butane, iso-pentane Use vapor to drive turbine Causes vapor to condense Recycle continuously Typically 7 to 12 % efficient MW units common

25 Binary Cycle Schematic Boyle, Renewable Energy, 2 nd edition, 2004

26 Binary Plant Power Output
27 Double Flash Power Plants Similar to single flash operation Unflashed liquid flows to low-pressure tank flashes to steam Steam drives a second-stage turbine Also uses exhaust from first turbine Increases output 20-25% for 5% increase in plant costs

28 Double Flash Schematic Boyle, Renewable Energy, 2 nd edition, 2004
29 Combined Cycle Plants Combination of conventional steam turbine technology and binary cycle technology Steam drives primary turbine Remaining heat used to create organic vapor Organic vapor drives a second turbine Plant sizes ranging between 10 to 100+ MW Significantly greater efficiencies Higher overall utilization Extract more power (heat) from geothermal resource
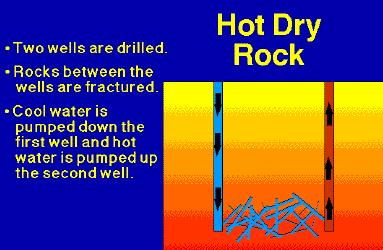
30 Hot Dry Rock Technology Wells drilled 3-6 km into crust Hot crystalline rock formations Water pumped into formations Water flows through natural fissures picking up heat Hot water/steam returns to surface Steam used to generate power


31 Hot Dry Rock Technology Fenton Hill plant

32 Soultz Hot Fractured Rock Boyle, Renewable Energy, 2 nd edition, 2004

33 2-Well HDR System Parameters m 2 = 2 km m 3 = 0.2 km 3 Boyle, Renewable Energy, 2 nd edition, 2004
34 Promise of HDR 1 km 3 of hot rock has the energy content of 70,000 tonnes of coal If cooled by 1 ºC Upper 10 km of crust in US has 600,000 times annual US energy (USGS) Between GW power available at existing hydrothermal sites Using enhanced technology Boyle, Renewable Energy, 2 nd edition, 2004
35 Direct Use Technologies Geothermal heat is used directly rather than for power generation Extract heat from low temperature geothermal resources < 150 o C or 300 o F. Applications sited near source (<10 km)

36 Geothermal Heat Pump

37 Heat vs. Depth Profile Boyle, Renewable Energy, 2 nd edition, 2004

38 Geothermal District Heating Southhampton geothermal district heating system technology schematic Boyle, Renewable Energy, 2 nd edition, 2004

39 Direct Heating Example Boyle, Renewable Energy, 2 nd edition, 2004
40 Technological Issues Geothermal fluids can be corrosive Contain gases such as hydrogen sulphide Corrosion, scaling Requires careful selection of materials and diligent operating procedures Typical capacity factors of 85-95%
41 Technology vs. Temperature Reservoir Temperature High Temperature >220 o C (>430 o F). Intermediate Temperature o C ( o F). Low Temperature o C ( o F). Reservoir Fluid Water or Steam Water Water Common Use Power Generation Direct Use Technology commonly chosen Flash Steam Combined (Flash and Binary) Cycle Direct Fluid Use Heat Exchangers Heat Pumps Power Generation Direct Use Binary Cycle Direct Fluid Use Heat Exchangers Heat Pumps Direct Use Direct Fluid Use Heat Exchangers

42 Geothermal Performance Boyle, Renewable Energy, 2 nd edition, 2004
43 Environmental Implications
44 Environmental Impacts Land Air Vegetation loss Soil erosion Landslides Slight air heating Local fogging Ground Reservoir cooling Seismicity (tremors) Water Watershed impact Damming streams Hydrothermal eruptions Lower water table Subsidence Noise Benign overall
45 Renewable? Heat depleted as ground cools Not steady-state Earth s core does not replenish heat to crust quickly enough Example: Iceland's geothermal energy could provide 1700 MW for over 100 years, compared to the current production of 140 MW
46 Economics of Geothermal
47 Cost Factors Temperature and depth of resource Type of resource (steam, liquid, mix) Available volume of resource Chemistry of resource Permeability of rock formations Size and technology of plant Infrastructure (roads, transmission lines)
48 Costs of Geothermal Energy Costs highly variable by site Dependent on many cost factors High exploration costs High initial capital, low operating costs Fuel is free Significant exploration & operating risk Adds to overall capital costs Risk premium
49 Risk Assessment

50 Geothermal Development
51 Cost of Water & Steam High temperature (>150 o C) Medium Temperature ( o C) Low Temperature (<100 o C) Cost (US $/ tonne of steam) Cost (US /tonne of hot water) Table Geothermal Steam and Hot Water Supply Cost where drilling is required
52 Cost of Geothermal Power Small plants (<5 MW) Medium Plants (5-30 MW) Large Plants (>30 MW) Unit Cost (US /kwh) High Quality Resource Unit Cost (US /kwh) Medium Quality Resource Unit Cost (US /kwh) Low Quality Resource Normally not suitable Normally not suitable
53 Direct Capital Costs Plant Size High Quality Resource Medium Quality Resource Low Quality Resource Small plants (<5 MW) Exploration : US$ Steam field:us$ Power Plant:US$ Total: US$ Exploration : US$ Steam field:us$ Power Plant:US$ Total: US$ Exploration : US$ Steam field:us$ Power Plant:US$ Total:US$ Med Plants (5-30 MW) Exploration : US$ Steamfield:US$200-US$500 Power Plant: US$ Total: US$ Exploration: : US$ Steam field:us$ Power Plant:US$ Total: US$ Normally not suitable Large Plants (>30 MW) Exploration:: US$ Steam field:us$ Power Plant:US$ Total: US$ Exploration : US$ Steam field:us$ Power Plant:US$ Total: US$ Normally not suitable Direct Capital Costs (US $/kw installed capacity)
54 Indirect Costs Availability of skilled labor Infrastructure and access Political stability Indirect Costs Good: 5-10% of direct costs Fair: 10-30% of direct costs Poor: 30-60% of direct costs
55 Operating/Maintenance Costs O&M Cost (US c/kwh) Small plants (<5 MW) O&M Cost (US c/kwh) Medium Plants (5-30 MW) O&M Cost (US c/kwh) Large Plants(>30 MW) Steam field Power Plant Total Operating and Maintenance Costs
56 Geothermal Installations Examples

57 Geothermal Power Examples Boyle, Renewable Energy, 2 nd edition, 2004
58 Geothermal Power Generation World production of 8 GW 2.7 GW in US The Geyers (US) is world s largest site Produces 2 GW Other attractive sites Rift region of Kenya, Iceland, Italy, France, New Zealand, Mexico, Nicaragua, Russia, Phillippines, Indonesia, Japan

59 Geothermal Energy Plant Geothermal energy plant in Iceland

60 Geothermal Well Testing Geothermal well testing, Zunil, Guatemala

61 Heber Geothermal Power Station 52kW electrical generating capacity

62 Geysers Geothermal Plant The Geysers is the largest producer of geothermal power in the world.

63 Geyers Cost Effectiveness Boyle, Renewable Energy, 2 nd edition, 2004
64 Geothermal Summary
65 Geothermal Prospects Environmentally very attractive Attractive energy source in right locations Likely to remain an adjunct to other larger energy sources Part of a portfolio of energy technologies Exploration risks and up-front capital costs remain a barrier

66 Next Week: BIOENERGY
67 Supplementary Slides Extras

68 Geothermal Gradient

69 Geo/Hydrothermal Systems

70 Location of Resources

71 Ground Structures Boyle, Renewable Energy, 2 nd edition, 2004

72 Volcanic Geothermal System Boyle, Renewable Energy, 2 nd edition, 2004

73 Temperature Gradients Boyle, Renewable Energy, 2 nd edition, 2004
74

75 UK Geothermal Resources Boyle, Renewable Energy, 2 nd edition, 2004

76 Porosity vs. Hydraulic Conductivity Boyle, Renewable Energy, 2 nd edition, 2004

77 Performance vs. Rock Type Boyle, Renewable Energy, 2 nd edition, 2004

78 Deep Well Characteristics Boyle, Renewable Energy, 2 nd edition, 2004

79 Single Flash Plant Schematic
80

81 Binary Cycle Power Plant

82 Flash Steam Power Plant

83 Efficiency of Heat Pumps Boyle, Renewable Energy, 2 nd edition, 2004
84 Recent Developments Comparing statistical data for end-1996 (SER 1998) and the present Survey, it can be seen that there has been an increase in world geothermal power plant capacity (+9%) and utilisation (+23%) while direct heat systems show a 56% additional capacity, coupled with a somewhat lower rate of increase in their use (+32%). Geothermal power generation growth is continuing, but at a lower pace than in the previous decade, while direct heat uses show a strong increase compared to the past. Going into some detail, the six countries with the largest electric power capacity are: USA with MWe is first, followed by Philippines (1 863 MWe); four countries (Mexico, Italy, Indonesia, Japan) had capacity (at end-1999) in the range of MWe each. These six countries represent 86% of the world capacity and about the same percentage of the world output, amounting to around GWhe. The strong decline in the USA in recent years, due to overexploitation of the giant Geysers steam field, has been partly compensated by important additions to capacity in several countries: Indonesia, Philippines, Italy, New Zealand, Iceland, Mexico, Costa Rica, El Salvador. Newcomers in the electric power sector are Ethiopia (1998), Guatemala (1998) and Austria (2001). In total, 22 nations are generating geothermal electricity, in amounts sufficient to supply 15 million houses. Concerning direct heat uses, Table 12.1 shows that the three countries with the largest amount of installed power: USA (5 366 MWt), China (2 814 MWt) and Iceland (1 469 MWt) cover 58% of the world capacity, which has reached MWt, enough to provide heat for over 3 million houses. Out of about 60 countries with direct heat plants, beside the three abovementioned nations, Turkey, several European countries, Canada, Japan and New Zealand have sizeable capacity. With regard to direct use applications, a large increase in the number of GHP installations for space heating (presently estimated to exceed ) has put this category in first place in terms of global capacity and third in terms of output. Other geothermal space heating systems are second in capacity but first in output. Third in capacity (but second in output) are spa uses followed by greenhouse heating. Other applications include fish farm heating and industrial process heat. The outstanding rise in world direct use capacity since 1996 is due to the more than two-fold increase in North America and a 45% addition in Asia. Europe also has substantial direct uses but has remained fairly stable: reductions in some countries being compensated by progress in others. Concerning R&D, the HDR project at Soultz-sous-Forêts near the French-German border has progressed significantly. Besides the ongoing Hijiori site in Japan, another HDR test has just started in Switzerland (Otterbach near Basel). The total world use of geothermal power is giving a contribution both to energy saving (around 26 million tons of oil per year) and to CO2 emission reduction (80 million tons/year if compared with equivalent oil-fuelled production).