PWP 2015 IRP Update Energy Roadmap Event
|
|
|
- Anthony Bruce
- 5 years ago
- Views:
Transcription

1 PWP 2015 IRP Update Energy Roadmap Event May 13, 2015


2 Can You Name These PWP Power Sources? 2

3 PWP Power Supplies 4

4 Energy Integrated Resource Plan (IRP) The IRP is a 20 year plan for meeting forecasted energy demand plus reserve capacity through a combination of supply-side and demand-side resources while meeting the objectives of environmental responsibility, reliability and affordable cost. The IRP evaluates the risks and uncertainties related to regulations, marketplace and technologies based on known information or assumptions. PWP updates the IRP every 2-3 years. 5


5 Foundation Earlier IRPs This IRP Update builds on concepts & action plans from 2009 & 2012 IRPs. Environmental Stewardship Feasible Viable Fiscal Responsibility Cost Effective System Reliability 6
6 Progress Toward 2012 IRP Recommendations Recommendation Target Status Renewable Energy: RPS Renewable Energy: Local Solar 40% by 2020; Meet/exceed state mandated level of 33% by On Track; 28% for 2014; Well on our way to 40% by MW by 2020; 19 MW by 2024 Approximately 6.2 MW installed Coal Power Displacement Reduce coal purchases by at least 35 MW by 2016 (via power sale to non-california public entity buyers) New Local Gas-Fired Generation Replace Broadway power plant with a comparably sized new combined cycle plant by 2014 No willing/qualified buyers; Sales blocked by CARB Resource Shuffling Rules. Able to achieve some reduced output w/economic dispatch + additional carbon premium. GT-5 Under Construction; Commercial Operation expected June 2016 Energy Savings Incorporate adopted 2010 Energy Efficiency Goals Adopted 2013 Energy Efficiency Goals: 12,750 MWh, 2.3 MW = ~ 1% per year (energy), 0.7% (demand) Additional Demand Response GHG Emissions Reductions Upgrades of Existing Generation Additional 5 MW by 2012 through incentives and programs 25% by 2015; 40% by 2020 (from 2008 levels) 19.1% as of 2014 Continue to maintain and upgrade Glenarm Units 1 and 2 to extend their lives through 2030 None identified to date. Under review pending development of smart grid strategy. Unit 1 complete. Unit 2 still being evaluated. Separate staff recommendation pending.
7 IRP Terminology Portfolios Groups of Power Supply Resources 1 Stay the Course (Preferred Portfolio) 2 IPP (Coal) Reduction 40% RPS (by 2020) 3 50% Renewable Portfolio Standard (by 2025) 4 70% Renewable Portfolio Standard (by 2030) 5 Carbon (GHG) Neutral (by 2030) Scenarios Sets of Market Assumptions Base Case B&V Energy Market Perspective High Gas Prices Low Gas Prices Green Market Influence Higher Carbon Pricing 8 Sensitivities Basic Model Variations Higher Energy Efficiency IPP (Coal) Economic Dispatch (slightly higher generation than Business As Usual) IPP Early Retirement in 2025 (original contract expires in 2027)

8 Why Stay the Course? Least Cost > Of the 5 Short-Listed Portfolios > Does Not Preclude Adopting Any of the Other Portfolios in a Future IRP Update Meets or Exceeds All of PWP s Current Requirements > Legal, Regulatory, Reliability and Environmental Provides Flexibility > To Respond to a Number of Variables in Flux Over Next Few Years Achieves a 60% GHG Reduction from 1990 Levels by 2030 > Ahead of California statewide target of 40% under Governor Brown s Executive Order B
9 Key Issues/Changes CAISO Reliability Requirements > Local & Flexible Resource Adequacy Capacity ( FRAC ) Energy Imbalance Market ( EIM ) The Duck Curve > Changing Net Load Profile alters timing of peak and off-peak loads/prices > Over-generation > Need for fast-ramping, flexible resources Retail Load > Increasing penetration of distributed generation (e.g., rooftop solar, microgrids) which reduce load, and EV charging would increase load > Change hourly and seasonal shape and load factor Cap-and-Trade > Will it continue past 2020, or be replaced by federal carbon tax or some other program? GHG Emission Levels > 1990 levels by 2020 (AB32 The Global Warming Solutions Act) > 80% reduction below 1990 levels by 2050 (Schwarzenegger s Executive Order S-3-05) > 40% reduction below 1990 levels by 2030 (Brown s Executive Order B-30-15, issued ) California s RPS > At least 33% by 2020 (AB32) > Brown s Golden State Standards (aka: the 50/50/50 plan): 50% by 2030 Renewable Resources and Energy Storage > Costs expected to continue to decline > Technology still evolving > Tax incentives, legislative changes and reliability requirements uncertain Intermountain Power Project Contract 10
 2 IPP (Coal) Reduction 3 50% RPS by 2025 4 70% RPS by 2030 5 Carbon Neutral by 2030 Each RPS level is more aggressive than current/anticipated")
10 Selecting Flexible IRP Portfolios: A Building Block Approach Each Portfolio Step is a subset of the next the lower steps lay the groundwork for higher ones later on. 1 Stay the Course (Preferred Portfolio) 2 IPP (Coal) Reduction 3 50% RPS by % RPS by Carbon Neutral by 2030 Each RPS level is more aggressive than current/anticipated state mandated targets. 11

11 Intermountain Power Project ( IPP ) IPP is the largest contributor of GHG emissions in the PWP generation portfolio.* * Percentages using current CARB GHG reporting methodology for electric utilities 12
")
12 Reducing IPP Generation (under current contract) 13
13 IPP Power Sales Contract ( PSC ) Project consists of MW coal-fired units and associated transmission facilities Power purchased by 36 separate public utilities > California participants are LADWP, Riverside, Anaheim, Burbank, Glendale, & Pasadena > Utah entities have assigned most of their power to California participants Current PSC expires June 15, 2027 Intermountain Power Association ( IPA ) proposes to amend and renew the contract > California entities cannot sign new coal contracts > Amendment would facilitate repowering with smaller natural gas plant and/or alternative > Coal fired generation would be repowered with natural gas and/or alternative by 2025 & participants would have option of renewing contracts to participate in repowering > Amendment does not require that IPA decommission the coal plant, but if it does, participants will pay decommissioning costs 14
14 PWP Carbon Emissions to Date Emission Source Local Generation 82,724 73,355 74,590 80, ,828 59,603 64,217 Imports (incl. IPP Coal) 672, , , , , , ,314 Magnolia* 38,553 36,285 40,727 19,169 5,723 4,540 12,073 Net Market Purchases* 111, ,925 65,898 74,751 97,901 63,304 85,656 Total Emissions/ (2008 Method) Reduction from 2008 Total Emissions/ (Current Method) Reduction from ,317 N/A 755,045 N/A 883, % 739, % , % 704, % 817, % 723, % 757, % 654, % 663, % 595, % 708, % 610, % *In 2008, Magnolia & Net Market Purchases were included in PWP Emissions. Current Method excludes them because they are counted by other entities (Burbank for Magnolia; Generation owners or first importers for CAISO market purchases). Switching from natural gas to biomethane at Magnolia produces RPS RECs but does not show up as PWP carbon emission reduction under current CARB methodology.
15 PWP Carbon Emissions vs PWP Carbon Emissions (MT) 2014 Actual Emissions (MT) 40% Reduction (MT) 60% Reduction (MT) 80% Reduction (MT) 918, , , , ,724 16


16 Net GHG Emission Reduction Costs 17

17 Average New Renewable Technology IRP Cost Assumptions No PWP program in place yet generic assumption is higher than most other utility programs. Net Metering Assumes reduction in federal Investment Tax Credit post Current solar PV offers are significantly less. 18


18 Average PWP Generation Cost by Resource 19

19 Expected PWP Gas-Fired Generation Cost 20
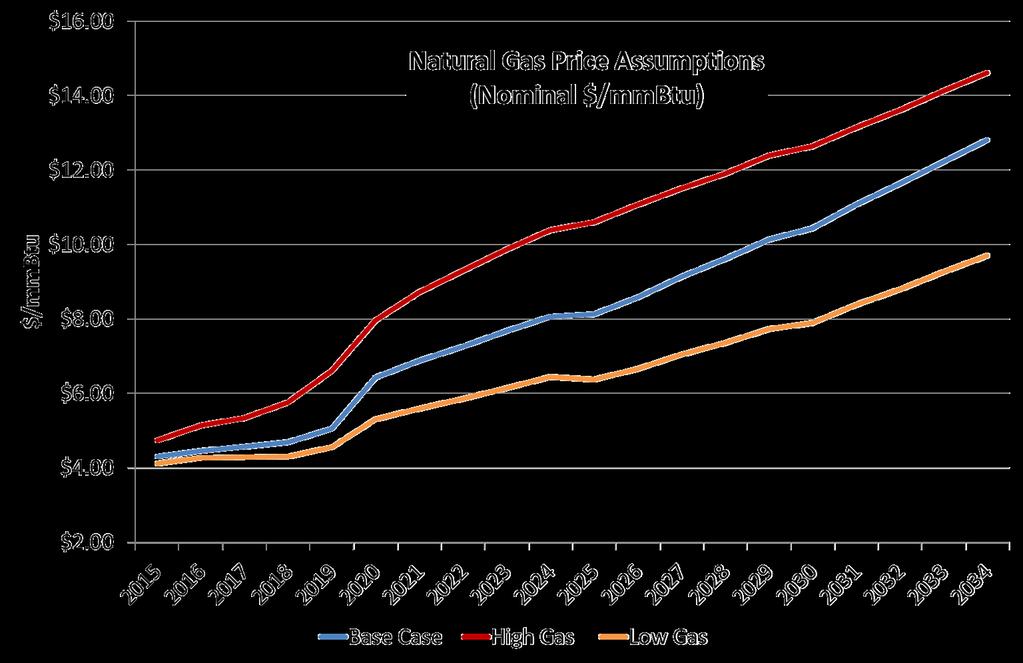

20 Assumptions Natural Gas Prices 21

21 Assumptions Electricity Prices 22

22 Assumptions Carbon Prices 23
23 Financial Terms Future Value/Present Value*: Money now is more valuable than money later on. If you have $1,000 and could get 10% interest on your money, $1,000 x 10% = $100 in a year. Your $1,000 now would have a future value of $1,100 by next year. $1,100 next year has a present value of $1,000 now. > The formula for Present Value is: PV = FV / (1+r) n, where: PV is Present Value FV is Future Value r is the interest rate (as a decimal) n is the number of years Levelized Cost: The equal payments determined by taking the Present Value (adjusted for the cost of inflation or interest on money) today of a series of future payment obligations and dividing by the number of future payments in the period. It is different than the average or median payment. > For example: a series of ten annual payments starting with $1,000, and escalating at 3.5% per year would have a levelized payment of $1,162. The average payment would be $1,173. The median payment would be $1,168. Discount Rate: The risk-adjusted cost of borrowing money, used to determine the Present Value of a series of future cash flows. PWP has used a discount rate of 3.5% for its analysis in this IRP update. * Pierce, Rod. "Present Value (PV)" Math Is Fun. Ed. Rod Pierce. 2 Aug Mar 2015 < 24

24 What Portion of PWP Costs Are We Addressing in the IRP? The IRP Modeling addresses only the Direct Cost component of the Energy Service Charge. Analyses of the economic impact of various alternatives under the IRP on customer rates/bills assume that all other components of the power bill and rate structure remain unchanged from FY2017. It is reasonable to assume that there will be increases in these other components as well over the next 20 years.* It is very difficult to accurately predict all components of rates over a 20 year horizon. * For example, the CAISO is forecasting significant increases in its transmission access charge. 25

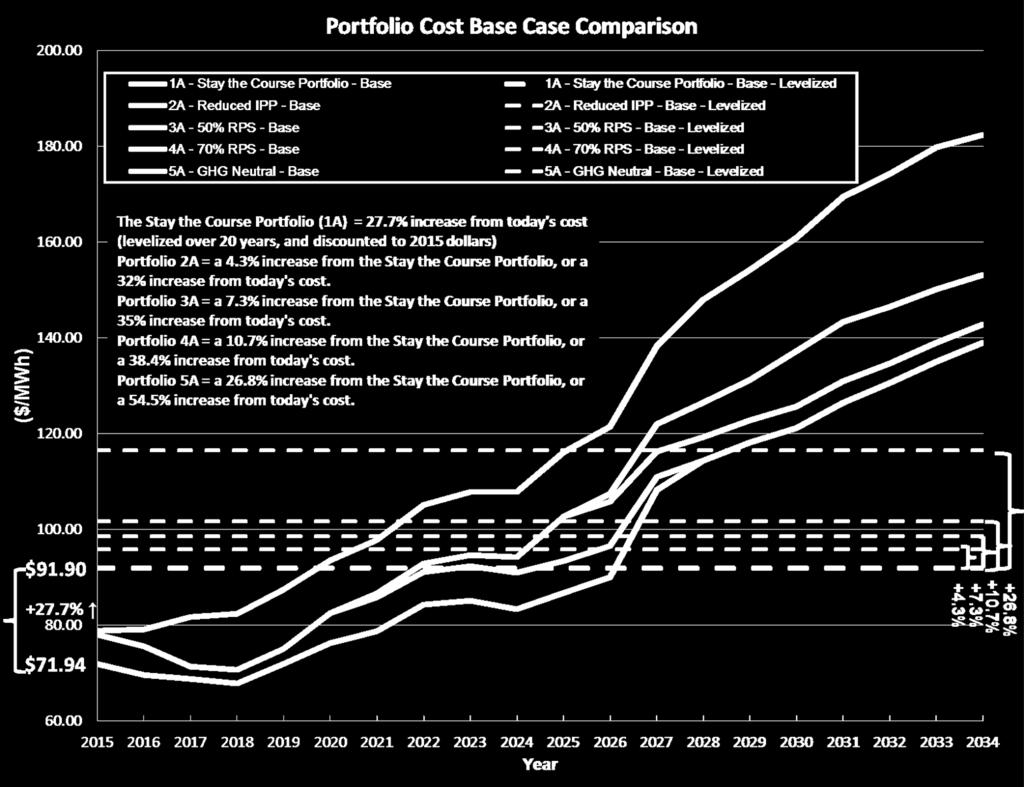
25 Portfolio Cost Comparison ($2015) 26
26 Portfolio Cost Comparison PORTFOLIO Expected Increase from Starting (Today s) Cost to 20-Year Levelized Increase from Status Quo (2008) or Stay the Course (2015) Total Portfolio Cost Increase 2008 IRP ($2008) 28% 6% 34% 1A Stay the Course ($2015) 27.7% N/A 27.7% 2A Reduce IPP ($2015) 27.7% 4.3% 32.0% 3A 50% RPS ($2015) 27.7% 7.3% 35.0% 4A 70% RPS ($2015) 27.7% 10.7% 38.4% 5A GHG Neutral ($2015) 27.7% 26.8% 54.5% 27
27 Estimated Impact of Direct Electricity Cost Only Monthly Residential Bill (by Usage) Portfolio Assumes no changes to other cost components or rate structure from FY 2017 approved rates Portfolio Name 500 kwh 1000 kwh Current Annual Average Monthly Bill As of March 2015 $84.95 $ Year Levelized (2015$) Stay the Course (Preferred Portfolio) Economic IPP Dispatch + carbon premium 40% RPS by 2020 Reduced IPP Output Reduce IPP to Min starting in % RPS by 2020 Blended 50% RPS Reduce IPP to Min starting in % RPS by 2025 (Solar/Wind/Base Mix) Blended 70% RPS Reduce IPP to Min starting in % RPS by 2025 & 70% by 2030 (Solar/Wind/Base Mix) Carbon (GHG) Neutral Starting in 2015: Reduce IPP to Min, no power market purchases, natural gas plants burn 100% biomethane. 50% RPS by 2025 & 100% Carbon-Free by 2030 (e.g., 88% Renewable and 12% existing large hydro/nuclear) 28 $96.31 $ $ $ $ $ $ $ $ $243.88
28 Estimated Impact of Direct Electricity Cost Changes on Monthly General Service Bill (by Usage) Portfolio Portfolio Name Assumes no changes to other cost components or rate structure from FY 2017 approved rates 2,000 kwh 10,000 kwh 50,000 kwh 100,000 kwh Current Annual Average Monthly Bill As of March 2015 $327 $1,664 7,563 14, Stay the Course (Preferred Portfolio) Economic IPP Dispatch + carbon premium 40% RPS by 2020 Reduced IPP Output Reduce IPP to Min starting in % RPS by 2020 Blended 50% RPS Reduce IPP to Min starting in % RPS by 2025 (Solar/Wind/Base Mix) 20-Year Levelized (2015$) Blended 70% RPS Reduce IPP to Min starting in % RPS by 2025 & 70% by 2030 (Solar/Wind/Base Mix) Carbon (GHG) Neutral Starting in 2015: Reduce IPP to Min, no power market purchases, natural gas plants burn 100% biomethane. 50% RPS by 2025 & 100% Carbon-Free by 2030 (e.g., 88% Renewable and 12% existing large hydro/nuclear) 29 $372 $1,898 $8,630 $16,965 $390 $1,988 $9,081 $17,847 $395 $2,014 $9,208 $18,093 $401 $2,043 $9,355 $18,382 $427 $2,181 $10,042 $19,722


29 Preferred Portfolio: Stay the Course = 60% GHG Reduction by 2030 Exit IPP coal generation no later than Discussions underway for IPP natural gas or alternative repowering & 2025 early exit from coal. Must have option to reduce participation or exit repowered project in Must preserve IPP transmission rights. Reduce IPP generation when operationally and economically practicable. Reduce/ Eliminate Coal Energy Efficiency Acquire all cost- effective & viable energy efficiency. At least 1% of annual net energy load + 0.7% of avg. peak demand. FY : 12,750 MWh/year energy efficiency FY : 2.3 MW/year demand reduction Local/ Community Renewables Renewable Energy Establish Feed-In Tariff by 2016 Launch Community Solar Program by Statewide targets are 40% reduction by 2030 & 80% by 2050 from from 1990 levels. 30 Meet or exceed California mandatory target (at least 33% by 2020 proposed 50% by 2030). Meet or exceed Pasadena voluntary target (40% by 2020).