Water Efficiency Best Practices
|
|
|
- Isabel Martin
- 5 years ago
- Views:
Transcription

 Hoffman, P.E.")

1 Water Efficiency Best Practices Presented by H.W. (Bill) Hoffman, P.E. Senior Technical Advisor Water Management, Inc.
2 Learning Objectives 1.Learn how water and wastewater costs will increase even faster in the future 2.Review changing codes and standards regarding water use 3.Understand what the facility manager can do to control these rising costs 4.Be able to identify where to go for professional help and financial assistance
3 The Times, They Are A-changing! Bob Dylan
4 Gal./Person/Day Billions of Gal./Day Public and Domestic Water Use USGS US Per Capita Use (gpcd) Total Municipal/Domestic Use 10
5 Gallons per Person per Day 200 Average Per Capita Water Use Rate for Texas' Six Largest Cities

6 New York City Went from 222 GPCD in1978 to 119 GPCD in 2015 GPCD was 222 in 1979 now 118 Source: Vlada Kenniff, City of New York

7 Future Installed Generating Capacity Worldwide Bloomberg Study
8 Gallons Consumed per KWh Coal Fired Steam Plants Electric Power Generation Water Consumption With and Without CO2 Sequestration Intergrated Coal Gasification Without Sequestration Natural Gas Combined Cycle With Sequestration Solar & Wind
9 Cost of Water
10 Circle of Blue April, Price of Water 2015: Up 6 % in 30 Major U.S. Cities; 41 % Since 2010!

11

12 Even in Chicago, the Mayor Wants to Double Water Rates!
13 Water is the oil of the 21st century. Andrew Liveris, Chief Executive, Dow Chemical Co., August 2008.
14 American Society of Civil Engineers gives the nation s water systems a grade of D, the lowest grade of any infrastructure including roads and bridges.

15 Water & Wastewater Costs for Restaurants in California in Dollars per hundred cubic feet
16 Average Residential Water and Sewer Rates in European Countries Compared to USA Sources of Information: Europe - USA - USA (Black & Veatch) Czech Republic England France Germany Austria Denmark $0 $5 $10 $15 $20 $25 $30 $35 $40 Dollars per Thousand Gallons
17 Cents per Kilowatt Hour 13 National Average Electricity Prices (Energy Information Administration) Residential Commercial Industrial Transportation

18 Dollars per Thousand Gallons PROJECTED FUTURE COST OF WATER AT CURRENT INFLATION RATE OF 5.85% Year
19 And again - The True Cost of Water Water Cost Sewer/Pre-treatment Energy Chemicals Solid Waste Disposal Capital Equipment Labor Liability


 Natural Gas")
20 Projected Future Costs (water = 5.85%, Electricity & Nat. Gas = 2%) Water ($/kgal) Natural Gas ($/MCF) Electricity ( /kwh)
21 And again, The Times, They Are A-changing! Bob Dylan
22 Codes, Standards, Rating Systems, and Guides

23 Going Green is the In Thing According to Charlie Brown
24 Regulations, Codes & Incentives Green is in Codes & Standards Rating Systems Guides New Federal regulation New sources of information
25 Codes, Standards, Guidelines, & Rating Systems Codes provide minimum safeguards for people with regard to building safety and fire prevention. Codes protect health, safety and welfare. How to build it. Standards are developed as an extension of code requirements. Standards represent consensus on how a material, product or assembly is to be designed, manufactured, tested or installed to obtain a specific level of performance. How to make it. Guidelines provide information on how best to apply codes and standards and other practices to achieve the best result. Suggests best way to do it. Rating Systems are used to determine if a project, building, or product meets certain green standards. Tells how green a project or building is.


26 Examples of Codes
27 IAPMO Example Water Topics Water-Conserving Plumbing Fixtures and Fittings General Water Closets Urinals Lavatory Faucets Showers Commercial Pre-Rinse S pray Valves Emergency Safety Showers and Eye Wash Stations Drinking Fountains Water and Drain Pipe Sizing Installation Appliances Dishwashers Clothes Washers Water Pressure Maximum Point-of-Use Reverse Osmosis Water Treatment Occupancy Specific Water Efficiency Requirements Commercial Food Service Medical and Laboratory Equipment Leak Sensing and Protection Devices Fountains and Other Water Features Use of Alternate Water Source for Meters Required Special Water Features Consumption Data Access HVAC Water Efficiency Once-Through Cooling Cooling Towers and Evaporative Cooling Cooling Tower Makeup Water Use of Reclaimed and On-Site Treated Non-Potable Water for Cooling
28 Alternate Sources of Water Municipally Reclaimed Water Gray Water (untreated) Rainwater Alternate On-site Sources Treated graywater, on-site wastewater reuse, A/C condensate, foundation drain water, swimming pool backwash, RO reject water, stormwater, etc.


29 Two Must-Have Guide Books
30 Green Building Rating Systems Numerous national green building GUIDELINES USGBC LEED Program: LEED 2014 U.S. EPA WaterSense SM for New Homes CHPS - Collaborative for High Performance Schools GGHC - Green Guide for Health Care Built Green Florida Water Star SM Environments for Living (Masco) Build-it-Green Green Globes Green Build Initiative
31 US Green Building Council 2014 LEED Products Homes Neighborhoods 2013 LEED Commercial New Construction Existing Buildings Core & Shell Commercial Schools Health Care Retail
32 LEED Water 2014 Metering Landscape Fixtures % fittings Cooling towers Medical equipment Appliances & equipment Wastewater
33 0% 10% 20% 30% 40% 50% 60% 70% 80% 90% 100% Reduction in Water Use Since 1980 for Appliances and Plumbing Fixtures Urinals Commercial Dish Washers Residential Dish Washers Residential Toilets Pre-Rinse Spray Valves Residential Clothes Washers Commercial Toiltes Shower Percent Reduction in Use From Best in Class
34
35 Office Warehouse and storage Education Mercantile Lodging Public assembly Service Religious worship Vacant Healthcare Inpatient Other Food service Healthcare Outpatient Public order and safety Food sales Commercial Buildings in USA Billions of Square Feet in 2012 Billions of Square Feet
36 Water Use of Texas Utilities TWDB SB 181 Report Large Significant ICI Utilities (5) Medium-Large Significant ICI Utilities (5) Metropolitan Utilities Medium Significant ICI1 Utilities (27) Large Utilities (30) Medium-Large Utilities3 (31) Medium Utilities (237) Gallons per Person per Day Residential GPCD ICI & Other GPCD
37 USGS Consumptive Uses Estimates for Non-Agricultural Uses ICI 53% Domestic 47%
38 So How Does this Apply to Me!


39 Diaphragm Flush Valves Have Interchangeable Parts!


40 Make Sure You Have the Right Part


41 Sloan Crown Valve Kohler's Sloan Uppercut 1.28 GPF Toilet
42 Cost to Flush a Toilet at Current Inflation Rate of 5.85% Gallons per Flush Cents per Flush in 2015 Cents per Flush in
43 Dollars per Year for Flushing One Toilet in 2015 Gallons per Flush Cents per Flush Type of Facility Home Office Restaurant 6 flushes per day (365 days) 35 flushes per day (260 days) 75 flushes per day (365 days) $107 $446 $1, $74 $309 $ $35 $146 $ $26 $109 $329
44 Dollars per Year for Flushing Gallons per Flush Cents per Flush One Toilet in 2035 Type of Facility Home Office Restaurant 6 flushes per day (365 days) 35 flushes per day (260 days) 75 flushes per day (365 days) $337 $1,401 $4, $237 $983 $2, $107 $446 $1, $88 $364 $1,095
45 Measuring Flushvalve Toilet Water Use Us the meter to determine use per flush by flushing enough times to get an accurate reading Timing method 1-3 seconds 1.28 to 1.6 gal/flush seconds 1.6 gal/flush 4-5 seconds 3.5 gal/flush Over 5 seconds 5.0 gal/flush + If the toilet marked 1.6 takes more than 3.5 seconds, either it has the wrong diaphragm or the diaphragm need to be replaced

46


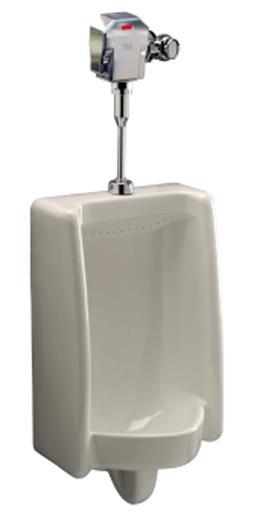
47 Wash Down One Pint Waterless
48 Floor Drain Trap Primers Primer Type Actuations per Day Water Use Continuous Continuous Extremely High! Flush-activated Depends on Flush Valve Use Very Low Pressure-Sensitive Depends on Fixture Use Very Low Electronic 1 Very, Very Low P-trap Primer Depends on Fixture Use 0
49 Shower Standards EPACT of GPM Water Sense 2.0 GPM Multiple Shower Heads??
50 Commercial Faucets Commercial Lavatories and Restrooms 0.5 gpm Self closing faucets No more than 0.25 gallons per use Water Sense hand washing lavatories 1.5 gpm Kitchen faucets 2.2 gpm
51 Plumbing Take-Away Use WaterSense Criteria as you guide. Toilets 1.28 gal./flush (1.6 gal./flush if long drain line) Urinals 0.5 gal./flush or less Public restroom lavatory faucets 0.5 gpm or less Self closing lavatories 0.25 gallons per cycle Showers 2.0 gpm or less Trap primers electronic or flushvalve primers Water fountains self closing One shower head per shower stall
52 Water Use by Fixture Type Fixture Type Toilet (Gal./Flush) Urinal (Gal./Flush) Faucets (Gal./Min.) Current Lowest (commercial) Energy Policy Act 1980 s Before 1980 s
53 Typical Plumbing Fixture Uses Per Person Per Day Toilet Urinal Faucet Males Females %/50%
54 Total Water Daily Use per Person Assumes 50%/50% male/female Fixture Type Lowest Energy Code 1980 s Before 1980 s Toilet Urinal Faucet TOTAL
55 Figure 1. Annual Plumbing Fixture Cost for a Building with 500 Employees open 255 days/year $ per Thousand Gallons $12 $10 $8 $6 $4 $0 $5,000 $10,000 $15,000 $20,000 $25,000 $30,000 $ per Year Current Lowest Code* 1980's Before 1980 s
56 $0 $5,000 $10,000 $15,000 $20,000 $25,000 $30,000 $35,000 $40,000 $45,000 $50,000 $55,000 $60,000 $65,000 $70,000 $75,000 $80,000 What 20 Years Means for Total Cost for Example Old Wasteful Type Best Available


57 Pop up Sprinkler Heads Have Flow Rates of 1.5 gpm to 5.5 gpm
58 What does it cost to water? The old standard pop up uses 4 gpm. That is 4 per head per minute If there are 15 heads and you operate it for 20 minutes, it costs $12. That is equal to paying an employee $36 per hour. How many zones do you have and how many times do you run them a week? By the way, at 5.85% inflation, in 20 years (2035) it will cost you $38 to water 20 minutes which is equal to an employee at $114 per hour.
59 Another Example from Restaurants and Food Service
60 Cents per Gallon Cents per Gallon of Water Used By Type of Use 2013 Commercial Dishwasher Lavatory Toilet Water/Sewer Energy Chemical BOD/TSS Charge
61 Cents per Meal Current and Future Cost per Meal 2014 & 2034 Includes kitchen, restrooms & other indoor uses Low Use (5.0 Gal/Meal) Medium (6.8 Gal/Meal) High Use (9.5 Gal./Meal)
62 The Evolution of Ware Washing Based on conveyor type dishwasher 1990 s Gallons per Rack Gallons per Rack 2015 most efficient < 0.4 Gal./Rack

63 Conveyor Dish machines
64 Cents/kWh or $/MCF Energy Costs for Heating Water Assumes 70 o F Temperature Increase $0 $2 $4 $6 $8 $10 $12 $14 $16 $18 $20 $/1,000 Gallons $22 $24 $26 $28 $30 $32 $34 Gas Electric
65 Annual Facility Hot Water Use in California 6.5 million
66 Annual Sector Hot Water Load in California
67 Refrigeration & Ice Making


68 Air cooled ice machine Jump to first page Water cooled ice machine (no louvers)
69 Generalized Energy Recommendations from DOE for Ice Machines Used at Federal Facilities Machine Capacity in Pounds of Ice Produced per Day Kilowatt Hours for Air Cooled Machines Kilowatt Hours for Water Cooled Machines Difference Energy Cost Savings (Cents per 100 pounds of 10) 500 to 750 <5.5 < to 1500 <5.0 < up <4.6 < Average Savings per 100 Pounds of Ice Based on Electricity at 10 Cents per kwh 13.7
70 Air Cooled Cost Savings Using DOE Latest Recommended Energy Standards for Ice Machines At a water cost of only $2.50/Kgal!!!! Gallons per 100 lb. Cost of Water and Wastewater Combined $2.50 per kgal (Cents/100 Pounds) Energy Savings per 100 Pounds With Water Cooled Equipment (Cents/100 Pounds) Net Savings per 100 Pounds with Air Cooled Equipment (Cents/100 Pounds)
71 Lifetime Utility Cost Analysis 1,000 lb/day machine, Water $7.60/kGal. Elec. 10 cents/kwh, 120 gallons of cooling water, DOE Recommended Efficiencies WATER COOLED AIR COOLED IN AIR CONDITIONED SPACE AIR COOLED REMOTE HEAD AIR COOLED IN UNAIR- CONDITIONED SPACE $0 $10 $20 $30 $40 $50 Thousands of Dollars over 8.5 Year Lifetime
72 Ice Machine Recommendations Use ONLY EnergyStar Rated Equipment: Use Air Cooled Equipment or if water cooled ice machines are used connect directly to a chilled water loop. Choose flake or nugget (continuous) type machines using less than 14 gallons per 100 pounds of ice where ever possible. If cube machines are use, they should use less than 20 gallons of water per 100 pounds of ice.


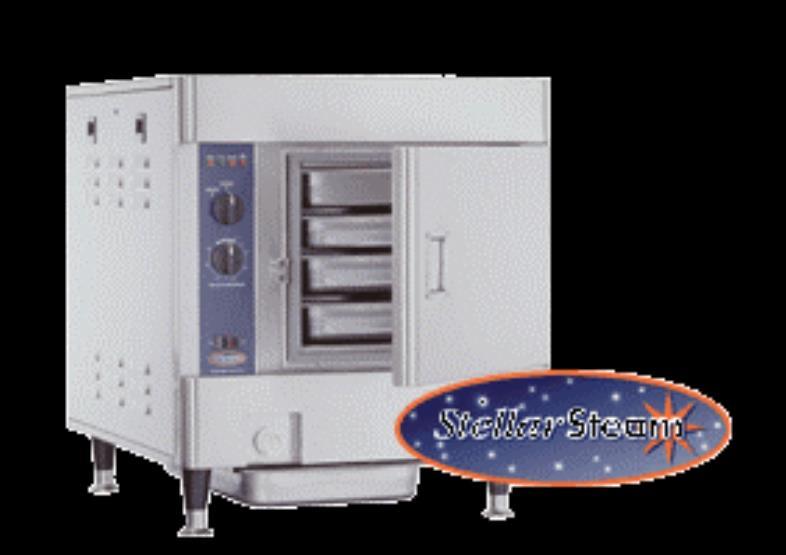

73 New Generation Steamers No deliming Longer Element life No vent hood
74 $35,000 $30,000 Purchase Water Maintenance Energy Present Value $25,000 $20,000 $15,000 $10,000 $5,000 $22,900! $0 Standard Efficiency ENERGY STAR
75 Steamer Recommendations Use only EPA EnergyStar qualified Steamers Boilerless type steamers shall consume not more than 2.0 gallons per compartment per hour. Boiler type steamers shall consume not more than 1.5 gallons per pan per hour.

76 With Combination Ovens, energy efficiency does not necessarily equal water efficiency!
77 Gallons per Pan per Hour 4.5 Summary of Combination Oven Water Use Rates from Food Service Technology Center for Energy Efficient Rebate Information July models ranging from 6 to 40 pans Steam Mode Gal./Pan/Hr. Convection Mode Gal./Pan/Hr.
78 Combination Ovens Recommendations EPA has not completed certification of combi ovens Combination ovens shall not use water in the convection mode except when utilizing a moisture nozzle for food products in the oven. The total amount of water used by the moisture nozzle in the convection mode shall not exceed a half a gallon per hour per oven cavity. When operating in the steamer mode, combination ovens shall use no more than 1.5 gallons per hour per pan.
79 Keeping it cool


80 Cooling towers come in all sizes
81 Energy Savings With Cooling Tower over Air Cooling Energy savings 0.3 to 0.4 kwh/ton-hr Equal to about 3.0 to 4.0 cents in most markets

82
83 Two Hospitals from Across the Nation Florida Arizona Cooling Towers 43% Toilets 20% Other Plumbing 8% Food Service 8% Medical Equip. 9% Leaks & Other 8% Domestic 41% Cooling Towers 49% Food Service 4% Medical Equip. 1% Irrigation 5% Boilers 4%
84 100% Summary of Audits of 30 Large Facilities with Cooling Towers in Downtown Fort Worth Texas Water Management, Inc. 90% 80% 70% 60% 50% 40% 30% Other Irrigation Domestic Cooling 20% 10% 0% Courthouse Hotel University Offices Hospital
85 Gallons per Ton Hour Make Up, Blowdown and Evaporation vs. Cycles of Concentration Cycles of Concentration
86 National Combined Water & Sewer Cost per Ton Hour in 2013 Highest Average Lowest Cents per Ton Hour With Evaporation Credit No Evaporation Credit
87 Cents per Ton Hour 12 Graph of Water, Sewer & Water Treatment Costs Vs. Electric Energy Savings With Chilled Water/Cooling Tower Air Conditioning Assumes a savings of 0.35 kwh/ton hour with cooling tower and national average water use of 2.0 gallons per ton hour Year Electricity Savings With Cooling Tower Sewer Costs per Ton-Hr With Evaporative Credit Water & Sewer 2 Gal./Ton-Hr

88 Energy Costs vs. Water Costs Where are the Tipping Points?
89 If you don t measure it, you CAN NOT manage it!
90 What Data Management Can Do Real time management Alert to problems before it is a problem Provides a continuous history Remote viewing
91 550 A Large Chinese Buffet Restaurant 1,000's of Gal. /Month Sep-03 Oct-03 Nov-03 Dec-03 Jan-04 Feb-04 Mar-04 Apr-04 May-04 Jun-04 Jul-04 Aug-04 Sep-04 Oct-04 Nov-04 Dec-04 Jan-05 Feb-05 Mar-05 Apr-05 May-05 Jun-05 Jul-05 Aug-05 Sep-05

92 Data Management & Process Control
93 Do you have a water use balance for your facility?


94 EPA WaterSense National Averages
95 We have only covered a few of the water using technologies found in commercial and institutional facilities.
96 And there are may other things to look at Food Service Plumbing Boilers Cooling Towers Energy Implications Laundry Water Treatment Cleaning Parks, Zoos, Golf Courses Landscape Irrigation Dental & Medical Facilities Industrial Processes Vacuum Pumps Hood Scrubbers Wastewater Implications Pools, Spas, and Water Features Vehicle Washing On-site water recycling and reuse Metering and Sub metering Pressure regulation Leak identification and detection Water Use Analysis Benefit/Cost Analysis
97 So Where can I go for help?

98 Publications & Trade Shows
99 Examples of Facility Management Organizations American Society for Healthcare Engineering (ASHE) Association of Facilities Engineers (AFE) International Facility Managers Association (IFMA) Building Owners & Managers Association (BOMA)
100 Sources of Assistance Arizona Department of Water Resources California Urban Water Conservation Council Conserve Florida Water Clearinghouse Maximum Performance Testing Web Site Alliance for Water Efficiency EPA Water Sense and Energy Star Programs Dept. of Energy, Dept. of Defense, Bureau of Reclamation, Corps of Engineers
101 More sources H2O Conserve Water Use it Wisely Food Service Technology Center Consortium for Energy Efficiency Texas Water Development Board Save Texas Water
102 So how can the ICI Customer get it done? Do it yourselves Contract it out in pieces Design/Build contract Performance contract
103 Funding Assistance for ICI Programs Utility Funding & Rebates Third Party Funding (PACE) Performance Contracts and Shared Savings
104 Performance Contracting Before Contract Period After O&M Water/Sewer Payback
105 The Cheapest Water You Will Ever Have Is The Water You Already Have!
106 Learning Objectives 1.Learn how water and wastewater costs will increase even faster in the future 2.Review changing codes and standards regarding water use 3.Understand what the facility manager can do to control these rising costs 4.Be able to identify where to go for professional help and financial assistance
107 So Let s Get Started! Questions?
108