Finalizing the Chesapeake Bay Health Index (BHI)
|
|
|
- Christopher Stokes
- 5 years ago
- Views:
Transcription

 & the Living Resources Analysis")
1 Finalizing the Chesapeake Bay Health Index (BHI) Part 1: Water Quality Index Part 2: Biotic Index Bill Dennison Ben Longstaff, Michael Williams, Claire Buchanan, Roberto Llansó, and Peter Bergstrom On behalf of the Tidal Monitoring and Analysis Workgroup (TMAW) & the Living Resources Analysis Workgroup (LivRAW)
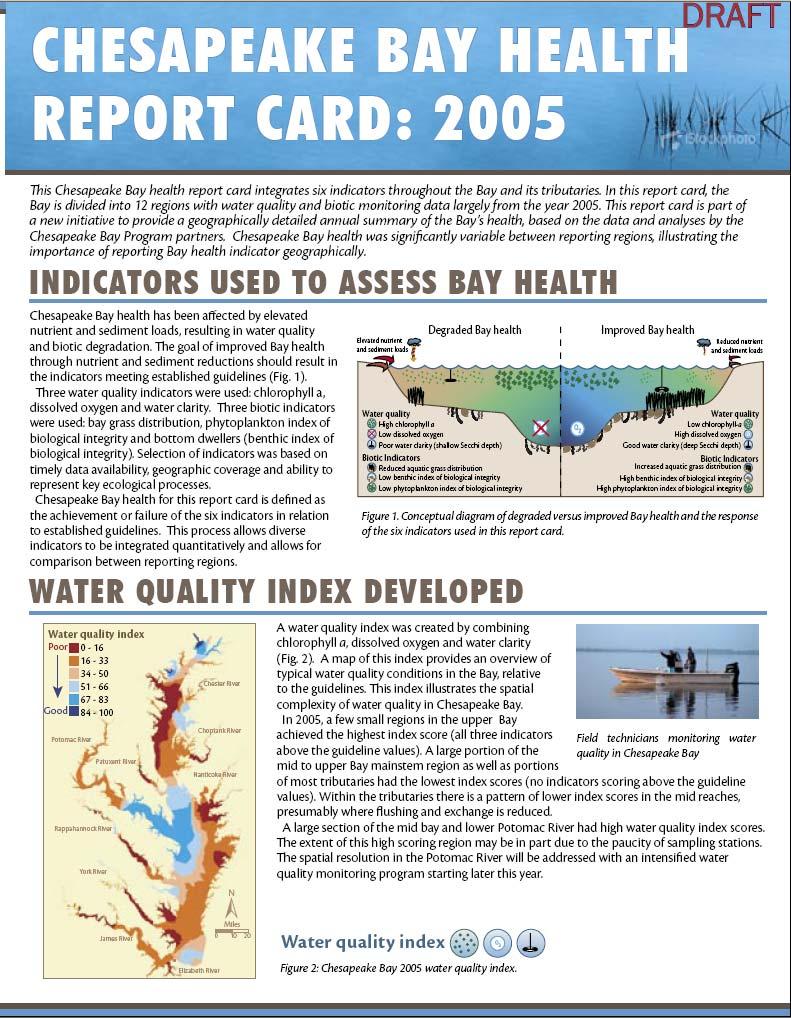
2 Major outcomes Water Quality Index (Chlorophyll, Dissolved Oxygen, Clarity) will be calculated and mapped, but not necessarily included in calculation of Bay Health Index Bay Health Index (SAV, BIBI, PIBI) will be calculated, tabulated and used to compare reporting regions Reporting regions will be altered to group smaller tributaries, more aligned with trib strategies A scale will be used with 5 divisions (stoplight color scheme) A Bay-wide integration will be calculated from the area-weighted individual indices
3 Strengths of health assessment approach Rigorous, ecosystem health-related thresholds Biotic indicators are integrative in nature SAV (long term) Benthic IBI (medium term) Phytoplankton IBI (short term) Indicators provide assessment of different Chesapeake Bay habitats Shallow water assessed with SAV Deep water assessed with Benthic IBI Open water assessed with Phytoplankton IBI Mid-channel assessed with water quality Long term data trends of each indicator available
4 Key communication issues Provide individual data maps Express long term data trends of each indicator Develop new table: sample size (146 x 12-20; 250 x 1; 25 x 12-13); time frame for integration (chl = Mar-Sep; DO = Jun-Sep; Clarity = Mar- Nov); range of values, etc. Develop ways to calculate and express variability Use conceptual diagrams to link indicators and various key living resources & habitats
5 Index categories
6 Conceptual diagram
7 Indicators selection Proposed indicators for 2006 report Water quality Habitat and lower food web Dissolved oxygen Bay grasses Clarity (Secchi depth) Phytoplankton Chlorophyll a Bottom habitat
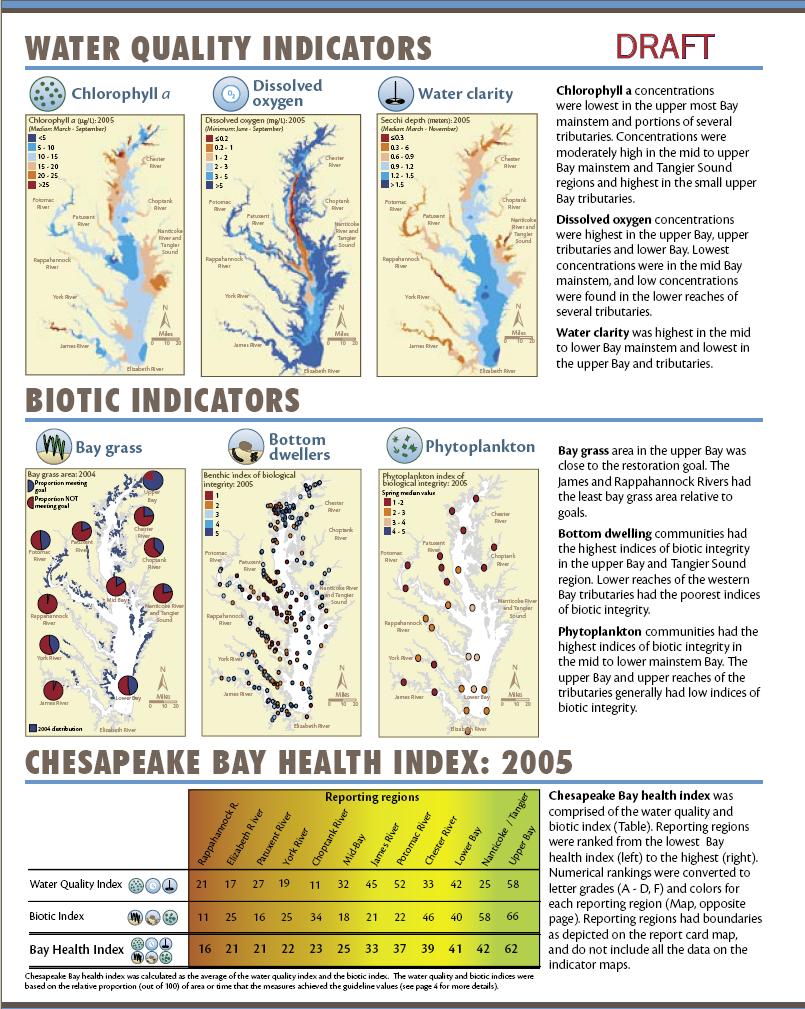
8 Water quality maps

9 Water Quality Index 2002 low flow year Water Quality Index 2003 high flow year
10 Biotic indices maps
11 Future indicator development Chemical contaminants Human health threshold (not water quality) Tissue samples (integrate over time) Do not respond annually Uncertain geographic representation Confusion with EPA Coastal Condition vs. 303(d) listing Nutrients Trend data has linear and non-linear trends Criteria definition needs to be elucidated Other examples of separating nutrient concentrations from symptom expressions (e.g., National Estuarine Eutrophication Assessment) Nutrient limitation approach (Fisher et al.) and nutrient concentration approach could be used PIBI and Chl are good integrators of nutrients Nutrients are flashy vs. more integrative measures
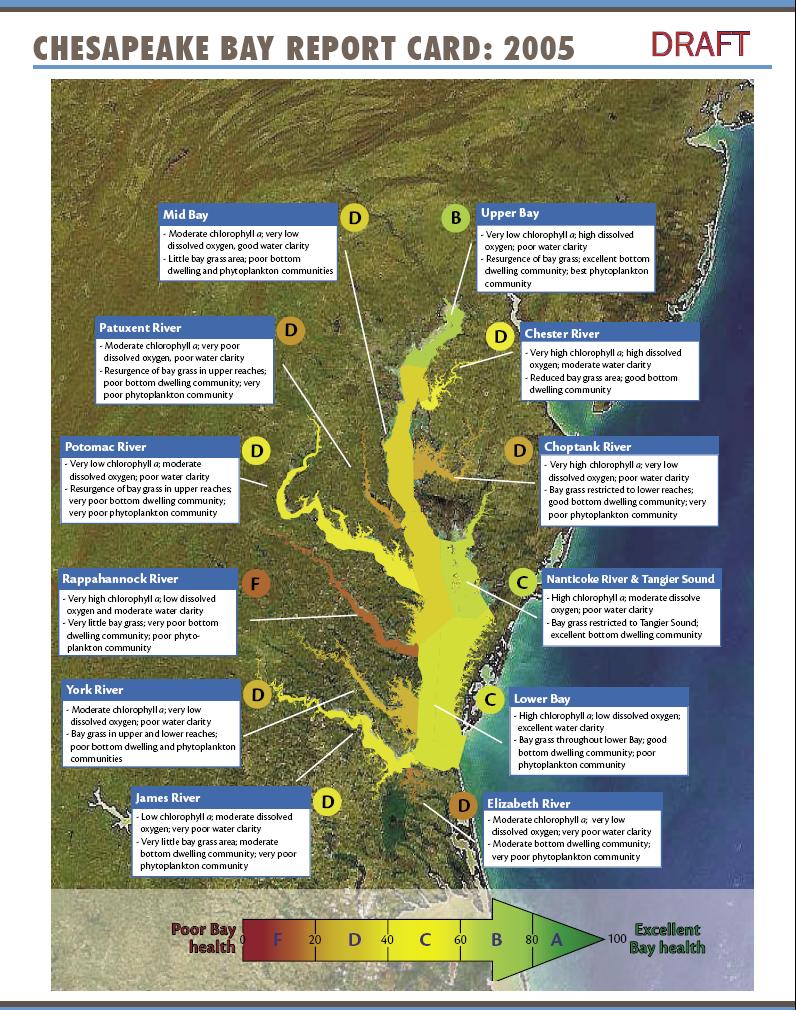
12 Reporting regions
13 Reporting regions issues Use detailed maps of depth contours, residence time Indicate stations on data maps Provide station by station data (e.g., pdf) Develop a hyperlinked data set (2007) Work toward developing mapping approaches and continuous data distributions so that reporting regions are less important

14 Revised reporting regions 1. Upper Bay 2. Mid Bay 3. Lower Bay 4. Patapsco-Back 5. Patuxent 6. Potomac 7. Rappannock 8. York 9. James 10.Elizabeth 11.Tangier 12.Choptank 13. Chester 14.Lower Eastern shore 15.Upper Eastern shore 16.Upper Western shore 17.Lower Western shore
15 Benchmark approach issues Investigate different methods of establishing benchmarks Percentiles (cumulative frequency distributions) Link benchmarks to living resources (e.g., DO from BIBI; Clarity from SAV) Model results Compare different thresholds (table)

16 Chesapeake Bay health assessment
17 Biotic indices: Bay grasses, Benthic Index of Biotic Integrity, Phytoplankton Index of Biotic Integrity
18 Next steps Link spatially explicit bay health index with Bay Health & Restoration Assessment Continue to build technical supporting documentation Mock up communication product(s) using alternative approaches Engage communication specialists, IC, STAC and other reviewers and incorporate feedback
19 Retrospective analysis of biotic indicators
20 Example cumulative frequency distribution 20 > 1 Km Percent
21
22
23
24
25 Indicators selection Current indicators Water quality Habitat and lower Fish and Shellfish food web Dissolved oxygen Bay grasses Blue crab Clarity (Secchi depth) Phytoplankton Oyster Chlorophyll a Bottom habitat Striped Bass Chemical contaminants Tidal wetlands Shad Menhaden Not all indicators can be included at this stage because: Some are still being developed (tidal wetlands and menhaden) Timeframe not suitable (chemical contaminants) Goals and assessment at bay-wide scale (striped bass, blue crab, oysters) Indicator is for a specific location only (shad)
26 Discrete regions of the Bay used for purpose of reporting Not too many in number (currently 14) Must contain sufficient number of sampling stations for analysis Based on current CBP segmentation Group like water bodies Align, where possible with tributary strategy boundaries, other strata (e.g., B-IBI) Reporting regions
27 Methods: Biotic Index Aquatic grasses (SAV) Michael Williams (CBP/UMCES) Benthic Index of Biotic Integrity (B-IBI) Roberto Llansó (Versar) Phytoplankton Index of Biotic Integrity (P-IBI) Claire Buchanan (ICPRB) Biotic and Bay health index Michael Williams (CBP/UMCES)
 All segment goals within a reporting region combined reporting")
28 Aquatic grasses: goals Restoration goals for each Chesapeake Bay segment (Use Attainability Analysis) All segment goals within a reporting region combined reporting region goal (ha)
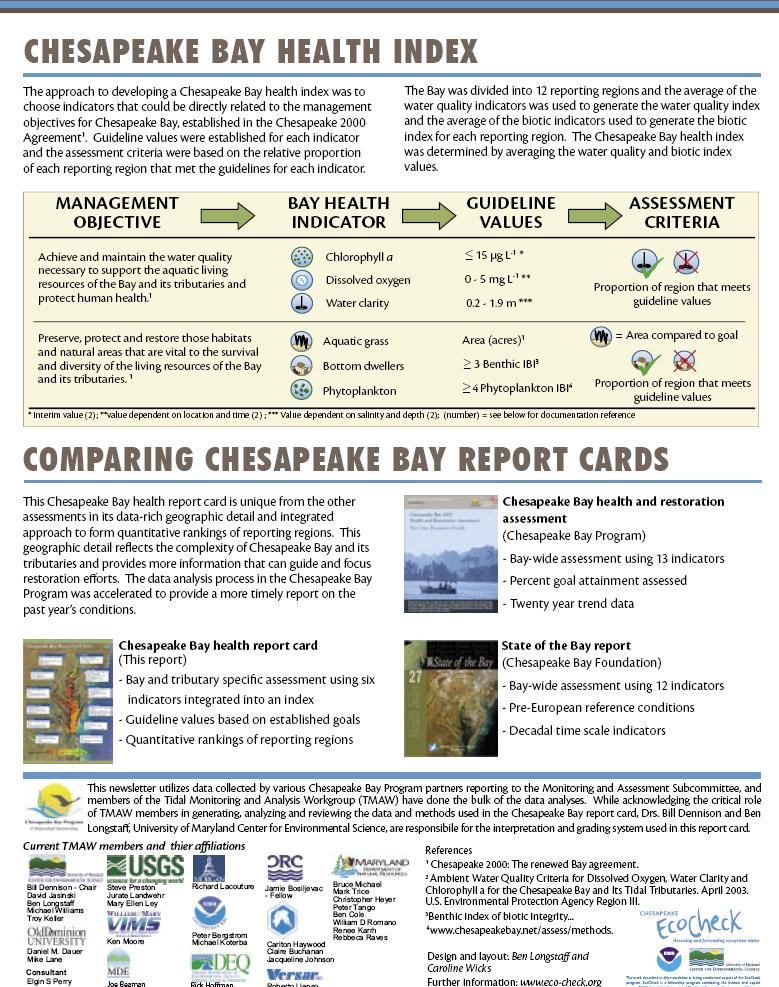
29 Aquatic grasses: compliance assessment Most recent year data Compliance of a reporting region Total area present (acres) as a proportion of the total restoration goal If SAV acreages exceed the restoration acreages, that segment s SAV was reduced to equal the restoration acreage (i.e., can only = 100% or less)
30 Benthic-IBI: data Chesapeake Bay Benthic Monitoring Program data Collected August through September Approximately 250 stratified random sampling stations Location of Benthic monitoring probability-based sites in 2005
31 Benthic-IBI: goals Chesapeake Bay Monitoring Programs have adopted Benthic Community Restoration Goals as a monitoring tool The restoration goals are quantitative benchmarks: They describe the characteristics of benthic assemblages expected in non-degraded habitats The B-IBI is scaled from 1 to 5, and sites with values of 3.0 or more are considered to meet the Restoration Goals.
32 Benthic-IBI: compliance assessment Multi-metric, habitat-specific index of benthic community condition Selection of metrics and the values for scoring metrics developed separately for each of seven benthic habitat types in Chesapeake Bay Described in: Weisberg et al. (1997), Estuaries 20: Alden et al. (2002), Environmetrics 13:


33 Benthic Index of Biotic Integrity Metric Scoring System

34 Excess Abundance or Excess Biomass Indicative of Stress
35 Metrics Metric Shannon-Wiener species diversity index Total species abundance Total species biomass Percent abundance of pollution-indicative taxa Percent abundance of pollution-sensitive taxa Percent biomass of pollution-indicative taxa Percent biomass of pollution-sensitive taxa Percent abundance of carnivore & omnivores Percent abundance of deep-deposit feeders Tolerance Score Habitat Class TF OL LM HM sand HM mud PO sand PO mud X X X X X X X X X X X X X X X X X X X X X X X X X X X X X X X X X X X X X X Tanypodinae to Chironomidae percent abundance ratio Percent biomass >5 cm below the sediment-water interface Percent number of taxa >5 cm below the sedimentwater interface X X X X
36 Benthic-IBI: compliance assessment Estimate the amount of area in a reporting region that meets the Restoration Goals (B- IBI >=3.0) Every site that meets the goal assigned a value of 1, otherwise a site is assigned 0 Proportion of area meeting the goals and its variance is estimated For some reporting regions, estimates were calculated for subregions and these were then combined using proportion of area as weighting factor.
37 Phytoplankton: Data VA and MD Phytoplankton Monitoring Survey Data Approximately 25 stations Collected times a year Spring (March, April, May) Summer (July, August, September)
38 Phytoplankton IBI - Goal PIBI interim goal of 4.0 ( scale) high level of biological integrity is certain very low risk of harmful algal blooms assoc. WQ meets SAV habitat requirements commensurate with Ches Bay water clarity and DO criteria attainment Not establish how attainment of a PIBI goal of 4.0 should be measured (mean? median? threshold? 10 th %?)
39 Application of BIBI method to PIBI
40 Application of BIBI method to PIBI
41 Findings Pass/fail method currently used to report BIBI status can also be successfully applied to PIBI Goal of 100% PIBI > 3.0 threshold criterion is in general agreement with goal of median or mean PIBI = 4.0 % of Goal method used to report the 3 biotic and 3 water quality indicators differs from % attainment of water quality criteria methods
42 Recommendations Align methods and goals to that used for the Benthic IBI % achievement of the threshold criteria Threshold criteria defined as median PIBI of 3 Area weighted
43 Phytoplankton-IBI: compliance assessment
44 Phytoplankton-IBI: compliance assessment
45 Biotic Index 2002 data data Reporting Regions P-IBI B-IBI SAV BI Reporting Regions P-IBI B-IBI SAV BI Nanticoke NA NA 0 0 Nanticoke NA NA 0 0 Patapsco Chester NA Patuxent Patuxent James Mid Bay Elizabeth NGZ 31 Choptank York Potomac Chester NA Rappahannoc Potomac Elizabeth NGZ 36 Tangier Sound NA York Mid Bay Patapsco Choptank James N Bay N Bay Rappahannoc Tangier Sound NA S Bay S Bay
46 2002 Bay Health Index 2002 data Reporting Regions Chl-a DO Clarity WQI P-IBI B-IBI SAV BI BHI Patapsco Nanticoke No data No data Elizabeth NGZ York James Chester No data Potomac Patuxent N Bay Mid Bay Rappahannoc Choptank Tangier Sound No data S Bay
47 2003 Bay Health Index 2003 data Reporting Regions Chl-a DO Clarity WQI P-IBI B-IBI SAV BI BHI Nanticoke No data No data Patapsco Chester No data Patuxent Choptank Mid Bay Elizabeth NGZ Potomac York Rappahannoc N Bay James Tangier Sound No data S Bay
48 Question to address: Do we agree with the proposed approach for assessing compliance for each of the three indicators (Aquatic grass, BIBI, PIBI)? Data sources? Goals and thresholds? Compliance assessment methods? Do we agree that Biotic index is determined as the average of the 3 compliance estimates
49 Question to address: Do we agree that Bay health index is determined as the average of the 2 component indices (Water quality index & Biotic index)? What are the appropriate groupings for the BHI values: Those proposed? Another? How might the index be improved in the future
50 Phytoplankton-IBI: compliance assessment