Measurements and Models of Primary Productivity
|
|
|
- Muriel Townsend
- 5 years ago
- Views:
Transcription


1 Measurements and Models of Primary Productivity Supported by NSERC 1 including OTN John J. Cullen! Department of Oceanography, Dalhousie University Halifax, Nova Scotia, Canada B3H 4R2! 2014 C-MORE Summer Training Course Microbial Oceanography: Genomes to Biomes Provided by the SeaWiFS Project, NASA/Goddard Space Flight Center and ORBIMAGE

2 Source of some reading MacIntyre and Cullen 2005 Parkhill et al for reading lists, ! 2 John Cullen: C-MORE 2013
3 What is marine primary productivity? Net Primary Productivity (Production)!! Net rate of synthesis of organic material from inorganic compounds such as CO 2 and water!! Chemosynthesis: chemical reducing power comes from reduced inorganic compounds such as H 2 S and NH 3!! Photosynthesis: reducing power comes from light energy!! Photosynthetic primary production is usually measured and considered to dominate.!! 3 g C m -3 h -1!!!g C m -2 d -1!
, Frontiers in Ecology and the Environment, 2(9),")
4 More to it than that, of course 4 Doney, S. C.,et al. (2004), Frontiers in Ecology and the Environment, 2(9),
 John Cullen: C-MORE")
5 Biological oceanography and phytoplankton ecology Describe the causes and consequences of variations in primary productivity (and food web structure) John Cullen: C-MORE 2013

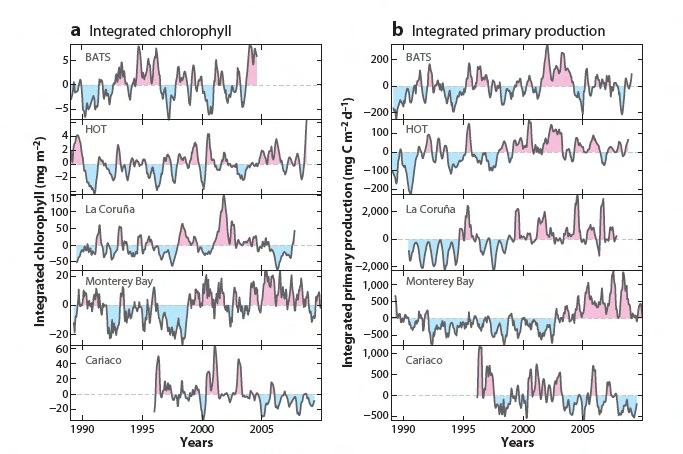
6 Why measure and model primary productivity? Ecological prediction! Biogeochemical models! Climate change scenarios 6 Behrenfeld et al. Nature 2006
7 Oxygenic Photosynthesis This process can be quantified directly by measuring the increase of oxygen, the decrease of CO 2, or the increase of organic carbon. Incubations can be conducted with 14 C, 13 C or H2 18 O added as tracers.!! The process has many chemical consequences that can be traced with measurements of the concentrations of oxygen and carbon, and their 7 isotopic signatures!
8 There are measurements and there are measurements Annual Review of Marine Science 2013

9 in vitro vs in situ
10 In situ estimates need calibration
11 Cullen, J.J., Plankton: Primary production methods. In J. Steele, S. Thorpe, K. Turekian (Eds.), Encyclopedia of Ocean Sciences (pp ): Academic Press.
.")
12 Effects of Light on Photosynthesis Net Photosynthesis = Gross Photosynthesis - Respiration Respiration is measured directly only in the dark. The light-dependent component is much harder to measure ( 18 O-tracer can be used for that). 12 Biological Oceanography (4): John Cullen


13 Effects of Light on Photosynthesis Net Photosynthesis = Gross Photosynthesis - Respiration Net photosynthesis is negative when irradiance is below the compensation irradiance. 13 Biological Oceanography (4): John Cullen
14 Relating oxygen evolution to carbon assimilation with the photosynthetic quotient Generalized reactions for growth on nitrate and ammonium 1.0 NO CO H 2 O! (C 5.7 H 9.8 O 2.3 N) O OH - P.Q. = 1.49 (O 2 evolved / CO 2 consumed) 1.0 NH CO H 2 O! (C 5.7 H 9.8 O 2.3 N) O H + P.Q. = 1.10 Note that more photosynthesis is required for growth on nitrate because the nitrate must be reduced. 14 Biological Oceanography (4): John Cullen
15 Inevitable comparisons with satellite-based estimates (models) 15
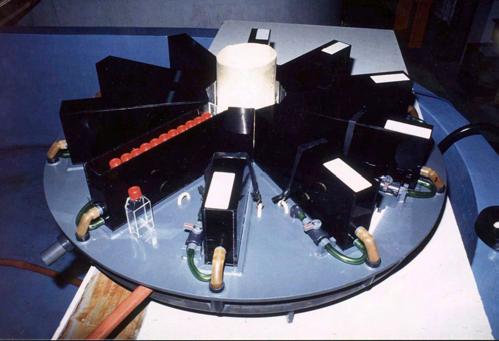
16 What is behind this? 16
17 Still a benchmark: The 14 C method for measuring primary productivity 17 HOT website
18 The 14 C method for measuring primary productivity 0 Productivity (mgc m -3 d -1 ) Depth (m) ± s.e.
19 An incredibly useful tool for time series and process studies HOT website 19
20 Ideally, the 14 C method measures net primary productivity 0 Productivity (mgc m -3 d -1 ) Depth (m) ± s.e h incubations Sometimes, it does

21 The measurement is subject to artifacts and biases Depth (m) Productivity (mgc m -3 d -1 ) Hypothesis: uncertainties inherent in the 14 C method are being forgotten with important consequences for the estimation of primary productivity using other methods ± s.e h incubations Cullen, J.J., Plankton: Primary production methods. In J. Steele, S. Thorpe, K. Turekian (Eds.), Encyclopedia of Ocean Sciences (pp ): Academic Press.
22 The measurement is subject to artifacts and biases 0 10 Productivity (mgc m -3 d -1 ) Overestimation due to exclusion of UV-B Depth (m) ± s.e h incubations
23 The measurement is subject to artifacts and biases Productivity (mgc m -3 d -1 ) Depth (m) Underestimation due to static incubation at excessive irradiance 40 ± s.e h incubations
24 The measurement is subject to artifacts and biases Productivity (mgc m -3 d -1 ) Depth (m) Underestimation due to dilution of intracellular DIC with respired cellular C 40 ± s.e h incubations
25 The measurement is subject to artifacts and biases 0 Productivity (mgc m -3 d -1 ) Depth (m) ± s.e h incubations Overestimation due to unnatural accumulation of biomass (disruption or exclusion of grazers)
26 The measurement is subject to artifacts and biases 0 Productivity (mgc m -3 d -1 ) Depth (m) ± s.e h incubations Underestimation due to food-web cycling! (microbial respiration and excretion)
27 The measurement is subject to artifacts and biases 0 Productivity (mgc m -3 d -1 ) Depth (m) h incubations Overestimation due to inadequate time for respiration to be measured
28 and that s not all: 0 10 Productivity (mgc m -3 d -1 ) Toxicity! Relief of iron limitation! Exposure to bright light! Disruption of fragile cells! Depth (m) for Simulated in situ:! Poor match of irradiance! 40 Inappropriate temperature! h incubations Possible diel bias
29 Productivity normalized to Chl is biased by: 0 10 Productivity (mgc m -3 d -1 ) Changes in Chl during incubations! Depth (m) Inadequate extraction of Chl by 90% acetone! Interference from Chl b (fluorometric acid-ratio method) h incubations
30 and in general 0 Productivity (mgc m -3 d -1 ) Depth (m) Irradiance is not controlled! Respiration is not accurately measured h incubations
31 The measurement has its limitations Depth (m) Productivity (mgc m -3 d -1 ) ± s.e. Net production?! Gross production?! Overestimate?! Underestimate? 31
32 A less skeptical view
33 But we use it routinely 0 Productivity (mgc m -3 d -1 ) Depth (m) ± s.e. Water column integral is something like! net primary production! (photosynthesis less losses to respiration) 33 (extent depends on temperature, light and maybe nutrients)
34 Regardless, it has served us very well Time Series 34 Karl et al. in Williams et al. 2002
35 Process studies 35


36 Solving mysteries 36
37 10 Equatorial Pacific 140 W, 0 ± 2 P B opt Measurements vs Behrenfeld et al. Models "Mystery Solved" 8 Real measurements from JGOFS EqPac P B opt (gc gchl-1 h -1 ) 6 4 VGPM Exponential Model 2 Revised according to insights from Behrenfeld et al. Nature Temperature ( C)

38 Direct Measurements will Never Provide Synoptic Estimates of Productivity 38 marine.rutgers.edu/opp/


39 Continuous measures of optics reveal rates see 39

40 Ocean chemistry tells the tale even in the most oligotrophic waters 40 3 years of O 2 at POT: Ken Johnson
41 Models are required for many applications Productivity from ocean color! Ecological prediction! Biogeochemical models! Climate change scenarios 41
42 Photosynthesis normalized to chlorophyll is the foundation of productivity modeling chl $ P max (1 exp (α chl E) ' chl % & P max ( ) )!##### "##### $ P chl vs. E relationship 42 Behrenfeld and Falkowski L&O 1997
43 One approach: model the measurements! Optical Depth 43 Behrenfeld and Falkowski 1997a L&O

44 Simplified functions describe major patterns 44 Behrenfeld and Falkowski 1997a L&O
45 Is the measured/modeled pattern real? P B (mg C mg Chl -1 d -1 ) Measured nearsurface inhibition Depth (m)
46 Is the measured/modeled pattern real? P B (mg C mg Chl -1 d -1 ) or an artifact of fixed-depth incubation? Depth (m)


47 Measurements must be made on a shorter time scale Photosynthetron: Controlled laboratory incubation 47 (Lewis and Smith 1983)
48 A comprehensive approach Cullen, J. J., M. R. Lewis, C. O. Davis, and R. T. Barber Photosynthetic characteristics and estimated growth rates indicate grazing is the proximate control of primary production in the equatorial Pacific. Journal of Geophysical Research 97: Approach introduced 48by Jitts, H. R., A. Morel, and Y. Saijo The relation of oceanic primary production to available photosynthetic irradiance. Aust. J. Mar. Freshwater Res. 27:
49 Short-term measurements can detect near surface inhibition 0 Chlorophyll a (mg m -3 ) P B m. Chl (mg C m -3 h -1 ) Depth (m) Depth (m) MORNING 49 Principles described by Marra, Harris, Yentsch -- all prior to h: Chlorophyll and P max are nearly uniform in the 50-m mixed layer
50 Is measured near-surface inhibition real? Assessment with short-term P vs E 0 Chlorophyll a (mg m -3 ) P B m. Chl (mg C m -3 h -1 ) Depth (m) Depth (m) MIDDAY h: Chlorophyll and Potential Productivity are still nearly uniform in the 50-m mixed layer
51 Surface incubation led to artifact 0 Chlorophyll a (mg m -3 ) P B m. Chl (mg C m -3 h -1 ) Depth (m) Depth (m) INCUBATED h: Fixed-depth incubations at the surface are fried an artifact of sustained exposure 35% underestimation of ML productivity
52 Conventional 14 C: Near-surface inhibition is overestimated P B (mg C mg Chl -1 d -1 ) Artifact Depth (m) Error at the surface: big Error for integral: 8% 52
53 Consequences for a model: minor except for irradiance dependence of ΣP at higher daily irradiance Parameterization of an Artifact? 53 Behrenfeld and Falkowski Consumer s Guide: L&O 1997
54 Many models calculate P from measured relationships Depth (m) P (mg C m -3 d -1 ) From!! P B vs E! and! E vs depth! and!! Chl! to! daily water column net primary productivity 54
55 Results can be generalized P B / P B opt Z / Z 1%(PAR) P Z = P B opt B f ( E (0) PAR K E ) PAR k 55
56 Maximum P B is still a key parameter for most models 0 P B (g C g Chl -1 h -1 ) Z (m) Even the spectral ones even the quantum-yield models
57 Compared to other measures, P B opt is relatively insensitive to artifact P B (mg C mg Chl -1 d -1 ) Depth (m)
58 Global assessment of primary productivity requires global assessment of maximum P B 58 Behrenfeld and Falkowski 1997b L&O
59 P B opt modelled as a function of temperature 59 Behrenfeld and Falkowski 1997b L&O
60 Two commonly used functions 10 Maximum P B (g C g Chl -1 h -1 ) Eppley - type (e.g., Antoine et al 1996) B & F VGPM Temperature ( C) Behrenfeld and Falkowski 1997b L&O
61 You may have seen the figure 61 Behrenfeld and Falkowski 1997b L&O
62 Here are the measurements 40 Maximum P B (g C g Chl -1 h -1 ) Temperature ( C) Rutgers OPP Study Data Base
63 Compared with more measurements 40 Maximum P B (g C g Chl -1 h -1 ) Temperature ( C) Texas Shelf
64 and more measurements! Maximum P B (g C g Chl -1 h -1 ) Eppley Type Model VGPM Rutgers OPP Data Texas Shelf & Slope HOT BATS EqPac Arabian Sea JGOFS Ross Sea JGOFS Antarctic PFZ JGOFS PBmax Texas (SL) Temperature ( C)


65 The foundations of VGPM Published Statistical Fit Measurements (note scale) Behrenfeld and Falkowski 1997 L&O Underlying data + a few more data sets
66 General functions of T cannot capture major causes of variability in water column productivity 3 2 ln(measured/modeled) ± 2x error Temperature ( C)

67 Conclusion: General functions of T cannot capture major causes of variability in water column productivity 67 Relative Error

68 We must appreciate the implications of this unexplained variability 68
69 and implications of a carbon-based model that isn t! Times Cited: 353 (from Google Scholar, May 2014) Carbon cancels out!

70 How much confidence should we have? Juranek and Quay 2013 Ann Rev Mar Sci
71 Estimates like these (NPP) do not yet account for variable physiology beyond central tendencies 71 Behrenfeld et al. Nature 2006
72 The need to compare models with measurements 72

73 Validation is important 73
74 Model 74
75 Headline 75
76 Published model result Measurements! show the! opposite trend 76

77 Time Frame & Statistics Matter Measurements 77

78 Measurements! (no headlines) 78

79 It is also useful to remember the distinction between models and observations VGPM model Follows et al. Model 79
 20 40 60 80 100 20, 40, 60")
80 No one is immune! Many models cannot be directly verified 0 80 Mixing Depth (m) , 40, 60 min No mixing P T / P Tpot 8 h b 4 h 2 h
81 Conclusions Models of primary productivity are a fundamental requirement for describing and explaining ecosystem dynamics and biogeochemical cycling in the sea The models are based on measurements: The measurements are not perfect The models are not perfect Capabilities and limitations of models should always be considered when they are applied Effects of underlying assumptions Comparison with real measurements when available Know 81 your model!