CAPITAL BELTWAY STUDY
|
|
|
- Marion Flowers
- 5 years ago
- Views:
Transcription

1 CAPITAL BELTWAY VIR G INI A CAPITAL BELTWAY STUDY Final ENVIRONMENTAL IMPACT STATEMENT SECTION 4(f) EVALUATION DEPARTMENT OF TRANSPORTATION COMMONWEALTH OF VIRGINIA FEDERAL HIGHWAY ADMINISTRATION U.S. DEPARTMENT OF TRANSPORTATION APRIL 2006
2 FHWA-VA-EIS F State Project Numbers: F29, PE101; F30, PE101; F31. PE101 Federal Project Numbers: IM-495-5(079). IM-495-5(080),IM-495-5(082) By: U.S. Department of Transportation Federal Highway Administration and Virginia Department of Transportation 1/fl IL /81 rjn 0 Date of Approval CAPITAL BELTWAY STUDY FAIRFAXCOUNTY, VIRGINIA From: 1-95/1-395/1-495 Interchange To: American Legion Bridge FINAL ENVIRONMENTAL IMPACT STATEMENT FINALSECTION 4(f) EVALUATION Submitted Pursuant To: 42 U.s.C. 4332(2) (c), 23 U.S.C. 128(a) 49 U.s.C. 303 (c).and 16 U.S.C. 470(f) The Capital Beltway Study final environmental impact statement has been prepared to determine the impact of the proposed improvements to the 14-mile section of the Capital Beltway (1-495) between the 1-95/1-395/1-495Interchange and the American Legion Bridge in Fairfax County, Virginia. The primary goals of the improvements are to provide safer and more efficient travel on the Beltway and to complete the regional HOV network. The following persons may be contacted for additional information concerning this document: EarlT. Robb Environmental Administrator Virginia Department of Transportation 1401 East Broad Street Richmond, Virginia Phone: (804) Edward S. Sundra Senior Environmental Specialist Federal Highway Administration 400 North 8th Street Richmond, Virginia Phone: (804) A Federal agency may publish a notice in the Federal Register, pursuant to 23 use 139(1), indicating that one or more Federal agencies have taken final action on permits, licenses, or approvals for a transportation project. If such notice is published, claims seeking judicial review of those Federal agency actions will be barred unless such claims are filed within 180 days after the date of publication of the notice, or within such shorter time period as is specified in the Federal laws pursuant to which judicial review of the Federal agency action is allowed. If no notice is published, then the periods of time that otherwise are provided by the Federal laws goveming such claims will apply.
3 S SUMMARY S.1 PROJECT DESCRIPTION AND LOCATION The Federal Highway Administration (FHWA), in conjunction with the Virginia Department of Transportation (VDOT), proposes to improve the Capital Beltway (I-495) in Fairfax County, Virginia, between the I-95/I-395/I-495 interchange and the American Legion Bridge. The project is located in Northern Virginia, as shown in Figure S-1. Improvements are needed to increase the Beltway s capacity to accommodate expected growth in daily traffic volumes and remedy current congestion, operational, and safety problems on this critical link in the region s transportation system. S.1.1 Background Constructed as part of the interstate highway system, the Beltway was originally designed to serve through traffic bypassing Washington, D.C. However, since its completion in 1964, the growth of the Washington, D.C. metropolitan area and changes in travel patterns have made the Beltway an integral part of the regional transportation system. Instead of functioning as a bypass, the Beltway is now used primarily for travel to and from destinations within the region. Each day hundreds of thousands of local residents use the Beltway to get to work, shop, and travel throughout the metropolitan area. S.1.2 Project Termini The proposed improvements to the Beltway and its interchanges would extend for about 14 miles from Backlick Road to the American Legion Bridge over the Potomac River. The FHWA has determined that these termini are logical and that improving this portion of the Beltway has independent utility. The project also would include improvements to portions of 10 roadways that intersect and connect to the Beltway via existing interchanges at Braddock Road, Little River Turnpike, Gallows Road, Arlington Boulevard, Interstate 66, Leesburg Pike, Chain Bridge Road, Dulles Access/Toll Road, Georgetown Pike, and the George Washington Memorial Parkway. Modifications to these roadways would be necessary to properly integrate the proposed Beltway and interchange improvements with existing (or planned) roadway designs and traffic patterns. Improvements to the remainder of the Beltway in Virginia and to the Maryland Beltway are not included as part of this project. S-1


4 Capital Beltway Study Summary End Project VIRGINIA Begin Project Approximate Scale (Miles) PROJECT LOCATION BLTWY073 Figure S-1 CAPITAL BELTWAY STUDY S-2
5 Summary Capital Beltway Study S.2 PURPOSE AND NEED FOR ACTION The Beltway provides connections to other major roadways within the Washington, D.C. region and carries more traffic than any other road in Virginia. Although there have been incremental improvements to correct specific safety and operational problems during its 42 years of operation, the last major improvements to the Beltway were completed in 1977, when it was widened from four to eight lanes. Because of its role as a key link in the region s transportation system, major improvements to the Beltway have been recommended in local, regional, and state transportation plans for almost a decade. Factors contributing to the need for Beltway improvements are listed in Table S-1. Table S-1 PURPOSE AND NEED FOR BELTWAY IMPROVEMENTS Purpose of the Beltway Improvements 1. Provide safer and more efficient travel on the Beltway. 2. Correct substandard roadway and interchange design. 3. Ease Beltway congestion and reduce cutthrough traffic on local roadways and neighborhood streets. 4. Complete the regional HOV roadway network and enhance connections with other regional roadways. 5. Expand availability of mass transit options and improve access to other transportation modes. 6. Accommodate growing travel demand and changes in regional trip characteristics. Why Improvements Are Needed Accidents on the Beltway are increasing. Congestion and the current roadway design are the cause of many accidents. Beltway travel speeds are decreasing. Travel times and the length of back-ups on the Beltway are increasing. Beltway and interchanges were not designed to handle current traffic volumes. Many interchanges and portions of Beltway do not meet current engineering and safety standards. Expansion of the regional roadway network has not kept pace with population and employment growth. Major capacity improvements to the Beltway have not been made in almost 25 years. Beltway congestion spills over to adjacent roadways. Congestion levels will worsen in the future. Beltway serves both local and through traffic. Regional HOV system is incomplete; Beltway link between existing HOV facilities is missing. Beltway is important to regional freight movement. Transit on the Beltway would increase its capacity and enhance mobility. Existing Beltway does not support effective express bus operations. Beltway provides access to other transportation modes and facilities. Changing demographics and employment patterns are increasing the number of trips made each day. Suburb-to-suburb trips are on the rise. Combined trips (with intermediate stops) are increasing. Most trips in the region are made by automobile. S-3
6 Capital Beltway Study Summary Table S-1 PURPOSE AND NEED FOR BELTWAY IMPROVEMENTS Purpose of the Beltway Improvements 7. Better serve the diverse mix of land uses and improve access to regional activity centers in Fairfax County. 8. Preserve key link in transportation system that sustains regional economy. 9. Meet the transportation needs of a growing population. 10. Upgrade the region s transportation infrastructure in accordance with local and regional plans. Why Improvements Are Needed Fairfax County has urbanized rapidly since New development is occurring primarily in suburban areas. Non-residential land uses are increasing. Density of suburban activity centers is increasing. Additional development is already approved to take place as provided for in Fairfax County s land use plan. Fairfax County is major employment center. Most new jobs and businesses are being created in the suburbs. Work force changes are increasing travel demand. Congestion has economic costs. Regional employment to grow substantially over the next 20 years. Population of Northern Virginia has increased 50 percent since Center of region s population has shifted to Fairfax County. Population will grow another 40 percent by Number of households is growing even faster than the population. Improvements to the Beltway have been recommended for more than a decade by local governments, regional planning agencies, and state transportation officials. S.3 ALTERNATIVES A wide range of improvement alternatives was considered throughout the course of this study. The alternatives were identified and evaluated through an iterative screening process in cooperation with citizens, local and regional planning agencies, and a technical study team. Except for the No-Build Alternative, alternatives deemed not reasonably capable of meeting the identified needs were eliminated from further consideration. While required by National Environmental Policy Act regulations, the No-Build Alternative was also studied in detail because it illuminates the need for improvements and serves as a baseline for comparing the other alternatives. Alternatives that were deemed too disruptive in comparison to the transportation benefits they would provide were also eliminated from further consideration. Thus, the range of alternatives considered in detail in the Draft EIS included the No-Build (or no-action) Alternative and three Candidate Build Alternatives for expanding and reconfiguring the total number of lanes on the Beltway: the Concurrent HOV Alternative (10 through lanes), the Express/Local with HOV Alternative (10 through lanes), and the Barrier-Separated HOV Alternative (12 through lanes). Multiple options for interchange configurations along the length of the mainline alternatives were also examined. S-4
7 Summary Capital Beltway Study Based on the comments received from the general public and local government about the Draft EIS, the three Candidate Build Alternatives, as well as the various interchange options, were substantially revised to reduce their costs and impacts. The required right-of-way for mainline improvements was reduced by minimizing shoulders and utilizing painted buffer strips where barrier medians had been proposed before. The footprints of proposed interchange improvements were reduced as much as feasibly possible without undermining the effectiveness of those improvements. Finally, each of the three revised Candidate Build Alternatives was re-evaluated, both on its own and with High Occupancy Toll (HOT) lane operations, resulting in a six new alternatives. These six alternatives were narrowed to the two most promising, and the Preferred Alternative was selected from these. S.3.1 Alternatives Development The Major Investment Study (MIS) findings were summarized in the January 1997 MIS Results Report: The Framework for Beltway Improvements (see Executive Summary in Appendix A). The report described the identification and evaluation of a number of approaches, or strategies, for achieving four primary goals with respect to the Capital Beltway. Reasonable alternatives for further study were identified by translating the general MIS strategies into specific physical improvements, entailing a complex interplay among engineering, traffic, and environmental considerations, while also keeping in mind the identified transportation needs in the Beltway corridor. First, better management of the overall Beltway was explored. Second, it was necessary to establish the amount of additional capacity needed to fully accommodate projected traffic volumes, and the amount that could reasonably be added before the level of community disruption would become unacceptable. Third, existing design features would need to be updated in accordance with current design standards. Fourth, direct access to the Beltway had to be provided for HOV traffic. Table S-2 summarizes the factors considered in developing the three-part improvement concepts consisting of mainline roadway, interchanges, and direct HOV access. Table S-2 FACTORS CONSIDERED IN THE DEVELOPMENT OF ALTERNATIVES Roadway Configurations Interchange Improvements Direct HOV Access Type of Lanes and Lane Configuration (Layout) Total Number of Lanes Traffic Operations and Safety Environmental and Community Concerns Travel Patterns and Interchange Capacity Connections with Intersecting Roadways Compatibility with Roadway Modifications Safety Enhancements Environmental and Community Concerns Interchange Locations for Direct HOV Ramps HOV/Express Bus to General Purpose Lane Connections Express to Local Lane Connections Environmental and Community Concerns Roadway Configurations. Four different roadway configurations were found to meet the design criteria: Concurrent HOV, Express/Local with HOV, Express/Local, and Barrier- Separated HOV, Fourteen variations of mainline alternatives with different lane S-5
8 Capital Beltway Study Summary configurations were developed from these four mainline options, as listed in Table S-3. Through a multi-level screening process, the mainline concepts were reduced in iterative steps to a manageable and representative number that was evaluated in the Draft EIS. Eliminated were those concepts that were clearly inferior to similar alternatives based on operations, cost of construction, and impact to the surrounding environment. Table S-3 MAINLINE IMPROVEMENT CONCEPTS Mainline Improvement Concepts Considered in the Draft EIS Draft EIS Candidate Build Alternatives Revised Mainline Improvement Concepts Preferred Alternative Concept Number of Through Lanes Lane Config. Number of Through Lanes Lane Config. Number of Through Lanes Lane Config. Number of Through Lanes Lane Config. Concurrent HOV Revised 10-Lane HOV Barrier-Separated HOV Express/Local Express/Local with HOV High Occupancy Toll Lanes Interchange Options. The 14-mile segment of the Beltway between Springfield and the American Legion Bridge provides connections to a major interstate highway (I-66), limited access highways (Dulles Access/Toll Road and George Washington Memorial Parkway), and local primary roads via ten interchanges. Modifications to these interchanges and intersecting roadways would be needed to accommodate and enhance the proposed Beltway improvements. For each interchange, existing conditions were analyzed and various ways to improve traffic operations and safety were developed. A range of improvements was considered, as shown in Table S-4. The same multi-level screening process that was applied to the mainline concepts was also used to select the most viable interchange concepts. S-6
9 Summary Capital Beltway Study Table S-4 INTERCHANGE IMPROVEMENT CONCEPTS Interchange Interchange Concepts Considered in the Draft EIS A Cloverleaf with Center HOV B Cloverleaf with Center HOV C Cloverleaf with Reversible HOV Braddock Road D Cloverleaf with Directional HOV E Partial Cloverleaf with Center HOV Little River Turnpike Gallows Road Arlington Boulevard Interstate 66 A Partial Cloverleaf with Directional Ramps B Partial Cloverleaf C Single Point Diamond D Cloverleaf with Directional Ramps E Improved Cloverleaf F Partial Cloverleaf with Directional Ramps G Three-Level Urban Diamond A Improved Partial Diamond B Partial Clover/Partial Diamond C Full Diamond Interchange Concepts Considered for Inclusion in Preferred Alternative* E Partial Cloverleaf with Center HOV Revised E Partial Cloverleaf with Center HOV B Partial Cloverleaf ( Option 2 ) Revised D Cloverleaf with Directional Ramps ( Option 1 ) E Improved Cloverleaf Revised A Improved Partial Diamond with No Improvements to west bound Gallows Road Auxiliary Lane Revised A, Option 1 Improved Partial Diamond with Improvements at Woodburn Road ( Option 1 ) C Full Diamond Preferred Concept Revised E Partial Cloverleaf with Center HOV E Improved Cloverleaf Revised A Improved Partial Diamond with No Improvements to west bound Gallows Road Auxiliary Lane A Improved Full Cloverleaf A Improved Full Cloverleaf A Improved Full Cloverleaf A Directional with Full Movements** B Directional with Full Movements** C Directional with Partial SOV Movements D Directional with Partial SOV Movements E Directional with Full Movements F Directional with Full Movements G Directional with Full Movements A Directional with Full Movements** B Directional with Full Movements** C Directional with Partial SOV Movements E Directional with Full Movements Modifications to Existing Interchange Modifications to Existing Interchange S-7
10 Capital Beltway Study Summary Table S-4 INTERCHANGE IMPROVEMENT CONCEPTS Interchange Leesburg Pike Chain Bridge Road Dulles Access/Toll Road Georgetown Pike Interchange Concepts Considered in the Draft EIS A Directional B Directional C Directional D Directional E Partial Cloverleaf A Partial Cloverleaf B Partial Cloverleaf C Partial Cloverleaf D Partial Cloverleaf E Partial Cloverleaf F Partial Cloverleaf G Partial Cloverleaf H Mainline Shift A Directional B Directional C Directional D Directional E Directional A Diamond B Partial Cloverleaf Interchange Concepts Considered for Inclusion in Preferred Alternative* B Directional Modifications to Existing Full Cloverleaf Interchange C Partial Cloverleaf Revised C Partial Cloverleaf with Modified Loop Ramp in Southwest Quadrant Option 1 Partial Cloverleaf with Flyover Ramp and Modified Loop Ramp in Southwest Quadrant Option 2 Partial Cloverleaf with Flyover Ramp B Directional E Directional Modifications to Existing Interchange A Diamond Revised A Diamond GW Parkway A Trumpet None None Preferred Concept Modifications to Existing Full Cloverleaf Interchange Revised C Partial Cloverleaf with Modified Loop Ramp in Southwest Quadrant Modifications to Existing Interchange Revised A Diamond *Note: Includes all interchange options carried forward for detailed evaluation in the Draft EIS, as well as those developed after publication of the Draft EIS in an effort to minimize the impacts of the proposed improvements. Interchange options that are the same as those developed during initial screening are called by same name as in Table 2-3. If an alternative was referred to by a different name during preferred concept selection, that name is given in parentheses. **Concept A applies only to the Concurrent HOV [5-5] mainline; Concept B is identical in design and applies to all other mainline alternatives. Direct HOV Access. Direct access to the proposed HOV lanes via dedicated ramps was included in the improvement concepts for all interchanges that connect to existing (or planned) HOV roadways in the project area: Braddock Road, Interstate 66 and the Dulles Access/Toll Road. HOV access also was included in each of the improvement concepts for the Chain Bridge Road interchange to improve access to the Tysons Corner area. In addition, HOV access at the Lee Highway (Route 29) providing access to the Merrifield area was developed. It should be noted that Direct HOV access at locations with no facilities may also be beneficial by encouraging increased use of the HOV system and by allowing buses to access these locations more efficiently. Following the development and refinement of various improvement concepts, a three-level screening process was used to identify the best-performing concepts, which could then be evaluated in greater detail. Concepts remaining at the end of the screening process were combined into complete end-to-end improvement alternatives consisting of 1) a specific S-8
11 Summary Capital Beltway Study lane configuration (e.g., Concurrent HOV), 2) improvements for each interchange, and 3) new direct access points for HOV traffic. The development of alternatives for the proposed Beltway improvements was coordinated with federal, state, and local agencies, citizens, interest groups, civic organizations, and businesses. VDOT encouraged agency and public participation throughout the study process. Each level of the screening process concluded with a presentation of the preliminary concepts and/or alternatives to the Beltway Study Team. This multi-agency group provided comments and recommendations throughout the course of developing and evaluating alternatives. The results of the Study Team's efforts also were presented to the general public in the form of individual group meetings as well as two sets of public workshops. Refinement of Alternatives Based on Comments on the Draft EIS. After the publication of the Draft EIS, three public hearings were held in May 2002 to elicit comments from citizens, local agencies, and organizations on the Candidate Build Alternatives considered and their effects. Although each of the Candidate Build Alternatives studied in the Draft EIS satisfied the purpose and need for improvements, comments from the general public and local government suggested that the cost and environmental impacts associated with these alternatives were more than they were willing to bear. In response, each of the build alternatives was scaled back significantly to lessen both costs and impacts on the surrounding community. The most significant reduction in impacts was found in residential displacements. Whereas the original Candidate Build Alternatives would potentially displace between 206 and 294 residences, the scaled back alternatives are estimated to only displace 3 to 10 residences. Right-of-way requirements for each of the alternatives were reduced by minimizing shoulders and replacing physical barriers with painted strips, as well as reducing improvements to interchanges. For instance, the typical cross section for the original Barrier-Separated HOV alternative was 226 feet wide; shoulders and barrier modifications reduced the width to approximately 202 feet. However, the most notable reductions in right-of-way requirements involved minimizing improvements to interchanges. All of the interchange improvements evaluated in detail in the Draft EIS were revisited; most were revised to lessen impact on surrounding area, and a Preferred Concept for each interchange was selected. These preferred interchange concepts are detailed in Section In addition to the design modifications to the proposed mainline and interchange improvements, each of the three Candidate Build Alternatives was also evaluated for High Occupancy Toll lane operations. As a result, six modified alternatives were developed: the three original mainline concepts, with and without HOT lanes. Of the six alternatives initially considered, two were identified as the most promising and were evaluated further, including the Revised 10-Lane Concurrent HOV Alternative and the Revised 12-Lane HOT Managed Lanes Alternative. The two revised alternatives were presented at a series of public information meetings in June S.3.2 Alternatives Considered and Eliminated As a result of the alternatives refinement and screening, several of the improvement concepts initially considered were eliminated from further consideration: S-9
12 Capital Beltway Study Summary Conversion of Existing Beltway Lanes to HOV or HOT. The possibility of converting a general-purpose lane to either an HOV or HOT lane was considered in conjunction with a number of alternatives. However, based on the current and projected travel demand in the corridor, a reduction in the number of general-purpose lanes was not recommended. Some level of peak period congestion in the general purpose lanes is desirable in order to achieve effective utilization of the HOV or HOT lanes. However, too much congestion will increase an already high level of cut-through traffic in neighborhoods adjacent to the Capital Beltway. It is essential that when first opened that there be both a direct benefit to the users of the HOV or HOT lane and no deterioration in the LOS for the general-purpose lanes. When projects have opened with an increase in overall congestion, the conversion of general purpose lanes to special use lanes has not been well received in Virginia and elsewhere throughout the country (most recently in Minneapolis). A public backlash could easily undermine an otherwise successful project. With the Preferred Alternative, if the HOT lanes are well utilized and demand grows, the Beltway could be re-striped in the future to provide three general purpose lanes and three HOT lanes in each direction. Rail Transit. The MIS analyses included a circumferential rail system running the entire length of the Beltway. It was concluded that implementation of a rail transit system serving the Beltway corridor would not preclude the need for other improvements to the Beltway. Rail transit s impact on vehicular travel demand for specific roadways within the region is small, and a large proportion of Beltway trips, which are local and intra-regional trips, are not conducive to transit use. Nevertheless, additional rail transit in the region is desirable and will be advanced independently of the Beltway improvements. Express Bus Service. The MIS analyses also encompassed express bus services in the Beltway corridor. However, it was concluded that implementation of such services alone would not preclude the need for other improvements to the Beltway. Bus transit trips represent only about 2 percent of the total person trips in the region. Transit options were shown to have a limited effect in reducing Beltway traffic volumes. Nevertheless, the mobility improvements and HOV facilities that would be provided by the proposed project are expected to enhance opportunities for making bus transit more competitive. Transportation System Management. A capital-intensive Transportation System Management (TSM) alternative would involve actions designed to improve traffic operations and maximize the efficiency of the existing roadway network, such as optimizing traffic signal timing. Evaluation of traffic, operational, safety, and environmental factors showed that implementing the TSM alternative alone would not meet the project s purpose and need for several reasons, including the fact that daily vehicle trips and traffic volumes on the Beltway would be reduced by less than 1 percent. Beltway Mainline Configurations. Eleven of the original mainline alternatives shown in Table S-3 were eliminated because they would provide inferior levels of traffic service or because of other operational problems, design difficulties, cost, or environmental impacts. Non-HOV Roadway Concepts. All concepts that did not include HOV lanes were eliminated from further consideration because they did not address the purpose and need. S-10
13 Summary Capital Beltway Study Construction of Beltway improvements without HOV lanes would not be consistent with state, regional, and local land use and transportation plans and would provide 25 percent less person-capacity in this highly congested corridor. Single-Lane Barrier-Separated Roadway Concepts. Concepts that included only a single barrier-separated HOV lane in each direction were eliminated from further consideration. They would be the least flexible for future roadway modifications (i.e., change in lane usage) and for incident or accident management and would have high costs for modest improvements in capacity and operations. Likewise, the capacity of single lane concepts would be quickly used up. Roadway Concepts with Two Express Lanes. Concepts that included only two express lanes were eliminated from further consideration. These configurations were dropped because of operational and safety problems arising from having only one express lane in each direction for general use traffic (the other lane would be reserved for HOV traffic). Express/Local with HOV Roadway Concepts. The 10- and 12-lane express/local configurations on the Beltway were consolidated to create an optimized Express/Local with HOV alternative. It was determined that the 12-lane option provided some additional capacity in the local lanes, but did not perform substantially better than the 10-lane Express/Local with HOV alternative. Interchange Improvement Options. A total of 29 concepts, as shown in Table S-4, were eliminated at various stages of the alternatives development process for their traffic operations deficiencies, safety problems, and environmental impacts. S.3.3 No-Build Alternative The No-Build Alternative provides for no improvements to the Beltway except for periodic maintenance and minor enhancements needed to maintain operation of the roadway. However, other planned improvements to the regional roadway and transit network other than the section of Beltway under consideration here, as outlined in the 2000 update to The Long-Range Transportation Plan for the National Capital Region, were assumed to be in place by the design year (2020) for purposes of traffic forecasting. S.3.4 Preferred Alternative Based on input received at the Location Public Hearing, the Public Information Meetings held in June 2004, and additional analysis and agency input, the 12-Lane HOT Alternative was adopted by the Commonwealth Transportation Board (CTB) as the project s Preferred Alternative on January 20, This alternative would add two HOT lanes to the Capital Beltway in each direction and modify, improve and reconfigure the interchanges to increase capacity, reduce congestion, and improve safety. The 12-Lane HOT Alternative is similar in design to the 12-Lane Barrier Separated HOV Alternative evaluated in the Draft EIS. Under this alternative, the Beltway would have a total of 12 through lanes: four general-purpose lanes and two HOT lanes in each direction, i.e., a configuration. The two far left lanes would be designated as HOT lanes and separated from the general-purpose lanes with a 4-foot buffer strip. The HOT lanes would be used by high occupancy vehicles (HOV-3 + ; three or more occupants), buses, and tolled low occupancy vehicles with less than three occupants. S-11
14 Capital Beltway Study Summary The main advantage of this roadway type is the capacity it provides for both HOV and HOT traffic, thereby encouraging car-pooling and bus ridership by facilitating movement throughout the HOV/HOT roadway network. Accordingly, the HOT lanes would have direct access/egress to the existing and anticipated HOV facilities at four interchanges: Braddock Road, I-66, Route 123, and the Dulles Access/Toll Road, as well as direct HOT access to and from Lee Highway (Route 29). Collector-distributor (C-D) roadways would be barrier-separated from the mainline roadways at interchanges and also between closely spaced interchanges to minimize movement conflicts and to improve safety and traffic operations. Continuous C-D roadways would be provided in both directions between Gallows Road and Route 50 (there is also an existing C-D road at Route 7 and along the northern portion of the Dulles Access/Toll Road). Generally, connection to interchanges would be made via the C-D roadways; however, direct access/egress would also be provided from the main roadways at selected interchanges. The locations where direct access/egress would occur are southbound at Gallows Road, I-66 (both directions), Route 123 (both directions), and Georgetown Pike. Northbound traffic at Gallows Road would have direct access, but egress onto a C-D road. The Dulles Access/Toll Road would have direct access northbound but egress onto a C-D road, while southbound traffic at the Dulles Access/Toll Road would have direct egress, with access via a C-D road. Left exits and entrances for non-hov traffic, from the mainline and the C-D roadways, would be eliminated. The existing left exits and entrances would be retained to serve HOV/HOT traffic only. At the northern end of the project segment, the 12-lane roadway configuration would transition to match the roadway cross-section prior to the George Washington Memorial Parkway interchange. The required transition in the I-495 mainline cross section would begin after the Dulles Access/Toll Road. The improvements to the southbound I-495 roadways would also begin south of the George Washington Memorial Parkway. Similarly, at the southern end of the project segment, the I-495 mainline cross section would tie into the I-95/I-395/I-495 interchange improvements immediately north of the Beltway bridge crossing over the Norfolk Southern Railway. At this location, the Beltway cross section would consist of a 12-lane cross section. Most of the recommended improvements would be accommodated within the existing right-of-way. Additional right-of-way would be necessary because of the widening only at a few locations, but the total right-of-way taking would be reduced from up to 294 residential properties to three residential properties. The proposed improvements that would reduce traffic congestion and enhance traffic operation and safety are: Additional capacity by adding four lanes to the Beltway. Replacement of left exit and entrance ramps for general traffic with right exit and entrance ramps; this would eliminate multilane weaving and improve traffic safety and operation. Existing loop ramps that have radii smaller than the minimum design standard would be improved or replaced. Some minor design exceptions for loop ramps would be sought at locations where potential impacts to parks, residences and Metro s Orange Line could occur. S-12
15 Summary Capital Beltway Study Interchange configurations would be modified to reduce traffic congestion by eliminating the weaving movements at Braddock Road, Little River Turnpike (Alternative), and Chain Bridge Road interchanges. For instance, traffic weaving movements at the Chain Bridge Road interchange would be eliminated through the use of a flyover ramp southbound and the replacement of a loop ramp with left turn lanes for northbound traffic. Direct HOV/HOT access would also be provided at the Lee Highway (Route 29) crossing of the Beltway. This access would involve two center access ramps for HOV/HOT traffic only: one from the northbound I-495 HOT lanes to Lee Highway in either direction, and one from Lee Highway in either direction to the southbound I-495 HOT lanes. There would be no HOV/HOT access from southbound I-495 or to northbound I-495, nor any access for non-hov/hot traffic. A traffic signal would be required on Lee Highway at this location. The construction costs for the Preferred Alternative are estimated at $891 million (in Year 2002 dollars). Right-of-way costs are estimated to be $7.6 million. (Note: A supplemental estimate was prepared to forecast these same costs for the anticipated year of expenditure which represents the mid-point of construction. The escalated construction cost for the future year is $1.15 billion and the escalated right-of-way cost is $18.9 million.) S.4 ENVIRONMENTAL CONSEQUENCES The following briefly describes the principal environmental effects of the proposed project. Table S-5 is a matrix showing the comparative effects of the alternatives studied. The total impact numbers are given as ranges because of the multiple interchange options available at Gallows Road, Interstate 66, and the Dulles Access/Toll Road. S.4.1 Land Use Improvements to the Beltway are included in the Comprehensive Plan and are therefore part of the planned growth of Fairfax County. The Preferred Alternative would require the acquisition of approximately 10 acres of land adjacent to the Beltway and conversion of the existing uses to highway use. S.4.2 Socioeconomics The Preferred Alternative would result in a dramatic reduction in the number of residential relocations compared to the Candidate Build Alternatives studied in the Draft EIS. The Preferred Alternative was developed in part to address the concerns of the general public and local governments regarding the high number of relocations. No established communities will be bisected or their community cohesion significantly disrupted. The Preferred Alternative would not displace any non-profit organizations, schools, or churches. Impacts of the Preferred Alternative on community cohesion would include the taking of land and homes along the edges of neighborhoods. Access to or from adjacent neighborhoods would not be disrupted, except for possible temporary detours during construction. No non-motorist facilities such as pedestrian or bicycle paths will be lost. To S-13
16 Capital Beltway Study Summary the degree that improvements to the Capital Beltway attracts trips away from local roads, quality of life in communities will improve due to a decrease in cut-through traffic. Several populations under the aegis of the Presidential Executive Order on environmental justice (EJ) were identified in the project area. However, there is no evidence that such populations would be subjected to disproportionately high and adverse environmental effects compared to non-ej populations. Table S-5 COMPARATIVE SUMMARY OF PROJECT EFFECTS BY ALTERNATIVE Final EIS Alternatives Revised Alternative Candidate Build Alternatives Draft EIS No-Build Preferred 12-Lane HOT 10-Lane HOV Concurrent HOV (10 Lanes) Express/ Local with HOV (10 Lanes) Barrier- Separated HOV (12 Lanes) Noise Impacts (dwellings) 3,054 3,233 3,069 4,238 4,076 4,031 Dwellings Protected by Noise Barriers NA 2,943 2,902 3,900 3,616 3,875 Homes Displaced Businesses Displaced Community Facilities Displaced tennis courts 0 Carbon Monoxide (ppm) - 1 hr Range from 10 sites - 8 hr Public Parks Impacted Parkland Required (acres) Adverse Effects to Historic Resources Wetlands Displaced (acres) Impacted Length of Streams (feet) Floodplain Encroachments (acres) Potential Hazardous Material Sites Threatened and Endangered Species 0 4,452 4,235 8,262 8,031 8, Length of Alternative (miles) Right-of-Way Required (acres) Right-of-Way, Utilities, and Relocation Costs (millions) $0 $7.6 $2.9 $345 $423 $402 Construction Costs (millions) $0 $891 $783 $2,340 $2,830 $2,480 S-14
17 Summary Capital Beltway Study The Preferred Alternative will have positive impacts on highway and traffic safety. Although the project would generate tax losses to Fairfax County from the conversion of right-of-way, these losses would be offset to some degree by tax gains from added employment and materials sales during construction, and by time and shipment cost savings associated with improved mobility. S.4.3 Air Quality On a local, macro-level the estimated carbon monoxide concentrations following construction of the Preferred Alternative would be well below the National Ambient Air Quality Standards (NAAQS) for one-hour and eight-hour average concentrations. The Preferred Alternative has also been included in the region s current CLRP (FY 2005) and TIP (FY ) and found to conform by the Capital Region s Transportation Planning Board (TPB is the MPO for the Washington, D.C. Metropolitan Area). TPB s conformity determination was reviewed by the EPA in accordance with the procedures and criteria of the Transportation Conformity Rule. Based on their review, EPA determined that TPB s conformity determination meets the requirements of the Clean Air Act and the applicable regulations promulgated under 40 CFR Part 93. On February 21, 2006, FHWA and FTA jointly found the 2005 CLRP and FY TIP for the Washington, D.C. Metropolitan Area to be in Conformance with the Transportation Conformity Rule. S.4.4 Noise The number of residences exposed to noise impacts would be greater with the Preferred Alternative than with the No-Build Alternative. The majority of impacted residences would be exposed to design-year (2020) traffic noise levels that approach or exceed 67 dba Leq (equal or exceed 66 dba Leq) during the loudest hour of the day. In some cases, impacted residences would experience noise levels substantially greater (10 dba or more) than existing levels. A total of 3,054 dwelling units would be impacted with the future No-Build Alternative. A total of 3,233 dwelling units would be impacted with the Preferred Alternative. Most of the impacts, however, can be abated. Where feasible and reasonable, noise barriers will be constructed to mitigate noise impacts of the project. Based on preliminary analyses, it appears that barriers could reasonably be provided that would protect and benefit more than 4,000 residences (i.e., receive at least 5 decibels of noise reduction). This additional benefit would not occur under the No-Build Alternative. S.4.5 Visual Quality And Aesthetics The primary visual effect of the proposed improvements will result from clearing of existing vegetation buffers between the Beltway and neighborhoods along the roadway edge and the changes in size and elevation of interchange ramps and overpasses. Where sufficient right-of-way remains after construction, vegetation buffers would be reestablished by landscaping or by allowing indigenous species to regenerate naturally. Where noise barriers would be provided, adjacent neighborhoods will be afforded opportunities to provide input on the design and appearance of the barriers. The increased visibility of the interchanges would not be incompatible with the urbanized surroundings of the project. S-15
18 Capital Beltway Study Summary S.4.6 Parks and Recreation Areas The Preferred Alternative would require the use of small amounts of land from five parks and recreation areas. The Preferred Alternative also would have other incremental effects on Section 4(f) properties, such as changes in noise levels, and visual quality. These effects would not substantially impair the use of the affected resources. S.4.7 Cultural Resources A comprehensive historic property identification survey found two historic districts in the project s Area of Potential Effect: Holmes Run Acres and the W&OD Railroad. No major archaeological sites were identified. With the Preferred Alternative, the effects to Holmes Run Acres were eliminated. The W&OD Railroad Historic District is a 45-mile linear district that spans the Beltway on modern bridges. These bridges would be replaced as part of the Preferred Alternative. However, because the project would not alter the characteristics that qualify the district for inclusion on the National Register of Historic Places, there would be no effect on the district. S.4.8 Natural Resources Some natural resources adjacent to the Beltway would be displaced by implementation of the Preferred Alternative. The Preferred Alternative would result in approximately 4,452 feet of direct stream impacts from pipe and culvert installation. No substantial effects on water quality are expected. Although the increase in impervious surface, combined with increases in traffic volumes, would result in elevated stormwater runoff volumes and pollutant outputs, stormwater management measures should offset any deleterious effects. In addition, compensatory mitigation for unavoidable stream impacts will be provided as determined appropriate in consultation with the permitting agencies, the U.S. Army Corps of Engineers and the Virginia Department of Environmental Quality. Wetlands displacements would be 3.03 acres or about 14 percent of the total wetland area within the existing Beltway right-of-way. Compensatory mitigation for unavoidable wetland displacements will be provided as determined appropriate in consultation with the permitting agencies. There are four 100-year floodplains within the 14-mile project area that are spanned or abutted by the existing Capital Beltway. The Scotts Run floodplain would be further encroached upon with the Preferred Alternative. There are no federal or state listed threatened or endangered species in the project area. S.4.9 Hazardous Materials The locations of potential hazardous materials sites throughout the study area were identified early in the project process in an effort to avoid impacts. No hazardous materials sites would be affected by the Preferred Alternative. S.4.10 Indirect and Cumulative Effects There will be no induced, or secondary, effects caused by the project as a result of any access changes, because there is no direct access to adjacent properties from the Beltway. S-16
19 Summary Capital Beltway Study The mobility enhancements that the project would provide are expected to be only a marginal factor in future development decisions, because it is believed that development in the region will continue due to other factors, regardless of the Beltway improvements. It is unlikely that any resulting marginal increase in development will have any negative effect on communities, which are generally fully built out already. Therefore, secondary effects from the project are anticipated to be minimal. Quantifying cumulative impacts depends on the availability of data for each of the projects and resources that have occurred or are likely to occur within the cumulative effects study boundaries. In some cases this data is not available due to the timing of this and other studies, as is the case with the Capital Beltway Rail study. In other cases, impacts are evaluated only qualitatively, making only qualitative assessments of cumulative impacts possible. The proposed improvements to the Capital Beltway will affect resources, particularly water resources, that have been impacted by prior public and private projects and will likely be impacted in the future. On the other hand, this project and others in the region will have a net benefit on regional air quality due to reductions in congestion. S.5 OTHER REGIONAL TRANSPORTATION IMPROVEMENTS A number of other transportation improvements throughout the region are currently in the planning stages, in final design, or under construction. These projects, described below, provide compatible improvements or deal with deficiencies and capacity issues in other critical regional transportation corridors that connect with the Beltway. S.5.1 I-95/I-395/I-495 Interchange Improvements Construction of improvements to the I-95/I-395/I-495 interchange began in early The planned improvements will provide partial separation of traffic with different destinations (i.e., local and through traffic) and full HOV connections (including provisions for connections to future HOV lanes on the Beltway). This project also includes improvements to the Beltway from Backlick Road on the west to Van Dorn Street (Route 644) on the east. Except for the HOV connections, construction is expected to be completed by S.5.2 Dulles Corridor Transit Improvements The Virginia Department of Rail and Public Transportation (DRPT), in cooperation with the Washington Metropolitan Area Transit Authority (WMATA), Fairfax and Loudoun counties, and the Metropolitan Washington Airports Authority (MWAA), is planning to construct a 23.1-mile transit system in Fairfax and Loudoun counties, Virginia. A (Final EIS) for the project was completed in December A record of decision was signed by the Federal Transit Administration in March The Project will extend the existing Metrorail system from the Orange Line (between the East and West Falls Church stations) in Fairfax County through Tysons Corner to Washington Dulles International Airport and beyond the airport to Route 772 in Loudoun County. Most of the extension will be constructed in the median of the Dulles International Airport Access Highway and Dulles Connector Road, but the alignment would also directly serve Tysons Corner and Dulles Airport. The extension will include 11 new Metrorail stations, a new rail yard on Dulles Airport property, and improvements to an existing rail yard at West Falls S-17
20 Capital Beltway Study Summary Church. This alignment was selected because it offers the highest ridership potential with the fewest impacts on residential areas and the natural environment. Because of federal funding limitations and the timing of local funding availability, DRPT intends to construct the LPA in two major phases. Phase 1 of the Project will complete the first 11.6 miles of the planned extension and include five new stations (Tysons East, Tysons Central 123, Tysons Central 7, Tysons West, and Wiehle Avenue). Metrorail service to Wiehle Avenue is scheduled to begin in DRPT began Preliminary Engineering on Phase 1 of the Project in October Phase 2 of the Project will complete the remainder of the LPA from Wiehle Avenue to Route 772 in Loudoun County. S.5.3 Beltway Improvements in Maryland The Maryland State Highway Administration also is studying ways to enhance mobility in the Maryland portion of Beltway corridor. The Capital Beltway Transportation Corridor Study (a combined MIS and EIS) is being conducted to determine the most appropriate transportation improvements for the Maryland portion of the Beltway. Potential improvement options include the addition of HOV or express toll lanes to the Beltway, new transit alignments, and transportation system management/transportation demand management (TSM/TDM) strategies. Representatives from VDOT and MSHA continue to maintain close coordination to ensure compatible studies and designs. MSHA is currently in the alternatives analysis phase and a Draft EIS is being prepared. S.6 AREAS OF CONTROVERSY AND SIGNIFICANT UNRESOLVED ISSUES No known areas of controversy regarding the level of investigations or the methods of analysis employed in this Final EIS have been raised by any agency with which this work has been coordinated. S.7 ONLY PRACTICABLE ALTERNATIVE FINDING In accordance with Executive Orders and 11990, this portion of the Final EIS documents the basis for the finding that the Preferred Alternative as described herein is the only practicable alternative. S.7.1 Wetland Finding Each of the Candidate Build Alternatives contained in the Draft EIS as well as the Revised Candidate Build Alternatives presented in the Final EIS encroach upon wetlands within the corridor. Initial improvements involved up to 27 acres of wetland encroachments. Significant reductions were made through design modifications to reduce these potential impacts 4.6 to 5.1 acres for the Draft EIS Candidate Build Alternatives. Further reductions in the mainline and interchange areas for the two revised alternatives resulted in yet further reduction of impacts to these protected resources. The Preferred Alternative results in the least impact of all alternatives considered (3.03 acres). Additional avoidance and minimization efforts will be considered in the final design phase and coordinated with the US Army Corps of Engineers. S-18
21 Summary Capital Beltway Study Based on the above considerations, it is determined that there are no practicable alternative to the proposed construction in wetlands and that the proposed action includes all practicable measures to minimize harm to wetlands which may result from such use. S.7.2 Floodplain Finding There are four 100-year floodplains located within the 14-mile project corridor that are spanned or abutted by the existing Capital Beltway. Each of the Candidate Build Alternatives would impact one or more of these floodplains. Preliminary project designs sought to minimize and avoid impacts to floodplains by including floodplains as evaluation criteria in early alternatives development process. The Candidate Build Alternatives contained in the Draft EIS were estimated to impact 15 to 15.5 acres of wetlands -- primarily due to longitudinal encroachments. Reductions in the mainline and interchange areas for the Revised Candidate Build Alternatives resulted in associated reductions in floodplain encroachments for the Revised Alternatives acres for the Preferred Alternative and 8.8 acres for the Revised 10-Lane HOV Alternative. These impacts are limited to the Scotts Run floodplain which runs adjacent to the eastern edge of the Beltway for over a mile. Most of the longitudinal encroachments are attributed to fill outside the actual pavement area and cannot be avoided by bridging. Although the Revised 10-Lane HOV Alternative encroaches upon 1.6 fewer acres of floodplain, it does not meet the purpose and need of the project comparable to the Preferred Alternative. During the final design phase of the Preferred Alternative, a detailed Location Hydraulic Study will be performed in accordance with 23 CFR 650. The study will determine if the 100-year base flood elevations will increase due to the construction of the new facility within the impacted floodplain. The detailed hydraulic analysis will demonstrate that adequate measures will have been taken to ensure that any floodplain encroachment will not increase the risk of flooding to adjacent properties and comply with all federal, state, and local floodplain regulations (44 CFR Floodplain Management Criteria for Flood Prone Areas, and Part Revision of Flood Insurance Rate Maps to Reflect Base Flood Elevations Caused by Proposed Encroachments). In accordance with Executive Order and 23 CRF 650 Subpart A, it has been determined that based on the above considerations, there is no practicable alternative to the proposed construction in the floodplain, and the proposed action will include all practicable measures to minimize harm to the floodplain which may result from such use. S.8 OTHER FEDERAL ACTIONS AND PERMITS REQUIRED Federal and state laws require various environmental permits before construction can proceed. They include: Authorizations from the U.S. Army Corps of Engineers pursuant to Section 404 of the Clean Water Act for discharges of fill material into waters of the United States, including wetlands. S-19
22 Capital Beltway Study Summary Authorizations from the Virginia Department of Environmental Quality pursuant to Sections 401 (Virginia Water Protection Permit) and 402 of the Clean Water Act for discharges into waters of the United States. Authorizations from the Virginia Marine Resources Commission pursuant to Virginia Water Law for encroachments on subaqueous state-owned stream bottoms. Coordination with the National Park Service will be necessary to identify and acquire suitable replacement lands for the use of any lands in the W&OD Regional Park that were acquired with Land and Water Conservation Funds. S.9 REEVALUATION Due to the extensive amount of coordination conducted with local government and the general public and the consideration of the High Occupancy Toll (HOT) lane concept, the Final EIS was not completed within three years of the Draft EIS approval date (March 15, 2002). Therefore in accordance with 23 CFR , a reevaluation was conducted to determine whether there had been changes in the project or its surroundings or new information which would require a supplement to the Draft EIS or a new Draft EIS. The reevaluation reviewed the scaled-back versions of the Candidate Build Alternatives; evaluated the operational issues of HOT lanes; identified one newly acquired park parcel; and determined that no major regulatory changes had occurred since the publication of the Draft EIS. Based on the findings of the reevaluation, VDOT concluded and FHWA concurred that the findings of the Draft EIS were valid and that a Supplemental Draft EIS was not required. A copy of the Reevaluation Report is included as Appendix C of this Final EIS. S-20
23 TABLE OF CONTENTS SUMMARY... S-1 LIST OF ACRONYMS... xi GLOSSARY OF COMMONLY USED TERMS... xiii CHAPTER 1 PURPOSE AND NEED PROJECT DESCRIPTION AND LOCATION Project Setting Project Limits Project Status PURPOSE AND NEED FOR ACTION Operational Characteristics Safety and Operational Concerns Roadway Design Capacity Constraints System Linkage Intermodal Relationships Increased Travel Demand and Changing Trip Patterns Land Use Changes Regional Population Growth Economy and Employment Local Plans and Policies CHAPTER 2 ALTERNATIVES ALTERNATIVES DEVELOPMENT PROCESS Refinement of Strategies from Major Investment Study Identification of Reasonable Alternatives for Further Study in the Draft EIS Refinement of Alternatives Based on Comments on the Draft EIS PREFERRED ALTERNATIVE Lane HOT/Managed Lanes Alternative Interchange Improvements i
24 Capital Beltway Study Table of Contents HOV/HOT Direct Access Points Design Exceptions Construction Costs NO-BUILD ALTERNATIVE OPERATIONAL ANALYSIS Travel Demand and Capacity Operational Analysis Operational Performance - Mainline of the Beltway HOV/HOT Network Safety and Roadway Design ALTERNATIVES CONSIDERED AND ELIMINATED Revised Candidate Build Alternatives Draft EIS Candidate Build Alternatives Other Alternatives Considered and Eliminated CHAPTER 3 AFFECTED ENVIRONMENT ISSUES IDENTIFICATION LAND USE Current Land Use Land Use Plans and Future Land Use Activity Centers Utilities Beltway Right-of-Way SOCIOECONOMICS Population Characteristics Housing Characteristics Environmental Justice Populations Neighborhoods and Community Characteristics Community Facilities and Services Economic Setting and Employment Tax Base PARKS AND RECREATION AREAS County Parks Regional Parks State Parks National Parks School Recreational Facilities ii
25 Glossary Capital Beltway Study Final Environmental Impact Study Recreational Trails Other Recreational Resources HAZARDOUS MATERIALS AIR QUALITY Criteria Pollutants Regional Attainment and Conformity Status Air Toxics NOISE Noise Terminology and Criteria Existing Noise Conditions VISUAL AND AESTHETIC CONDITIONS NATURAL ENVIRONMENT Geology, Soils, and Groundwater Surface Waters Wetlands Floodplains Special Jurisdictions Wildlife and Habitats Threatened and Endangered Species CULTURAL RESOURCES Archaeological Resources Architectural Resources CHAPTER 4 ENVIRONMENTAL CONSEQUENCES INTRODUCTION LAND USE Direct Land Use Conversions Consistency with Plans and Policies Planned and Unplanned Growth Potential for Induced Development Potential for Joint Development SOCIOECONOMICS Relocations Changes to Neighborhoods and Community Cohesion Changes in Travel Patterns and Accessibility iii
26 Capital Beltway Study Table of Contents Effects on Community Facilities Effects on Social Groups and Environmental Justice Effects on Public Safety Economics PARKS AND RECREATION AREAS HAZARDOUS MATERIALS AIR QUALITY Conformity Determination Mobile Source Emissions Analysis Air Toxics NOISE Methodology Computed Existing and Future Noise Levels Impact Assessment Noise Abatement VISUAL QUALITY AND AESTHETICS GEOLOGY, SOILS AND GROUNDWATER SURFACE WATERS AND WETLANDS Surface Waters Wetlands FLOODPLAINS WILDLIFE AND HABITATS Aquatic Habitats Terrestrial Habitats Invasive Species THREATENED AND ENDANGERED SPECIES CULTURAL RESOURCES Holmes Run Acres Historic District W&OD Railroad Historic District CONSTRUCTION IMPACTS Land Use and Access Wildlife and Habitat Water Quality and Wetlands iv
27 Glossary Capital Beltway Study Final Environmental Impact Study Air Quality Noise SECONDARY AND CUMULATIVE EFFECTS Methodology for Secondary and Cumulative Effect Analysis Resource Identification Secondary Development Effects Cumulative Effects RELATIONSHIP BETWEEN LOCAL SHORT-TERM USES OF THE ENVIRONMENT AND THE MAINTENANCE AND ENHANCEMENT OF LONG-TERM PRODUCTIVITY IRREVERSIBLE AND IRRETRIEVABLE COMMITMENT OF RESOURCES CHAPTER 5 LIST OF PREPARERS CHAPTER 6 DISTRIBUTION LIST FEDERAL AGENCIES COMMONWEALTH OF VIRGINIA AGENCIES AND OFFICIALS REGIONAL AGENCIES AND ORGANIZATIONS FAIRFAX COUNTY AGENCIES AND OFFICIALS OTHER LOCAL GOVERNMENTS CHAPTER 7 COMMENTS AND COORDINATION AGENCY COORDINATION Early Agency Coordination Study Team Interagency Coordination Meetings Other Agency Meetings Scoping for Environmental Impact Statement Comments on the Draft EIS PUBLIC INVOLVEMENT Outreach Program Meetings with Interest Groups, Homeowners Associations, Community Organizations, and Property Owners Citizen Workshops v
28 Capital Beltway Study Table of Contents Fairfax County Beltway Task Force Public Meetings Location Public Hearing June 2004 Public Workshops CHAPTER 8 SECTION 4(f) EVALUATION INTRODUCTION PURPOSE AND NEED FOR THE PROPOSED ACTION SECTION 4(f) PROPERTIES Wakefield Park Fitzhugh Park Accotink Stream Valley Park Jefferson District Park W&OD Railroad Regional Park IMPACTS TO SECTION 4 (f) PROPERTIES Wakefield Park Fitzhugh Park Accotink Stream Valley Park Jefferson District Park W&OD Railroad Regional Park AVOIDANCE ALTERNATIVES AND MEASURES TO MINIMIZE HARM Wakefield Park Fitzhugh Park Accotink Stream Valley Park Jefferson District Park W&OD Railroad Regional Park COORDINATION CONCULSION REFERENCES INDEX APPENDICES Appendix A Agency Comment Letters and Responses Appendix B Public Comments and Responses Appendix C Reevaluation Appendix D Design Exceptions Appendix E Qualitative Hotspot Analyses for PM2.5 and Project-Level Conformity vi
29 Glossary Capital Beltway Study Final Environmental Impact Study FIGURES S-1 Project Location... S Project Setting Project Termini Users of The Capital Beltway Travel Speeds Bus and Rail Transit Average Daily Traffic on Beltway Typical Sections Preferred Alternative Cut-Through Traffic Ramp-to-Ramp Travel Patterns Hours of Congestion Travel Congestion Travel Speeds AM/PM Peak Hours Lane Changing HOV/HOT Lane Utilization Existing Land Use Future Land Use in Fairfax County Fairfax County Planning Areas and Districts Utilities Census Tracts Neighborhood and Community Areas Community Facilities Parks and Public Recreation Areas Air Quality Monitoring Stations Noise Measurement Locations Locations of Existing Noise Barriers Visual Setting Water Resources Air Quality Analysis Receptor Sites Noise Measurement and Prediction Sites Locations of Potential Noise Barrier Areas Section 4(f) Properties Wakefield Park Fitzhugh Park Accotink Stream Valley Park Jefferson District Park W&OD Railroad Regional Park vii
30 Capital Beltway Study Table of Contents TABLES S-1 Purpose and Need for Beltway Improvements... S-3 S-2 Factors Considered in the Development of Alternatives... S-5 S-3 Mainline Improvement Concepts... S-6 S-4 Interchange Improvement Concepts... S-7 S-5 Comparative Summary of Project Effects by Alternative... S Improvement Limits of Roadways Connecting with the Beltway and 2020 Daily Traffic Volumes by Beltway Segment Factors Considered in the Development of Alternatives Mainline Improvement Concepts in the Draft EIS Interchange Improvement Concepts in the Draft EIS Criteria Used in Screening Alternatives in the Draft EIS Revised Mainline Improvement Concepts Interchange Concepts Preferred Alternative Range of Daily and Hourly Demand Volumes Estimated Travel Time and Delay Operating Performance Environmental Issues Current and Future Land Use Distribution by Planning District Development Potential by Planning District Existing Beltway Right-of-Way Current and Future Population Population Characteristics (2000) Housing Characteristics (2000) Census Block Groups That Meet Environmental Justice Race Thresholds Parklands and Public Recreation Areas Existing Recreational Trails Near the Capital Beltway Existing Ambient Air Quality EPA s List of Mobile Source Air Toxics DEQ Toxics Monitoring Data from Northern Virginia Site FHWA Noise Abatement Criteria Measured Short-Term Noise Levels Virginia Water Quality Standards for Class III Non-Tidal Waters Summary of Wetlands Within 165 Feet (50 Meters) of the Beltway Invasive Plant Species Observed or with Potential to Occur within the Project Area Summary of Land Use Related Effects Summary of Socioeconomic Effects Estimated Construction Employment Summary of Effects to Parks and Recreation Areas Impacts to Potential Hazardous Material Sites Projected Carbon Monoxide Concentrations Computed Existing and Future Noise Levels Total and Net Residential Noise Impacts by Alternative Breakdown of Net Residential Noise Impact for the Preferred Alternative viii
31 Glossary Capital Beltway Study Final Environmental Impact Study 4-10 Parks and Recreation Areas: Average Distance at which Project Noise Levels Approach or Exceed FHWA NAC and Impact Summary Summary of Evaluated Noise Barriers by Alternative Descriptions of Noise Barriers Evaluated for the Preferred Alternative Summary of Impacts to Surface Waters and Wetlands Stream Impacts by Watershed Summary of Wetland Impacts by Type Summary of Wetland Impacts by Watershed Wetland Functions and Values by Area and Percent Impacted Wetland Impact Reductions During Alternatives Development Summary of Impacts and Compensation Requirements for Wetlands Floodplain Encroachments Summary of Effects to Cultural Resources Other Reasonably Foreseeable Projects Included in the Cumulative Effects Analysis Summary of Cumulative Effects Agencies and Officials Contacted During Early Agency Coordination Purpose and Need for Beltway Improvements Section 4(f) Properties Summary of Impacts to Section 4(f) Properties ix
32 Capital Beltway Study Table of Contents x
33 LIST OF ACRONYMS AASHTO APE BMP dba CBPA CEQ CFR COE CO CLRP CRMP CTB DCR DEIS DEQ DRPT EIS EPA EJ FCHD FCWA FEIS FEMA FHWA FIRM FORVA FWS HCM HOT HOV IACM LOS LOV MIS MPH MPO MSL American Association of State Highway Transportation Officials Area of Potential Effect Best Management Practice Decibels on the A-weighted scale Chesapeake Bay Protection Act President s Council on Environmental Quality Code of Federal Regulations U.S. Army Corps of Engineers carbon monoxide Constrained Long Range Transportation Plan Virginia Coastal Resources Management Program Commonwealth Transportation Board Virginia Department of Conservation and Recreation Draft Environmental Impact Statement Virginia Department of Environmental Quality Virginia Department of Rail and Public Transportation Environmental Impact Statement U.S. Environmental Protection Agency Environmental Justice Fairfax County Health Department Fairfax County Water Authority Federal Emergency Management Agency Federal Highway Administration Flood Insurance Rate Maps Friends of Rivers of Virginia U.S. Fish and Wildlife Service Highway Capacity Manual High Occupancy Toll High Occupancy Vehicle Interagency Coordination Meeting Level of Service Low Occupancy Vehicle Major Investment Study miles per hour Metropolitan Planning Organization mean sea level xi
34 Capital Beltway Study List of Acronyms MWCOG Metropolitan Washington Council of Governments MSAT Mobile Source Air Toxics NAAQS National Ambient Air Quality Standards NAC Noise Abatement Criteria NCPC National Capital Planning Commission NCRTPB National Capital Region Transportation Planning Board NEPA National Environmental Policy Act NHR Natural heritage resources NPDES National Pollution Discharge Elimination System NRCS National Resource Conservation Service NRHP National Register of Historic Places O3 ozone PEM Palustrine, Emergent (wetlands) PFO Palustrine, Forested (wetlands) PM2.5 Particulate Matter less than 2.5 microns in size ppm parts per million PSS Palustrine, Scrub-Shrub (wetlands) RPAs Resource Protection Areas RMAs Resource Management Areas SIP State Implementation Plan SHPO State Historic Preservation Officer TIP Transportation Improvement Program TNM FHWA Traffic Noise Model TNMLOOK FHWA-TNM lookup program TPB Transportation Planning Board TSM Transportation System Management USDOT U.S. Department of Transportation USDA U. S. Department of Agriculture USGS United States Geological Survey VDACS Virginia Department of Agriculture and Consumer Services VDEQ Virginia Department of Environmental Quality VDGIF Virginia Department of Game and Inland Fisheries VDHR Virginia Department of Historic Resources VDNH Virginia Department of Conservation and Recreation, Division of Natural Heritage VDOT Virginia Department of Transportation VDRPT Virginia Department of Rail and Public Transportation VMT Vehicle Miles Traveled WMATA Washington Metropolitan Area Transit Authority W&OD Washington & Old Dominion xii
35 GLOSSARY OF COMMONLY USED TERMS Alluvial Communities: Habitat of variable vegetation type that has developed in an area with a stream and a well-developed floodplain. The terms "alluvial" and "riparian" are synonymous, and imply overbank flooding events. Alternative: General term that refers to possible approaches to meeting the transportation deficiencies identified in the purpose and need statement. Attainment: A condition where a pollutant conforms to or shows levels at or below one or more of the National Ambient Air Quality Standards. Benthic: Located on the bottom of a body of water or in the bottom sediments, or pertaining to bottom-dwelling organisms. Best Management Practices (BMPs): Various methods of minimizing the impacts of change in land use on surface and groundwater systems. Biochemical Oxygen Demand (BOD): The quantity of oxygen used by a mixed population of microorganisms in the oxidation of organic matter. Biotic Integrity: Condition of the living things in the natural community. Bottleneck: A section of roadway where traffic flow is constricted, for example, at ramp merges/diverges, weaving areas, lane drops, and incidents. Capacity: The maximum rate of flow at which persons or vehicles can be reasonably expected to traverse a point or uniform segment of a lane or roadway during a specified time period under prevailing roadway, traffic, and control conditions. Expressed as vehicles per hour or persons per hour. The theoretical capacity of a single freeway lane is 2,200 vehicles per hour. Carbon Monoxide (CO): A colorless, odorless, poisonous gas that is formed as a product of the incomplete combustion of carbon and is emitted directly by automobiles and trucks. Community Cohesion: The connections between and within communities that are essential for serving the needs of the residents. Congestion: Traffic flow, which is influenced by the affects of a bottleneck. In this type of flow, speeds may range from 10 to 45 mph on the freeway, with periods of stop-and-go traffic and queuing. Congestion (Moderate): Average speeds between 20 and 45 mph. xiii
36 Capital Beltway Study Glossary of Terms Congestion (Severe): Average speeds below 20 mph. Criteria Pollutants: Pollutants for which National Ambient Air Quality Standards (NAAQS) have been adopted. All other air pollutants are considered non-criteria pollutants. Cumulative Effects: The incremental consequences of a proposed action in addition to other past and reasonably foreseeable future actions that affect the same resources. Other actions in the project area include other highway projects and residential, commercial, and institutional development. Delay: Additional travel time experienced by a person or vehicle beyond what would be reasonable for a given trip. Demand: The traffic volume expected to desire service past a point or segment of the highway system, or the traffic currently arriving or desiring service past such a point, usually expressed as vehicles per hour. Diurnal: The typical 24-hour travel pattern on a particular roadway, usually expressed ion vehicles per hour. Environmental Justice: Presidential Executive Order requires federal agencies to ensure that their actions (or actions they oversee) do not disproportionately discriminate against (impact) minority populations and low-income populations Eutrophication: The process by which lakes gradually age and become more productive. It normally takes thousands of years to progress. However, humans, through their various cultural activities, have greatly accelerated this process in many lakes. Cultural or anthropogenic "eutrophication" is water pollution caused by excessive plant nutrients. Fauna: Animals characteristic of a region, period, or special environment. Fish Taxa Richness: Total number of unique fish species. Floodplain: The portion of a river or stream valley, adjacent to the channel, that is covered with water when the river or stream overflows its banks at flood stage. Floodway: A large-capacity channel constructed to divert floodwaters safely through or around population areas. Free-flow: Traffic flow which is unaffected by upstream or downstream conditions. This flow is generally defined within a speed range of 45 to 65 mph at high flow rates. High Occupancy Vehicle Lanes (HOV): Designated travel lanes which require two or more occupants per vehicle. Future regional plans anticipate occupancy requirement to be three (HOV-3 + ). High Occupancy Toll Lanes (HOT): Designated travel lanes which are utilized by high occupancy vehicles, buses, and tolled vehicles carrying less than noted high occupancy levels. xiv
37 Glossary of Terms Capital Beltway Study Independent Utility: A project is said to have independent utility if it will provide functional improvements that can stand alone and serve a major purpose, even if no other improvements are made in the region. Indirect Effects: Impacts on the environment resulting from the primary impact of the proposed action but occurring later in time or farther removed in distance, although still reasonably foreseeable. Intermodal Relationships: Relationships between transportation modes. An example of a mode is bus mass transit. Invasive Species: A plant, animal, or other organism (1) that is non-native (or alien) to the ecosystem under consideration and (2) whose introduction causes or is likely to cause economic or environmental harm or harm to human health. Isolated Wetlands: Non-jurisdictional wetlands. Wetlands that are not subject to Clean Water Act regulation. Jurisdictional Determination: A written statement issued by the COE that identifies areas within a discrete project area that are subject to Clean Water Act regulation. Jurisdictional Wetlands: Wetlands that are subject to Clean Water Act regulation. Leq: The equivalent sound level, containing the same amount of sound energy as the varying sound level measured over a specified time period. Lane Balance: For smooth and efficient operation through an interchange, there should be a balance between the number of lanes on the highway and the ramps. Lane Configuration: Layout of lanes, including the number of lanes and type of traffic allowed to use each lane. Lane Continuity: Maintenance of a basic number of lanes on a roadway, which is essential for uniformity in service. Level of Service (LOS): Operating conditions within a stream of traffic describing safety, traffic interruptions, speed, freedom to maneuver, comfort and convenience. Six levels of service are defined, designated A through F, with A representing the best conditions and F the worst. Link: Traffic term referring to one portion of a longer trip in the transportation system. Logical Termini: Rational endpoints for consideration of transportation improvements and for review of environmental impacts. Low-Income Population: A low-income-household is one where the median household income is below the Department of Health and Human Services poverty guidelines. xv
38 Capital Beltway Study Glossary of Terms Major Investment Study (MIS): 23 CFR 450 required these studies for large-scale transportation improvements in urban areas. The studies were used to identify the most promising transportation improvements. The MIS concluded that highway improvements would be the most effective transportation investment in the Beltway corridor. Appendix A contains the Executive Summary of the MIS report. Measure of Effectiveness (MOE): Parameters describing the quality of service provided by a traffic facility, for example speed and delay. Minority Individuals: Members of the following population groups: American Indian or Alaskan Native, Asian or Pacific Islander, Black (not of Hispanic origin), and Hispanic. National Priority List (NPL): Also known as the United States Environmental Protection Agency's (EPA's) Superfund program. The National Priorities List is a comprehensive list of the sites/facilities that have been evaluated using the Hazard Ranking System and have been found to pose a sufficient threat to human health and/or the environment to warrant cleanup under the Comprehensive Environmental Response, Compensation, and Liability Act (CERCLA). EPA is responsible for updating and maintaining the NPL. Noise Abatement Criteria: In accordance with Section 772 of the Federal Aid Policy Guide, the Federal Highway Administration has established noise standards. These standards include Noise Abatement Criteria, which are noise levels that represent a balancing of desired levels of noise with achievable levels. Non-attainment: A condition where one or more of the National Ambient Air Quality Standards for a pollutant have been violated. Notice of Intent (NOI): The CEQ regulations and Title 23, Code of Federal Regulations, Part 771, Environmental Impact and Related Procedures, require the sponsoring agency to publish a notice of intent in the Federal Register as soon as practicable after the decision is made to prepare an environmental impact statement and before the scoping process for a proposed action. Ozone: Unstable blue gas with a pungent odor, formed principally in secondary reactions involving volatile organic compounds, nitrogen oxides, and sunlight. Paleozoic: An era of geologic history that extends from approximately 230 million years ago to 620 million years ago. Palustrine, Emergent Wetlands (PEM): Wetlands characterized by erect, herbaceous vegetation present for most of the growing season (e.g., marshes, wet meadows, fens, sloughs, or potholes). Palustrine, Forested Wetlands (PFO): Wetlands characterized by woody vegetation over 6 meters (20 feet) in height (e.g., swamps or bottomlands). Palustrine, Scrub-Shrub Wetlands (PSS): Wetlands characterized by the dominance of small trees, saplings and shrubs. These wetlands generally have higher value than emergent systems, xvi
39 Glossary of Terms Capital Beltway Study but not as much as forested systems. Physiographic Province: A region that is generally consistent in geologic structure and climate and which has had a unified geomorphic history. Precambrian: The earliest era of geological history, extending from approximately 620 million years ago to 3,800 million years ago. Resource Management Areas: As designated by Fairfax County, these areas include floodplains, highly erodible soils, steep slopes, highly permeable soils, and non-tidal wetlands not designated in RPA zones. Resource Protection Areas (RPAs): Lands at or near the shoreline that have intrinsic water quality value for ecological and biological processes, or are sensitive to significant water quality degradation impacts. The RPA designation includes tidal wetlands, tidal shores, nontidal wetlands connected by surface flow and contiguous to tidal wetlands or tributary streams, and a minimum 100-foot (30.5-meter) buffer landward along both sides of any tributary stream and all other components of RPAs. Riparian: Pertaining to anything connected with or immediately adjacent to the banks of a stream. Screenline: A line drawn to cross two or more parallel roadways to determine the total traffic that is traveling in a specific direction. For example, a horizontal line may be drawn to cross two or more north-south roadways to determine the volume of traffic traveling northbound or southbound in that corridor. Slip ramp: A ramp between two parallel roadways traveling in the same direction (as in an express/local roadway system) which allow vehicles to move between the two facilities. Throughput: The number of vehicles or persons that traverse past a point or uniform segment of a lane or roadway during a specified time period, usually expressed as vehicles or persons per hour. Through trip: A trip which has an origin and destination outside of a specified area. Travel demand forecast: A forecast for travel demand on future or modified transportation system alternatives using existing or projected land use, socioeconomic, and transportation services data. Upstream: Direction from which traffic is arriving at a location. When a vehicle is upstream of a bottleneck, it means that the vehicle is traveling toward the bottleneck and has yet to reach it. Volume to capacity ratio (v/c): The ratio of demand flow rate to capacity for a freeway facility. Watershed: A specific geographic area drained by a major stream or river. Wetlands: Areas that are inundated or saturated by surface water or groundwater at a xvii
40 Capital Beltway Study Glossary of Terms frequency and duration sufficient to support, and under normal conditions do support, a prevalence of vegetation typically adapted for life in saturated soil conditions. xviii
41 1 PURPOSE AND NEED 1.1 PROJECT DESCRIPTION AND LOCATION The Federal Highway Administration (FHWA), in conjunction with the Virginia Department of Transportation (VDOT), proposes to improve the Capital Beltway (I-495) in Fairfax County, Virginia, between the I-95/I-395/I-495 interchange and the American Legion Bridge over the Potomac River. Improvements are needed to alleviate safety and operational concerns, provide road design features consistent with current standards, add capacity for congestion relief, enhance transportation system linkage, and fulfill the goals of local and regional plans. Constructed as part of the interstate highway system, the Beltway was originally designed to serve through traffic bypassing Washington, D.C. However, since its completion in 1964, growth in the Washington metropolitan area and changes in land use and travel patterns have made the Beltway an integral part of the regional and local transportation systems. Although still functioning as a bypass, the Beltway is now used primarily for travel to and from destinations within the region. Each day, hundreds of thousands of local residents use the Beltway to travel to work, shopping centers, and other destinations throughout the metropolitan area Project Setting The Capital Beltway is a 64-mile (103-kilometer) multi-lane circumferential freeway serving the Washington, D.C. metropolitan area (see Figure 1-1). The Beltway is located approximately 10 miles from Washington, D.C. in both Virginia and Maryland. The Virginia portion of the Beltway is approximately 22 miles (35 kilometers) long and forms a crescent through northeastern Fairfax County, from the Woodrow Wilson Memorial Bridge in Alexandria to the American Legion Bridge near Great Falls. This portion of the Beltway connects to major interstate highways (I-95, I-395, and I-66), limited access roadways (Dulles Access/Toll Road and the George Washington Memorial Parkway), and local roadways, including higher-capacity secondary roadways via 15 interchanges. Because of its circumferential nature, the separate directional roadways on the Beltway are referred to as the Inner and Outer Loops. Traffic runs clockwise on the Inner Loop and counterclockwise on the Outer Loop. 1-1
 PROJECT SETTING BLTWY010 Figure 1-1 CAPITAL BELTWAY")
42 Capital Beltway Study Chapter Approximate Scale (Miles) PROJECT SETTING BLTWY010 Figure 1-1 CAPITAL BELTWAY STUDY 1-2
43 Purpose and Need Capital Beltway Study The Virginia portion of the Beltway has four through lanes in each direction, with auxiliary lanes or collector-distributor roadways provided at several interchanges. Adjacent land uses include numerous residential subdivisions, dense commercial development, high-rise office buildings, and parks and recreational areas Project Limits The proposed improvements to the Beltway and its interchanges would extend for about 14 miles (23 kilometers), from Backlick Road to the American Legion Bridge over the Potomac River, as shown on Figure 1-2. Backlick Road is the limit of major improvements to the I-95/I-395/I-495 interchange. The American Legion Bridge is the limit of Beltway improvements to be constructed by the Maryland State Highway Administration. The project would also include improving portions of 10 roadways that connect to the Beltway via existing interchanges, listed in Table 1-1. Modifications to these roadways would properly integrate the proposed Beltway and interchange improvements with existing or planned designs and traffic patterns on these other roadways. Termini for each of these connecting roadways are also presented in Table 1-1. Table 1-1 IMPROVEMENT LIMITS OF ROADWAYS CONNECTING WITH THE BELTWAY Roadway Western Limit Eastern Limit Braddock Road (Route 620) Inverchapel Road Ravensworth Road Little River Turnpike (Route 236) Woodlark Drive Woodland Road Gallows Road (Route 650) Decourcey Court Hemlock Drive Arlington Boulevard (U.S. Route 50) Gallows Road Fairview Park Drive Interstate 66 (I-66) Cedar Lane Barbour Road Leesburg Pike (Route 7) Chain Bridge Road George C. Marshall Drive Chain Bridge Road (Route 123) Leesburg Pike Dulles Access/Toll Road Dulles Access/Toll Road (Route 267) Spring Hill Road Chain Bridge Road Georgetown Pike (Route 193) Saigon Road Dead Run Drive George Washington Memorial Parkway Live Oak Drive Dead Run The FHWA has determined that this project has the following characteristics: Has logical termini; that is, it has rational endpoints for consideration of transportation improvements and for review of environmental impacts. The interchange linking I-95, I-395, and I-495 represents a major distribution point to other major travel arteries in the regional and national highway network. This interchange is currently undergoing a major upgrade of its own. The Potomac River at the American Legion Bridge divides the regional transportation system of Fairfax County, Virginia from the regional transportation system of Montgomery County, Maryland. Virginia and Maryland transportation officials have differing concepts of how best to 1-3
44 Capital Beltway Study Chapter 1 End Project Legend: 47 = Interchange Number Begin Project Approximate Scale (Miles) PROJECT TERMINI BLTWY011 Figure 1-2 CAPITAL BELTWAY STUDY 1-4
45 Purpose and Need Capital Beltway Study adapt Beltway improvements to their own regional needs. The American Legion Bridge represents a logical transition point between these concepts. Has independent utility; that is, it will provide functional improvements to the Beltway that can stand alone and serve a major purpose, even if no other roadway improvements are made in the region. Is of sufficient length to fully assess potential environmental impacts associated with the proposed improvements. Does not restrict consideration of alternatives for other reasonably foreseeable transportation improvements in the region Project Status The Beltway has evolved over time. Development of a "beltway" for the Washington, D.C. area dates back to the late 1920s, when the National Capital Planning Commission (NCPC) first recommended a series of ring roads for the metropolitan area. This concept was reinforced during World War II, when military planners advocated construction of a highway network through and around major metropolitan areas throughout the United States. By 1950, a circumferential roadway for the Washington area was included on the NCPC s regional planning map as the "Cross County Loop." Construction of a 64-mile (103-kilometer) circumferential highway, with two lanes in each direction, was formally approved in 1956 as part of the original interstate highway system. Construction in Virginia began in 1958, and in 1960 the entire roadway was officially named the "Capital Beltway." The Beltway was completed and opened to traffic in Since then, incremental improvements have been made, including the addition of lanes, construction of noise barriers, construction or modification of interchanges, and minor improvements to improve safety. In Virginia, the last major expansion of the roadway occurred between 1974 and 1977, when the Beltway was widened from four to eight lanes. Planning for Beltway improvements has been ongoing for several years. A Major Investment Study (MIS) was initiated in November 1994 and completed in early The MIS was conducted in accordance with 23 CFR 450, which, at that time required such studies for large-scale transportation improvements in urban areas. Elements of the study included comprehensive analyses of highway and transit travel in the Capital Beltway corridor, consultations with citizens in a series of public information meetings, coordination with local and regional planning agencies, and development and testing of a range of strategies for dealing with transportation deficiencies in the corridor. The conclusion of the MIS was that highway improvements promoting high occupancy vehicle (HOV) and bus transit use would be the most effective transportation investment to serve current and future travel demand on the Capital Beltway. The MIS recommendation was that potential rail transit improvements serving the Capital Beltway corridor be studied separately on a regional basis by an appropriate transit agency or multi-jurisdictional team. In 1998, FHWA and VDOT launched location and environmental studies for the Beltway improvements covered in this document. Initially, an Environmental Assessment (EA) was undertaken to determine if the proposed improvements would result in significant environmental impacts, warranting preparation of a full Environmental Impact Statement (EIS). 1-5
46 Capital Beltway Study Chapter 1 As preliminary engineering and environmental studies progressed, and as input from citizens and environmental agencies was collected, it became apparent that the footprint of the proposed improvements would likely be larger than originally envisioned and that the resulting environmental consequences would also be greater than originally anticipated. Therefore, a decision was made to prepare a full Environmental Impact Statement, and a Notice of Intent to do so was published in the Federal Register on July 11, The environmental data collection and analysis efforts involved in preparing the Draft EIS are described in Chapters 3 and 4. The public involvement and agency coordination activities are described in Chapter 7. The Draft EIS was published in March 2002 and made available for public review and comment. It was distributed to the agencies listed in Chapter 6, and a notice of availability was published in the Federal Register. This document, along with other data and informational displays was presented at Location Public Hearings held in May Following the hearings and an analysis of the comments received, the proposed designs were scaled back to reduce the physical impacts and costs. In addition, another major revision was made in response to a public-private venture proposal introducing High Occupancy Toll (or HOT) lanes on the Beltway. Additional public information meetings were held in June 2004 to report findings regarding the potential impacts and costs of the revised alternatives in comparison to the Candidate Build Alternatives presented in the Draft EIS. Based on the input received at the meetings and on the detailed engineering, traffic, and environmental analyses for the revised alternatives, the 12-Lane HOT Alternative, was selected for implementation by the Commonwealth Transportation Board on January 20, Next steps. This Final EIS is being made available for public review. Like the Draft EIS, it was distributed to the agencies listed in Chapter 6 and notice of its availability was published in the Federal Register. After a review period, FHWA will issue a Record of Decision. If a build alternative is selected, design and construction of the proposed improvements may then advance as funding permits. 1.2 PURPOSE AND NEED FOR ACTION The Capital Beltway is one of the most important highways in the Washington region. It links other major roadways in the region and carries more traffic than any other road in Virginia. Because of the Beltway s role as a key link in the region s transportation system, major Beltway improvements have been recommended in local, regional, and state transportation plans for almost a decade. These improvements are needed to accomplish the following: Provide safer travel on the Beltway. Correct problems with current roadway design and interchange configurations. Accommodate growing travel demand and changes in regional trip characteristics. Ease congestion on the Beltway and reduce "cut-through" traffic on local roadways and neighborhood streets. 1-6
47 Purpose and Need Capital Beltway Study Complete the region s HOV network and enhance connections with other regional roadways. Accommodate expanded availability of mass transit in Northern Virginia and improve access to other transportation modes. Serve the diverse mix of land uses in Northern Virginia more effectively and improve mobility between regional activity centers. Help sustain the local and regional economy. Upgrade the region s transportation infrastructure in accordance with local and regional plans. Factors contributing to the need for Beltway improvements are discussed in the following sections Operational Characteristics Travel demand on the Beltway routinely exceeds capacity 1 during peak periods (6:00 to 9:00 a.m. and 3:00 to 7:00 p.m.), and commonly results in extended periods of congestion. Future growth of traffic volumes and off-peak trips will lengthen the periods of congestion. Current and projected traffic volumes on the Beltway within the project limits are shown in Table 1-2. Further detailed analysis of the existing conditions, including Levels of Service, may be found in Chapter 3 of the Transportation Technical Report. Table AND 2020 DAILY TRAFFIC VOLUMES BY BELTWAY SEGMENT From To 1998 Traffic Volumes 2020 Traffic Volumes* I-95/I-395/I-495 Interchange Braddock Road 198, ,000 Braddock Road Little River Turnpike 205, ,000 Little River Turnpike Gallows Road 220, ,000 Gallows Road Arlington Boulevard 225, ,000 Arlington Boulevard Interstate , ,000 Interstate 66 Leesburg Pike 215, ,000 Leesburg Pike Chain Bridge Road 188, ,000 Chain Bridge Road Dulles Access/Toll Road 178, ,000 Dulles Access/Toll Road Georgetown Pike 211, ,000 Georgetown Pike George Washington Parkway 212, ,000 * Without improvements to the Beltway. Source: Capital Beltway Study Travel Demand Forecasts (1999) Although it comprises only 3 percent of the total highway lane-miles in Northern Virginia, 2 the Beltway carries almost 11 percent of all trips made in the region each day. For many travelers, 1 The generally accepted capacity of a single freeway lane is 2,200 vehicles per hour. Therefore, the capacity of the existing four-lane Capital Beltway is 8,800 vehicles per hour. Existing demand volumes on the Beltway often exceed 9,000 vehicles in one hour, resulting in congestion and the backup of vehicles over time. 2 Arlington County, City of Alexandria, City of Fairfax, Fairfax County, City of Falls Church, Town of Leesburg, Loudoun County, Cities of Manassas and Manassas Park, and Prince William County. 1-7
48 Capital Beltway Study Chapter 1 the Beltway is the preferred (and sometimes only) route for trips to and between residential communities, activity centers, and major employment locations in Fairfax County and elsewhere in the Washington metropolitan area. Key characteristics of Beltway trips include the following: Travel on the Beltway is usually only a "link" or portion of a longer trip. Most trips begin or end on other major roadways in the region. Most trips on the Beltway are short (not long-distance or "through") trips. Most drivers who use the Beltway get on and off within three to five interchanges. More than 75 percent of the motorists who travel on the Beltway begin or end their trip within Fairfax County. Between the I-95/I-395/I-495 interchange and the Dulles Access/Toll Road, 30 to 40 percent of these trips are to or from locations within 2 miles of the Beltway. Figure 1-3 shows the origins of daily vehicle trips on sections of the Beltway Safety and Operational Concerns Even minor traffic incidents on the Beltway can cause delays, and major accidents can cause delays lasting several hours, both on the Beltway and the secondary roads that travelers use as alternate routes. The high traffic volumes and insufficient capacity lead to operational problems such as reduced travel speeds, longer back-ups, and extended periods of congestion. Congestion causes accidents on the Beltway. A number of recent safety studies found that congestion is a major cause of Beltway accidents. Crashes on the Beltway happen most often during peak periods, and rear-end collisions account for 44 percent of all crashes (almost double the rate of such accidents on urban interstates nationally). Accidents on the Beltway also tend to cause "follow-on" crashes due to increased congestion, abrupt driving maneuvers, and increased hazards. The current design of the Beltway and its interchanges may also be a factor in some accidents. Entrance and exit ramps to the left, substandard acceleration/deceleration lanes, and tight loop ramps create challenging driving conditions. Interchange spacing is inconsistent, and, with some interchanges located less than a mile apart, entry and exit to the Beltway requires accelerating and decelerating traffic to merge within a relatively short distance. Most of the interchanges do not meet current design standards, and connections with intersecting roadways are insufficient for current traffic volumes. Beltway crashes often occur in known "high-accident" locations, generally at or near an interchange. Between 1990 and 1994, more than 75 percent of all Beltway crashes occurred within ½ mile of an interchange. The interchanges with the highest number of accidents during this time period were I-66, Arlington Boulevard, Braddock Road, and Leesburg Pike. Beltway travel speeds are decreasing. Increasing congestion on the Beltway has already reduced travel speeds to well below the posted limit of 55 miles per hour (mph) during peak travel times. Travel speeds on the Inner Loop during the morning peak period now average less than 20 mph between Braddock Road and Leesburg Pike. During the evening peak period, the average travel speed on the Outer Loop between the Dulles Access/Toll 1-8
49 Daily Trips Trip Origins Frederick Loudoun Fairfax 270 Montgomery D.C. Arlington Alexandria Howard 5 95 Anne Arundel 50 Prince Prince George's George's Purpose and Need Section 1 Section 2 Section 3 Section 4 Section 5 Prince William 95 Charles 301 Legend: MD Externals VA Externals Howard Anne Arundel USERS OF THE CAPITAL BELTWAY CAPITAL BELTWAY STUDY Charles Frederick Prince William Loudoun Fairfax East of I-95 Fairfax 2+ miles Outside Beltway Between I-95 & I-66 Fairfax 2+ miles Outside Beltway North of I-66 Fairfax Within 2 miles of Beltway Fairfax 2+ miles Inside Beltway Alexandria Arlington Prince George's Montgomery D.C. The bar chart shows the existing origins and estimated number of daily vehicle trips using sections of the Capital Beltway within the study area. A trip is considered to use a given Beltway section if it travels on the Beltway within that section. Thus the number of trips using a Beltway section will be higher than the average daily traffic. If a trip uses more than one Beltway section, it will appear on the chart on each section that it uses. Source: Metropolitan Washington Council of Governments Regional Model-Round 6A, 1999 BLTWY072 Figure 1-3 Capital Beltway Study
50 Capital Beltway Study Chapter 1 Road and Braddock Road is less than 20 mph. Overall travel speeds will continue to decline as traffic volumes increase on the Beltway. Figure 1-4 shows peak hour travel speeds on sections of the Beltway within the project limits. Beltway back-ups are getting longer. Traffic volumes on the Beltway, and at many of its interchanges, already exceed design capacity. Because the roadway and these interchanges cannot accommodate all of the vehicles now using them, traffic on the Beltway becomes congested. During the morning peak period, it is not uncommon for traffic approaching Tysons Corner from the south to be backed up as far as Braddock Road (a distance of approximately 6 miles) and for spillover to occur, causing significant backups on eastbound I-66 outside the Beltway. From the north, congested traffic extends from the Tysons Corner area to the American Legion Bridge (about 4 miles), and often to the junction with I-270 in Maryland (about 9 miles). Beltway travel times are increasing. As travel speeds decline and back-up lengths increase, average travel times for trips on the Beltway will increase. Today, about 30 percent of drivers using the Beltway experience delays during their trips. By 2020, 90 percent of drivers will experience delays. Delay is defined as an increase in the length of time in which a specific trip can be made due to congestion over the time it would take at free-flow speeds. The time it takes to complete a trip between Springfield and Tysons Corner is expected to almost double by 2020; the time required for a trip from Fairfax to Bethesda will increase by more than 110 percent Roadway Design Although incremental improvements have been made to the Beltway, the roadway and its interchanges are largely unchanged from plans developed in the late 1950s. Since that time, experience in operating heavily traveled urban freeways has led transportation planners to make changes in the way these types of roads and interchanges are designed. The Beltway was not designed to accommodate today s traffic volumes and it does not meet current engineering requirements for high-volume, high-speed urban interstate freeways. The design issues that need to be considered include the following: Interchange ramps with sharp curves, tight loops, and low speeds (Braddock Road, Little River Turnpike, Leesburg Pike, and Chain Bridge Road). Short merging and exiting lanes, and excessive weaving (all interchanges). Entrance and exit ramps on the left, instead of the customary right, for general-purpose traffic (I-66 and Dulles Access/Toll Road). HOV traffic merging onto non-hov roadways (I-66 and Dulles Access/Toll Road). Lack of full traffic movements at key interchanges (I-66 and Dulles Access/Toll Road). Dual exits (left- and right-handed) at the same interchange (I-66). 1-10
51 Purpose and Need Capital Beltway Study Georgetown George AMERICAN LEGION MEMORIAL BRIDGE MARYLAND Pike 193 Wash Washington Leesburg Pike Dulles Access and Toll Road VIRGINIA Inner Loop (Northbound) AM Peak Period i ngton FAIRFAX COUNTY ARLINGTON COUNTY Memorial WASHINGTON, D.C. Park w ay VIENNA FALLS CHURCH FAIRFAX POTOMAC RIVER Little River Turnpike Outer Loop (Southbound) PM Peak Period 236 ALEXANDRIA WOODROW WILSON MEMORIAL BRIDGE NOT TO SCALE. 1 Legend: >50 _ mph mph mph mph <20 mph BLTWY069 TRAVEL SPEEDS Figure 1-4 CAPITAL BELTWAY STUDY 1-11
52 Capital Beltway Study Chapter Capacity Constraints Because the Beltway serves as both a regional circumferential highway and a principal local highway, it is often the only route available to serve an increasing number of trips being made throughout the day. Congestion, already a daily problem during peak periods, is becoming more frequent at other times of the day, as well as on weekends and holidays. Without additional roadway capacity, the level and duration of congestion will get worse on the Beltway and on other parts of the regional transportation network. Expansion of the regional roadway network has not kept pace with growth. Among major metropolitan areas in the nation, the Washington, D.C. area has the fifth smallest roadway network (i.e., the number of lane miles per 1,000 persons). According to one annual survey, the Washington, D.C. area now ranks fourth among areas with the most congested roadways in the nation. Average commuting times for area residents (30 minutes each way) are the second longest in the nation (behind New York City), and 30 percent longer than the national average. Even though the region s population has almost tripled over the last 40 years, more than 200 miles of planned regional roadways throughout the metropolitan area have not been constructed. The Beltway has not been improved in 30 years. Although the amount of daily traffic on the Beltway has tripled since the mid-1970s, there have been no major improvements to the Beltway or expansion of its capacity since This increase in overall traffic volumes, combined with interchanges that cannot adequately handle those volumes, has led to recurring and extended periods of congestion. During peak travel times, Beltway congestion generally lasts for at least three hours. Inclement weather or accidents (in either direction) can cause even longer periods of congestion. Beltway congestion spills over to adjacent roadways. Congestion on the Beltway encourages drivers to seek shortcuts on local and neighborhood streets. This "cut-through" traffic problem is most acute on those roads or streets that parallel the Beltway and provide connections between major radial roadways. As congestion on the Beltway increases, more drivers will use alternative routes that have limited capacity and are not intended to accommodate high traffic volumes. For example, daily traffic volumes on Gallows Road between the Beltway and Tysons Corner are projected to increase by as much as 30 percent by Similar increases are expected on other local roads that provide alternatives to using the Beltway. Congestion will get worse. Without improvements, Beltway traffic is projected to increase by as much as 45 percent by More than 300,000 vehicles are expected to use the Beltway each day on its most heavily traveled segment: between Little River Turnpike and I-66. Congested conditions, which lead to longer travel times and delays, are expected to last for more than 18 hours each day System Linkage A key objective of any transportation improvement is to strengthen the linkage among elements of the region s transportation system. The Beltway is a critical element in the transportation network because of its unique dual role as a regional circumferential bypass 1-12
53 Purpose and Need Capital Beltway Study and a major local road. Improvements are needed to ensure that the roadway is capable of meeting future demand for traveling through and within the region. In addition, without HOV lanes on the Beltway, the regional HOV system is incomplete. The Beltway has dual transportation functions. As development in Northern Virginia has grown, the Beltway has evolved into a dual-purpose roadway that provides mobility between major activity centers and connects radial roadways within the region. For local traffic, it serves as the "Main Street" of Fairfax County and provides a continuous northsouth route between residential areas, employment centers, and other destinations. The Beltway is the preferred route for many trips within the county. As shown in Figure 1-1, the Beltway also connects to each major radial roadway in the region, providing access to Washington, D.C. and other destinations throughout the region. For longer-distance trips, the Beltway serves as the principal connection between I-95, I-66, and I-270. The regional HOV system is incomplete. The Washington, D.C. region has one of the nation s most extensive HOV roadway networks, and HOV facilities have been in operation in Northern Virginia since the 1960s. All of the radial freeways in Northern Virginia now have lanes dedicated for HOV use during peak periods. As a result, the region has the highest percentage of workers who carpool (16 percent) of any metropolitan area in the United States, and the second lowest percentage of residents who travel to work by single-occupancy vehicle. The Beltway is the one critical link that is currently missing from the regional HOV system. Completion of HOV lanes on the Beltway would connect the HOV elements already in place (I-95/I-395, I-66, and the Dulles Access/Toll Road), improve HOV access to major regional activity centers, and allow high-occupancy vehicles (carpools, vanpools, buses) to operate throughout the region without mixing with general-purpose traffic. The Beltway is important to regional freight movement. The Beltway serves as the primary route for the transfer and delivery of local goods and services. Approximately 70 percent of freight movements within the region are made by truck, and truck movements between warehouses and businesses in Virginia and Maryland occur almost exclusively via the Beltway. In addition, the Beltway is a key link in transporting freight to and from the region s airports, and congestion on the regional highway system is one of the major impediments to movements of air cargo within the region. The Beltway is also part of the national highway system, and provides an important link between major interstate highways in the region for long-distance freight shipments. The Beltway s role in evacuation. In addition to the roles described above, the Beltway also plays a significant role in aiding evacuation of the Washington, D.C. metropolitan area in the event of an emergency. The Beltway connects to every major highway within the region and must be traversed at some point in order to access the major exit routes from the District of Columbia and the surrounding inner suburbs Intermodal Relationships Although the Washington, D.C. region has one of the nation s most successful mass transit (bus and rail) systems, few suburb-to-suburb trips are made via transit. For example, in Fairfax County, only 3 percent of work trips are made using transit. Factors contributing to this are a lack of dedicated lanes on major roadways in the region and limited scheduled 1-13
54 Capital Beltway Study Chapter 1 service between residential areas and key suburban destinations, such as Tysons Corner. The Beltway serves as an important intermodal link for movements among other transportation facilities, such as airports, rail terminals, transit stations, and ports, and it complements other transportation modes in or near the corridor. Figure 1-5 shows the principal transit routes and facilities in the study area. The Beltway does not currently support effective use of bus transit. The Washington Metropolitan Area Transit Authority (WMATA) recently began operating suburb-to-suburb express bus routes on the Beltway between activity centers in Maryland and Virginia. The success of these routes has been constrained by the lack of separate lanes and access points at interchanges. Without such lanes, the "express" buses must travel in the congested general-purpose lanes, which do not provide the travel time savings that are critical to attracting and retaining riders. Adding lanes dedicated to HOV and transit travel would make the express bus service currently provided on the Beltway more attractive, encourage the initiation of new service on other suburb-to-suburb links, and promote transit connections among the I-95, I-66, and Dulles corridors. Congestion on the Beltway impedes access to other transportation modes. The Beltway is an important highway link for vehicular movements among facilities for other transportation modes in the metropolitan area, including three major airports (Reagan National, Dulles International, and Baltimore-Washington International) and two rail systems (Metrorail and Virginia Railway Express). Congestion on the Beltway increases travel times to these other facilities, which in turn decreases traveler confidence in being able to travel to and use these facilities in a timely manner. Furthermore, Beltway congestion causes traffic diversions to other local roads, further compounding the overall reduction in regional mobility Increased Travel Demand and Changing Trip Patterns Growth in the Washington area and geographic shifts in the regional economy have increased travel demand and changed the way that many trips are made within the region. Population and employment growth, particularly in Fairfax County, has fueled increases in travel demand for the Beltway and other roadways. Trip patterns also have changed markedly; today, suburb-to-suburb travel is as common as trips to or from the Washington, D.C. urban core. Trips now are dispersed throughout the region, and roadways originally intended for local or through travel must now serve commuters as well. As shown in Figure 1-6, the daily volumes on the Beltway have increased steadily over the 20-year period. Up until the early 1980s, traffic growth was relatively constant at approximately 5 percent per year. In the 1980s, traffic growth on I-495 almost doubled, increasing at an average of approximately 10 percent per year. In the 1990s, traffic growth has remained steady, increasing at approximately 5 percent per year. Detailed traffic data are presented in the Transportation Technical Report. Changing demographics and employment patterns are increasing the number of trips made in the region. The combination of increasing population, a growing economy, the large proportion of two-worker households, high labor force participation, growth in temporary and part-time employment, and smaller household sizes is causing an increasing number of trips to be made within the region each day. 1-14

55 Purpose and Need Capital Beltway Study End Project WOLF TRAP Metrobus Route 14A-D &14M Legend: = Metrobus = Fairfax Connector = Metrorail Orange Line = Metrorail Blue Line = Proposed Metrorail Silver Line DUNN LORING- MERRIFIELD 495 WEST FALLS CHURCH/VT/UVA VIENNA/ FAIRFAX GMU EAST FALLS CHURCH BALLSTON- MARYMOUNT UNIVERSITY Fairfax Connector Route 401 BURKE CENTRE ROLLING ROAD 495 BACKLICK ROAD Begin Project VAN DORN STREET Approximate Scale (Miles) BUS AND RAIL TRANSIT BLTWY070 Figure 1-5 CAPITAL BELTWAY STUDY 1-15
56 1-16 Average Vehicles per Day 240, , , , , , , ,000 '78 '79 '80 '81 '82 '83 '84 '85 '86 '87 '88 '89 '90 '91 '92 '93 '94 '95 '96 '97 '98 Legend: = Braddock Road to Little River Turnpike = I-66 to Route 7 = George Washington Parkway to American Legion Bridge Note: = Indicates Data Not Available AVERAGE DAILY TRAFFIC ON BELTWAY CAPITAL BELTWAY STUDY BLTWY056 Figure 1-6 Capital Beltway Study Chapter 1
57 Purpose and Need Capital Beltway Study Most trips in the region are no longer focused on a central destination. In 1998, 10 percent of all regional trips were made between Washington, D.C. and outlying areas, while 73 percent of regional trips were from suburb to suburb. In Fairfax County, more than half of the residents now work within the county, and less than 20 percent work in Washington. The number of suburb-to-suburb trips within the region is expected to increase by 85 percent between 1990 and Combined trips, with intermediate stops, are increasing. It is now common for workers to combine shopping and entertainment trips with their commute, either to avoid another trip after getting home or to delay their trip home until congestion levels have waned. According to a study by the Metropolitan Washington Council of Governments (MWCOG), 15 percent of all workers made at least one stop (for example, for child care, shopping, personal or family business) on their way to work in 1998, a 50 percent increase from On the work-tohome trip in the evening, more than 30 percent of all workers made intermediate stops. Most trips in the region are made by automobile. According to MWCOG, 81 percent of all trips in the Washington, D.C. region each day are made by auto; only 6 percent are made using transit (bus, Metrorail, commuter rail). The remaining daily trips are made via walking (8 percent), school bus (4 percent), or other means (1 percent). Even with planned improvements to the region s transit system, transit s share of total regional trips is not expected to increase significantly by Land Use Changes Continued population growth and a restructuring of the regional economy have transformed Fairfax County from a bedroom community to a multi-faceted suburban area and major employment center. However, most of its roadways (including the Beltway) were planned or constructed when the county was predominantly a residential suburb, and consequently were not designed to handle today s traffic volumes or trip patterns. The proposed improvements would upgrade the Beltway to accommodate these changes in area land uses and metropolitan development patterns. Rapid urbanization. After the influx of new residents in the 1950s and 1960s, Fairfax County quickly changed from a predominantly residential community to an urbanized suburb. The expanding population base created demand for commercial services and retail shopping, and encouraged businesses to relocate closer to their customers and employees. Large areas of the county (often along major roadways) were rezoned to allow commercial, retail, and industrial development. Since 1975, 84 percent of the commercial development in the county has occurred, as has 57 percent of retail development and 65 percent of industrial development. Regional growth is occurring in the suburbs. Suburbs outside the traditional core of the metropolitan area, such as Fairfax County, are now the preferred location for new residents and businesses, in part because these areas have vacant land available that can accommodate the demand for new residential and commercial development. Almost all regional population and employment growth over the last 20 years has been in suburban areas. These trends accelerated during the 1990s and are expected to continue. 1-17
58 Capital Beltway Study Chapter 1 Non-residential land uses are increasing. The total floor area of non-residential land uses in Fairfax County grew by 235 percent between 1980 and During the same time period, the number of residential housing units grew by only 57 percent. Today, only 14 percent of the land planned for residential uses remains vacant, compared to 32 percent of the land designated for commercial and industrial uses. Suburban activity centers have emerged. Recent commercial and retail development has become concentrated in selected suburban locations, primarily in locations with convenient access to major transportation facilities. Two of these activity centers, or edge cities Tysons Corner and Merrifield are served directly by the Beltway. The Beltway is also used for a portion of many trips to other suburban activity centers, such as Reston/Herndon, Springfield, Fairfax/Fair Oaks, and Montgomery County, Maryland. Additional development is already approved. Fairfax County is not yet completely developed, and continued development of now-vacant land is included in the county s comprehensive plan. When the county is completely built out, there will be an additional 56,000 housing units and another 4,300 acres of commercial and industrial development. At the two activity centers along the Beltway alone (Tysons Corner and Merrifield), an additional 25 to 30 million square feet of commercial office and retail space is anticipated. The continued development of Fairfax County and the subsequent employment growth will increase Beltway travel demand Regional Population Growth The Washington, D.C. metropolitan area has experienced substantial population growth and suburban expansion over the last four decades. Almost all of this growth occurred in suburbs that are served by the Beltway, including Fairfax County. A review of statistics from the U.S. Census Bureau and MWCOG identified several trends that are contributing to increased use of the Beltway, including the trends described below. Sizeable and sustained population growth. According to MWCOG, between 1960 and 1998, the population of Northern Virginia grew at an annual rate of almost 5 percent, from 614,000 to more than 1.7 million. The area s population has increased by nearly 50 percent in the last 20 years alone. Shift of the region s population to the suburbs. In 1960, Fairfax County was the region s fourth largest jurisdiction, with 275,000 residents (the District of Columbia was the largest). By 1990, Fairfax County was the largest jurisdiction in the region, with almost 820,000 residents. Today Fairfax County s population has exceeded the one million mark. Increasing number of households. Due to changing demographics and societal trends, the number of households in Northern Virginia has been growing at an even faster rate than the population (more than 7 percent per year). Between 1960 and 1995, the total number of households grew by more than 250 percent, from 171,000 to 603,000. The region s population will continue to grow. Although projections indicate that the rate of regional growth will abate, the area will continue to attract new residents over the next 20 years. MWCOG estimates that by 2020, the population of Northern Virginia will increase another 39 percent, to 2.5 million people. Almost half of these residents will live 1-18
59 Purpose and Need Capital Beltway Study in Fairfax County. By 2020, there will be 250,000 more households in Northern Virginia; 100,000 of these will be in Fairfax County Economy and Employment Changes in the composition of the regional economy and shifts in employment patterns over the past 30 years have increased demand for all transportation facilities outside the District of Columbia, particularly for roadways such as the Beltway that provide mobility among major suburban business and employment centers. Improving the Beltway is important to the continuing economic vitality of Northern Virginia for the reasons described below. Northern Virginia is a major employment center and key element of the regional economy. In 1995, total employment in Northern Virginia was 34 percent higher than employment in the District of Columbia and 14 percent higher than the combined employment in Montgomery and Prince George s counties in Maryland. About half of all jobs in Northern Virginia are located in Fairfax County, where a diversified economic base includes high-technology companies, corporate and regional headquarters, trade associations, business and financial services, and wholesale and retail trade outlets. Most new jobs and businesses are in suburban areas. New businesses are locating primarily in suburban areas such as Fairfax County, especially on sites with convenient access to major transportation facilities such as the Beltway. Over the last three decades, suburban employment grew at a faster rate than the population, and since the early 1980s, approximately 84 percent of the new jobs created in the Washington metropolitan area were located in the suburbs. The District of Columbia, the traditional core of the metropolitan area, now accounts for less than 30 percent of all jobs in the region. Regional employment will increase substantially over the next two decades. By 2020, employment levels in Northern Virginia are expected to increase by 50 percent, amounting to 1.5 million people in the work force. Much of this job growth will occur at established suburban activity centers along the Beltway, including Tysons Corner and Merrifield, and at other nearby activity centers that rely on the Beltway for regional mobility (Reston/Herndon, Dulles Airport, Fairfax/Fair Oaks, and Springfield). Changes in the composition of the work force are increasing travel demand. The Washington, D.C. area has the highest number of commuters per household (1.52) of any region in the country, in large part because nearly 80 percent of all eligible workers are employed and 75 percent of households include two workers. These same-household workers often commute to different parts of the metropolitan area. Congestion has economic costs. The Beltway s increasing congestion could undermine efforts to attract new business and retain businesses already in place. Traffic congestion is already the top concern of current workers and prospective businesses seeking to relocate to the area. According to a recent study by the Texas Transportation Institute, on a per capita basis, Washington-area residents currently spend about 46 hours per year sitting in traffic, at a cost of $780 per person. Freight movements are also affected by congestion, which slows deliveries and increases shipping costs. Many businesses now plan their activities and deliveries to avoid travel during the Beltway s most-congested periods. By 1-19
60 Capital Beltway Study Chapter , the Greater Washington Board of Trade estimates that increased congestion will raise local shipping costs by $345 million a year. These costs, ranging from $750 to $1,300 per household, are likely to be passed on to consumers in the form of higher prices for goods and services Local Plans and Policies Improving the Beltway would upgrade the region s transportation infrastructure in accordance with local and regional plans. Enhancing mobility in the Beltway corridor and adding capacity to the roadway has long been recommended in a number of long-range transportation and land use plans prepared by various local, regional, state, and federal agencies. Current plans that generally endorse or recommend continuing improvements to the Beltway include the following: Fairfax County s Policy Plan Fairfax County s Comprehensive Plan National Capital Region Transportation Planning Board s Transportation Vision Plan National Capital Planning Commission s Comprehensive Plan for the National Capital Long-range transportation and land use plans that specifically recommend implementing the Beltway improvements include the following: Fairfax County s Comprehensive Plan Fairfax County s Transportation Plan National Capital Region Transportation Planning Board s Update to the Financially Constrained Long-Range Transportation Plan for the National Capital Region. The Board is the designated Metropolitan Planning Organization responsible for coordinating planning and prioritizing transportation improvements in the metropolitan Washington region. Northern Virginia Transportation Coordinating Council s Northern Virginia 2020 Transportation Plan. The Council is an advisory group of locally elected officials from 13 northern Virginia jurisdictions and the Virginia General Assembly that serves as a caucus on recommending regional transportation priorities and funding allocations. 1-20
61 2 ALTERNATIVES A wide range of improvement alternatives was considered throughout the course of this project. The alternatives were identified and evaluated through an iterative screening process in cooperation with citizens, local and regional planning agencies, and a technical study team. Except for the No-Build Alternative, alternatives deemed not reasonably capable of meeting the identified needs or deemed too disruptive in comparison to the transportation benefit achieved were eliminated from further consideration. While required to be considered by National Environmental Policy Act regulations, the No-Build Alternative was also studied in detail because it illuminates the need for improvements and serves as a baseline for comparing the other alternatives. The range of alternatives considered in detail and carried forward to the Draft EIS included the No-Build (or no-action) Alternative and three Candidate Build Alternatives for expanding and reconfiguring the total number of lanes on the Beltway: the Concurrent HOV Alternative (10 through lanes), the Express/Local with HOV Alternative (10 through lanes), and the Barrier-Separated HOV Alternative (12 through lanes). Options for interchange configurations along the length of the mainline alternatives were also examined. Based on the comments received on the Draft EIS from the general public and local government, the three Candidate Build Alternatives, as well as the various interchange options, were reevaluated to identify possible cost savings and opportunities to reduce their environmental impacts. The goal of this review and refinement process was to develop alternatives that further minimized the footprint of the proposed Beltway but were still operationally balanced with the existing and planned transportation network that delivers traffic to and from the Beltway. As the majority of the impacts and right-of-way requirements were driven by interchange improvements, each interchange was reviewed to determine if the number and size of ramps and bridges could be reduced. The capacity of each of the intersecting roadways was reviewed and the ability to deliver or receive traffic identified. The size of the proposed interchange improvements was reduced as much as possible without undermining the effectiveness of the process, which resulted in a dramatic reduction in the size of the interchanges and right-of-way requirements. In addition, the required right-ofway for mainline improvements was reduced by minimizing shoulders and utilizing 2-1
62 Capital Beltway Study Chapter 2 painted buffer strips where barrier medians had been proposed before. Finally, each of the three revised Candidate Build Alternatives was re-evaluated for two different operational scenarios within the managed lanes: HOV (as originally proposed) and High Occupancy Toll (HOT) lane operations, resulting in six refined alternatives to be evaluated. Based on a multiple step review process that examined both the mainline and the interchange areas, two of the refined alternatives proved to be the most prudent and feasible and were chosen for further development and study. One alternative was developed from the Barrier-Separated (12 through lanes) Alternative presented in the Draft EIS. The Revised 12-Lane HOT / Managed Lanes Alternative achieves a significant reduction in total lane miles (and associated right-of-way requirements) along the entire corridor and reduces the size of the interchanges. Similarly, a Revised 10-Lane Concurrent HOV Alternative was also developed. These two Candidate Build Alternatives, along with the No-Build Alternative, were then assessed in more detail against a refined set of guidelines that better reflect the performance and impact criteria identified in the Purpose and Need as well as the public comments. Based on this assessment, the 12-Lane HOT / Managed Lanes Alternative was adopted by the Commonwealth Transportation Board (CTB) as the project s Preferred Alternative on January 20, The following chapter explains the alternatives development process; illustrates the Preferred Alternative; describes the conditions assumed with the No-Build Alternative; provides the results of the operational analysis of the alternatives; summarizes the costs and impacts associated with the Preferred Alternative and the other Candidate Build Alternatives considered throughout the EIS process; and identifies the alternatives eliminated from further consideration. Additional details on alternatives development are provided in the Draft EIS Alternatives Development Technical Report. 2.1 ALTERNATIVES DEVELOPMENT PROCESS Refinement of Strategies from Major Investment Study In January 1997, the findings of the Major Investment Study (MIS) for the Beltway project were summarized in the MIS Results Report: The Framework for Beltway Improvements. The MIS Results Report described the identification and evaluation of a number of approaches, or strategies, for achieving the following four primary goals with respect to the Beltway: Support regional mobility and address current and future congestion. Provide for increased safety and maximum operational efficiencies. Make best use of resources. Preserve capital investment. The report also identified the types of roadway improvements recommended for developing into specific alternatives for preliminary engineering and detailed 2-2
63 Alternatives Capital Beltway Study environmental review. Five of the twenty improvement strategies considered in the MIS were included in the recommended strategy package as follows: Add HOV lane(s) with direct access to HOV lanes on connecting roads. Add separated express lanes for long-distance trips. Renovate interchanges. Implement enhancements to facilitate traffic law enforcement, promote ridesharing, and provide better traveler information (e.g., ITS technologies). Plan for express bus transit service on the Beltway. An iterative process of translating these strategies into physical improvements involved detailed mapping of existing conditions, detailed definition and analysis of the needs for Beltway improvements that underlie the goals noted above, conceptual drawings, increasingly detailed preliminary design drawings of road and interchange configurations, and further consultations with the public and local and regional agencies Identification of Reasonable Alternatives for Further Study in the Draft EIS Translating the general MIS strategies into specific physical improvements involved a complex interplay between the identified transportation needs in the Beltway Corridor and engineering, traffic, and environmental considerations. Engineering considerations included geometric design standards for horizontal and vertical alignments, weave and merge distances for interchange ramps, vertical clearances for overpasses, widths of travel lanes and shoulders, barrier wall configurations, cut and fill slopes, stormwater and drainage elements, and cost. Traffic considerations included volumes, classifications (e.g., trucks and autos), speeds, entering and exiting movements, lane capacities, and maintenance of traffic during construction. Environmental considerations included potential effects on parks, schools, homes, businesses, air quality, noise levels, water quality, wetlands, visual quality, and vegetation Development and Definition of a Range of Possible Solutions Based on an understanding of the Beltway Corridor and the findings of the MIS, several general principles guided the definition of potential improvements. First, better management of the overall Beltway would be explored, which would entail organizing lanes by travel patterns or character (e.g., physically separating express/through traffic from local/short-trip traffic and distinguishing HOV lanes from general-purpose lanes). In addition, it would include eliminating bottlenecks that create congestion and reduce traffic throughput rates, and it would include informational (e.g., signing), enforcement, and accident response systems. Second, it would be necessary to establish the maximum amount of additional capacity needed to fully accommodate projected traffic volumes, as well as the amount that could reasonably be added before the level of community disruption would become unacceptable. Third, existing design features would need to be updated in accordance with current design standards. Fourth, direct access to the Beltway would have to be provided for HOV traffic. Future HOV occupancy requirements were assumed to be three (HOV-3 + ) to be consistent with regional transportation plans. 2-3
64 Capital Beltway Study Chapter 2 Improvements defined under these principles would provide the desired mobility and safety enhancements. These enhancements in turn would help to fulfill the Beltway's roles in the regional and local transportation systems, help reduce cut-through traffic on local and neighborhood streets, improve connectivity between major activity centers, support expanded availability of mass transit, and help maintain the transportation support necessary to the regional economy Maximum of 12 Lanes During the MIS Phase, it was determined that in order to provide sufficient capacity for the future travel demand, 14 or more lanes would be required for the mainline of the Beltway. However, to build 14 lanes or more, it would be necessary to acquire a significant amount of additional right-of-way to accommodate the lanes, drastically changing the existing character of the corridor, which would be unacceptable. Thus, the maximum number of lanes was set at 12 in order to minimize the environmental impacts of the Beltway widening. There are several different ways to add lanes and reconfigure the existing Beltway, improve the design and traffic operations of interchanges, and provide direct access for HOV traffic and express buses. Various conceptual designs were developed for each of these three major elements for public review and technical evaluation (screening). Table 2-1 summarizes the factors considered in developing the three-part improvement concepts. Table 2-1 FACTORS CONSIDERED IN THE DEVELOPMENT OF ALTERNATIVES Roadway Configurations Interchange Improvements Direct HOV Access Type of Lanes and Lane Configuration (Layout) Total Number of Lanes Traffic Operations and Safety Environmental and Community Concerns Travel Patterns and Interchange Capacity Connections with Intersecting Roadways Compatibility with Roadway Modifications Safety Enhancements Environmental and Community Concerns Interchange Locations for Direct HOV Ramps HOV/Express Bus to General- Purpose Lane Connections Express to Local Lane Connections Environmental and Community Concerns Roadway Configurations. There are numerous options to reconfigure (or organize) the number and type of lanes making up the Beltway mainline. VDOT, in conjunction with the Beltway Study Team, developed the following assumptions to guide the development of possible configurations so as to meet the operational and safety needs identified, as well as minimize disruption to neighboring communities: Alternatives considered will not reduce the number of existing generalpurpose lanes on the Beltway. Alternatives considered will not have more than six mainline lanes in any direction. 2-4
65 Alternatives Capital Beltway Study Alternatives considered will not have more than five undivided mainline lanes in direction. HOV and/or express lanes will be located in the interior of the roadway. Alternatives considered will not include more than one concurrent HOV lane due to concerns about excess weaving/merging and the safety of traffic operations. Ten-lane HOV alternatives will have a maximum of one HOV lane in each direction; similarly, 12-lane HOV alternatives will have a maximum of two HOV lanes in each direction. Direct HOV access will be provided at each crossing roadway with existing or planned HOV facilities. Express/local roadway alternatives considered will have at least two express lanes in each direction. Express/local roadway alternatives will use one or two of the HOV lanes as a concurrent HOV lane during peak periods. Alternatives in Virginia will be designed to ensure total connectivity with the proposed Beltway improvements in Maryland. Four different roadway configurations were found to meet these criteria and are described below. Concurrent HOV - One concurrent HOV lane would be added to the Beltway in each direction. No additional general-purpose lanes would be constructed. The Beltway would have a total of 10 lanes under this option. Barrier-Separated - The Beltway would be reconfigured to separate generalpurpose and HOV traffic. One or two HOV lanes, separated from the other lanes by a concrete barrier and shoulders, would be built in each direction. Access to these HOV lanes would be provided at selected interchanges and at various points along the Beltway. No additional general-purpose lanes would be constructed. Under this scenario, the Beltway would have 10 or 12 lanes. Express/Local - This roadway configuration would separate the Beltway's shortand long-distance trips. One additional general-purpose lane would be constructed in each direction. The "express" lanes (for longer trips) would be separated from the other lanes by a concrete barrier and shoulders. Access to these lanes would be provided at select interchanges and at various points along the Beltway. With this improvement, the Beltway would have 10 lanes. Express/Local with HOV - This mainline configuration would also separate short- and long-distance trips. One or two HOV lanes, concurrent with the express lanes, would be constructed in each direction. As with the other Express/Local option, the "express" lanes would be separated from the local lanes by a concrete barrier and shoulders. Access would be provided at select interchanges and at various points along the Beltway. The HOV lanes 2-5
66 Capital Beltway Study Chapter 2 could be used as express bus lanes during non-peak hours. Under this option, the Beltway would have 10 or 12 lanes. Based on these four configuration options, 14 mainline alternatives were initially developed. Table 2-2 summarizes these alternatives and shows which were carried forward for detailed evaluation in the Draft EIS. Table 2-2 MAINLINE IMPROVEMENT CONCEPTS IN THE DRAFT EIS Mainline Concepts Considered Number of Through Lanes Lane Configuration Concurrent HOV Barrier-Separated HOV Express/Local Express/Local with HOV Interchange Options. The 14-mile segment of the Beltway between the Springfield Interchange and the American Legion Bridge provides connections to a major interstate highway (I-66), limited access highways (Dulles Access/Toll Road and George Washington Memorial Parkway), and local primary roads via 10 interchanges. Modifications to these interchanges and intersecting roadways would be needed to accommodate and enhance the proposed Beltway improvements. For each interchange, existing conditions were analyzed and various ways to improve traffic operations and safety were developed. In most cases, the proposed interchange types are similar to the existing types and all movements are retained. In some locations, however, such as the Little River Turnpike, two very different interchange types were developed (i.e., cloverleaf vs. diamond design). Table 2-3 shows the 44 interchange options initially identified in the Draft EIS. Details of each interchange are presented in the Draft EIS Alternatives Development Technical Report. Direct HOV Access. Direct access to the proposed HOV lanes via dedicated ramps was included in the improvement concepts for all interchanges that connect to existing (or planned) HOV roadways in the project area: Braddock Road, Interstate 66, and the Dulles Access/Toll Road. HOV access was also included in each of the improvement concepts for the Chain Bridge Road interchange to improve access to the Tysons Corner area. In addition, improvement concepts for HOV access at Lee Highway (Route 29) to serve the Merrifield area were developed. 2-6
67 Alternatives Capital Beltway Study Table 2-3 INTERCHANGE IMPROVEMENT CONCEPTS IN THE DRAFT EIS Interchange Concepts Considered A Cloverleaf with Center HOV B Cloverleaf with Center HOV Braddock Road (Route 620) C Cloverleaf with Reversible HOV D Cloverleaf with Directional HOV E Partial Cloverleaf with Center HOV A Partial Cloverleaf with Directional Ramps B Partial Cloverleaf C Single Point Diamond Little River Turnpike (Route 236) D Cloverleaf with Directional Ramps E Improved Cloverleaf F Partial Cloverleaf with Directional Ramps G Three-Level Urban Diamond A Improved Partial Diamond Gallows Road (Route 650) B Partial Clover/Partial Diamond C Full Diamond Arlington Boulevard (Route 50) A Improved Full Cloverleaf A Directional with Full Movements* B Directional with Full Movements* C Directional with Partial SOV Movements Interstate 66 D Directional with Partial SOV Movements E Directional with Full Movements F Directional with Full Movements G Directional with Full Movements A Directional B Directional Leesburg Pike (Route 7) C Directional D Directional E Partial Cloverleaf A Partial Cloverleaf B Partial Cloverleaf C Partial Cloverleaf D Partial Cloverleaf Chain Bridge Road (Route 123) E Partial Cloverleaf F Partial Cloverleaf G Partial Cloverleaf H Mainline Shift A Directional B Directional Dulles Access/Toll Road (Route267) C Directional D Directional E Directional A Diamond Georgetown Pike (Route 193) B Partial Cloverleaf George Washington Memorial Parkway A Trumpet *Concept A applies only to the Concurrent HOV [5-5] mainline; Concept B is identical in design and applies to all other mainline alternatives. 2-7
68 Capital Beltway Study Chapter Screening of Improvement Concepts Following the development and refinement of various improvement concepts, a three-level screening process was used to identify the best-performing concepts, which could then be evaluated in greater detail. Preliminary screening determined whether the concepts would meet the project s purpose and need and fulfill basic safety and operational requirements. Concepts that could not be modified to meet these objectives were eliminated from further consideration. Next, the remaining concepts were refined and evaluated for engineering feasibility and general environmental impacts. Concepts that would be difficult to construct while maintaining traffic operations on the Beltway, as well as concepts with environmental consequences disproportionate to the benefits provided, were dropped. In some cases, similar improvement concepts were consolidated and carried forward. Finally, each remaining concept was tested to ensure that the proposed designs could safely accommodate projected traffic volumes. Poorly performing or operationally deficient concepts were dropped from further consideration. The criteria considered at each level of the screening process are summarized in Table 2-4. Table 2-4 CRITERIA USED IN SCREENING ALTERNATIVES IN THE DRAFT EIS Level 1 Preliminary Criteria Consistent with Planning Assumptions? Meets Purpose and Need? Improves General Performance, Operations, and Safety? Complies with Design and Safety Standards? Level 2 Environmental & Engineering Criteria Feasible to Construct? Able to Maintain Traffic Operations During Construction? Disproportionate Environmental Impacts? Similar to Other Improvement Concepts? Level 3 Traffic & Operations Criteria Improves Mobility and Reduces Congestion? Compatible with Other Planned Improvements? Enhances Interchange Operation and Safety? Improves Mainline Operation and Safety? Preliminary Engineering of Candidate Build Alternatives Concepts remaining at the end of the screening process were combined into complete end-to-end improvement alternatives consisting of (1) a specific lane configuration (e.g., concurrent HOV), (2) improvements for each interchange, and (3) new direct access points for HOV traffic. The end-to-end alternatives were evaluated to ensure that each could be constructed and operated safely for the entire 14-mile segment between the I-95/I-395/I- 495 interchange and the American Legion Bridge. For some interchanges, multiple concepts were viable; so more than one improvement option was retained for detailed evaluation in the Draft EIS. As a result of this process, three mainline Candidate Build Alternatives were considered in the Draft EIS: Concurrent HOV (10 through lanes), Express/Local with HOV (10 through lanes), and Barrier-Separated HOV (12 through lanes). For some of the interchanges, more than one interchange option was carried forward for further study. In addition, direct access points for HOV traffic to the HOV lanes were identified. Over the course of the next two years, these Candidate Build Alternatives were further developed and evaluated. Detailed environmental assessments were conducted for each and the results were documented in the Draft EIS issued in March
69 Alternatives Capital Beltway Study Coordination with Agencies, Local Officials, and the General Public. The development of the Candidate Build Alternatives evaluated in the Draft EIS was coordinated with federal, state, and local agencies, citizens, interest groups, civic organizations, and businesses. VDOT encouraged agency and public participation in the study process. Each level of the screening process concluded with a presentation of the preliminary concepts and/or alternatives to the Beltway Study Team. The Beltway Study Team consisted of representatives from the area's transportation agencies, including VDOT, FHWA, Virginia Department of Rail and Public Transportation (DRPT), Fairfax County Department of Transportation, Metropolitan Washington Council of Governments, Northern Virginia Transportation Commission, and the Washington Metropolitan Area Transit Authority (WMATA). The Maryland State Highway Administration also participated in Study Team meetings. This multi-agency group provided comments and recommendations throughout the course of developing and evaluating alternatives. All decisions made by the Study Team were documented in formal Decision Chronicles. These decision documents are included in the Draft EIS Alternatives Development Technical Report. The results of the alternatives development process were also presented to the general public in the form of individual group meetings, as well as two public workshops. Details of these meetings are presented in Chapter Refinement of Alternatives Based on Comments on the Draft EIS After the publication of the Draft EIS, three public hearings were held in May 2002 to elicit comments from citizens, local agencies, and organizations on the document and the Candidate Build Alternatives considered and their environmental effects. Although each of the Candidate Build Alternatives studied in the Draft EIS satisfied the purpose and need for improvements, comments from the general public and local government suggested that the cost and environmental impacts associated with these alternatives were too high and that a better balance of operational benefits versus negative environmental consequences be achieved. In response, the guidelines for developing alternatives were revised to better reflect operational performance and impacts. Minimize to the extent possible the total footprint while providing sufficient capacity to achieve LOS D during non-peak periods. Provide additional capacity using managed lanes. Avoid to the extent possible queuing that extends upstream (back onto) the arterial street system, as it has the potential to increase cut-through traffic in residential neighborhoods. Provide to the extent possible direct or preferential access to managed lanes for transit, HOV, and tolled vehicles within the right-of-way, particularly when connecting to other facilities with existing or planned HOV or managed lanes. Provide predictable and reliable travel times for transit, HOV, and tolled vehicles. 2-9
70 Capital Beltway Study Chapter 2 Provide maximum flexibility in terms of operating or pricing strategies that could be implemented. Allow for the enforcement of the adopted operating strategies and policies. Provide adequate transition distance to meet the Maryland portion of the Capital Beltway safely. Each of the build alternatives was scaled back significantly to lessen both costs and impacts on the surrounding community. The most significant reduction in impacts was found in residential displacements. Whereas the original Candidate Build Alternatives could potentially displace between 206 and 294 residences, the scaled back alternatives are estimated to only displace 3 or less residences. Right-of-way requirements for each of the alternatives were reduced by minimizing shoulders and replacing physical barriers with painted strips, as well as by reducing improvements to interchanges. For instance, the typical cross-section for the original 12- Lane Barrier-Separated HOV Alternative was 226 feet wide; however, with the revised shoulders and barrier modifications the width was reduced to approximately 202 feet. The most notable reductions in right-of-way requirements, however, involved minimizing improvements to interchanges. All of the interchange improvements evaluated in detail in the Draft EIS were revisited and sized to balance with the intersecting roadways and access to the managed lanes was limited to locations where the additional ramps could be incorporated with minimal right-of-way requirements. In addition, potential design exceptions were considered at each of the interchanges to further reduce impacts. Examples included slight reductions in the radius and design speeds for loop ramps and shortening of auxiliary lanes. In every case, however, the proposed designs still represented an improvement over existing conditions. Following these refinements, a Preferred Concept for each interchange was selected. These preferred interchange concepts are detailed in Section below. In addition to the design modifications to the proposed mainline and interchange improvements, each of the three Candidate Build Alternatives was also evaluated to assess the potential for the implementation of High Occupancy Toll (HOT) lane operations. This new operational scenario was the result of an unsolicited Public Private Transportation Act (PPTA) proposal that was submitted after the publication of the Draft EIS. The proposal recommended the use of HOT lanes on the Beltway. As a result of these design revisions and operational modifications, six revised alternatives were developed: the three original mainline concepts, both with and without HOT lanes (see Table 2-5). Revenue studies and pricing were not evaluated as part of this assessment -- such studies will be conducted by the PPTA proponent. Instead, the potential market and available capacity were assessed based on origin-destination patterns and the ability to provide access to and from the managed HOT lanes. The six revised alternatives were subjected to the same level of screening that was used in the evaluation of previous alternatives (see Table 2-4) plus the operational aspects of managed HOT lanes. After a series of lane-balancing evaluations, it was determined that there would not be enough high occupancy vehicles to require two HOV lanes in each direction. Conversely, the same evaluations revealed that two HOT lanes in 2-10
71 Alternatives Capital Beltway Study each direction would be necessary to accommodate the projected combined use of high occupancy and tolled vehicles. Based on these screening evaluations, two alternatives were identified as the most promising and were further evaluated: the Revised 10-Lane Concurrent HOV Alternative and the Revised 12-Lane HOT / Managed Lanes Alternative. Table 2-5 REVISED MAINLINE IMPROVEMENT CONCEPTS Concept HOV Managed Lanes HOT Managed Lanes Number of Through Lanes Lane Configuration Detailed Evaluation Preferred Alternative The two revised alternatives were presented at two public information meetings in June More than 360 citizens attended the meetings. Attendees were able to review the engineering plans of the revised alternatives, as well as information regarding traffic operations, tolls, environmental impacts, and project costs. The revised alternatives reflected many of the comments issued by the general public in previous meetings and overall were received in a positive manner. Based on the written comments received, approximately 59 percent of commentors preferred the 12-Lane HOT / Managed Lanes Alternative. 2.2 PREFERRED ALTERNATIVE Based on input received at the June 2004 public information meetings, as well as additional analysis and agency input, the 12-Lane HOT / Managed Lanes Alternative was adopted by the Commonwealth Transportation Board (CTB) as the project s Preferred Alternative on January 20, This alternative would add two managed HOT lanes to the Capital Beltway in each direction and modify, improve, and reconfigure the interchanges to increase capacity, reduce congestion, and improve safety. The details of the proposed mainline configuration and interchange improvements included in this alternative are described in the following sections. Figure 2-1 illustrates two typical sections of the Preferred Alternative. The top drawing shows what a typical mainline section will look like in segments where there are no ramps or auxiliary roadways. This typical section will be approximately 202 feet wide. The lower drawing depicts a typical section for those segments which include adjoining Collector-distributor (C-D) roadways -- similar to those that exist today between Gallows Road and Route 50. These segments could be as much as 40 feet wider depending on the number of CD or auxiliary lanes. Figure 2-2 provides plan drawings for the entire fourteen miles of the Preferred Alternative. These plans, shown on aerial photography, illustrate the various improvements in relation to the existing Beltway and its surroundings, and they also indicate the existing and proposed right-of-way lines. The reviewer is encouraged to reference these plans while reading the following text description. 2-11

72 Capital Beltway Study Chapter Lane HOT / Managed Lanes Alternative The 12-Lane HOT / Managed Lanes Alternative is similar in design to the 12-Lane Barrier Separated HOV Alternative evaluated in the Draft EIS. Under this alternative, the Beltway would have a total of 12 through lanes: four general-purpose lanes and two HOT lanes in each direction, i.e., a configuration. The two far left lanes (in each direction) would be designated as HOT lanes and separated from the general-purpose lanes with a 4- foot buffer strip. The HOT lanes would be used by high occupancy vehicles (HOV-3 + ), buses, and tolled low occupancy vehicles carrying less than three occupants. The main advantage of this roadway type is the capacity it provides for both HOV and HOT traffic, thereby encouraging car-pooling and bus ridership by facilitating movement throughout the HOV/HOT roadway network. Accordingly, the HOT lanes would have direct access/egress to the existing and anticipated HOV facilities at three interchanges: Braddock Road, I-66, and the Dulles Access/Toll Road, as well as at the Route 123 interchange to improve access to Tysons Corner and partial HOT access to and from the south at Lee Highway (Route 29) to improve access to Merrifield. Based on the projected number of lane changes and the speed differential between the managed HOT lanes and the general-purpose lanes, it was determined that access and egress to the HOT lanes by simply changing lanes could not be provided safely and without undermining the reliability of the HOT lanes. 2-12
73 Alternatives Capital Beltway Study 2-13
74 Capital Beltway Study Chapter
75 Alternatives Capital Beltway Study 2-15
76 Capital Beltway Study Chapter
77 Alternatives Capital Beltway Study 2-17
78 Capital Beltway Study Chapter
79 Alternatives Capital Beltway Study 2-19
80 Capital Beltway Study Chapter
81 Alternatives Capital Beltway Study 2-21
82 Capital Beltway Study Chapter 2 Collector-distributor (C-D) roadways would be barrier-separated from the mainline roadways at interchanges and also between closely-spaced interchanges to minimize movement conflicts and to improve safety and traffic operations. Continuous C-D roadways would be provided in both directions between Gallows Road and Route 50. There is also an existing C-D road at Route 7 and along the northern portion of the Dulles Access/Toll Road. Generally, connection to interchanges would be made via the C-D roadways; however, direct access/egress would also be provided from the main roadways at selected interchanges. The locations where direct access/egress would occur are southbound at Gallows Road, I-66 (both directions), Route 123 (both directions), and Georgetown Pike. Northbound traffic at Gallows Road would have direct access, but egress onto a C-D road. The Dulles Access/Toll Road would have direct access northbound but egress onto a C-D road, while southbound traffic at the Dulles Access/Toll Road would have direct egress, with access via a C-D road. Left exits and entrances for non-hov/ HOT traffic, from the mainline and the C-D roadways, would be eliminated. The existing left exits and entrances would be retained to serve HOV/HOT traffic only. At the northern end of the project segment, the 12-lane roadway configuration would transition to match the roadway cross-section prior to the George Washington Memorial Parkway interchange. The required transition in the I-495 mainline cross-section would begin after the Dulles Access/Toll Road. The improvements to the southbound I-495 roadways would also begin south of the George Washington Memorial Parkway. Similarly, at the southern end of the project segment, the I-495 mainline cross-section would tie into the I-95/I-395/I-495 interchange improvements immediately north of the Beltway bridge crossing over the Norfolk Southern Railway. At this location, the Beltway would have a 12-lane cross-section. Most of the recommended improvements would be accommodated within the existing rightof-way. Additional right-of-way would be necessary at only at a few locations and the total number of residential displacements would be reduced from as many as 294 down to three. Under the Preferred Alternative the following improvements would serve to reduce traffic congestion and enhance traffic operation and safety: Addition of capacity by adding four lanes to the Beltway. Replacement of left exit and entrance ramps for general traffic with right exit and entrance ramps; this improvement would eliminate multi-lane weaving and improve traffic safety and operation. Replacement or improvements of existing loop ramps that have radii smaller than the minimum. Modification to interchange configurations to reduce traffic congestion by eliminating the weaving movements at the Braddock Road, Little River Turnpike, and Chain Bridge Road interchanges. For instance, traffic weaving movements at the Chain Bridge Road interchange would be eliminated through the use of a flyover ramp southbound and the replacement of a loop ramp with left turn lanes for northbound traffic. 2-22
83 Alternatives Capital Beltway Study Interchange Improvements As discussed above, the interchange improvements that were evaluated in the Draft EIS were revised in an effort to minimize the impact of the project on the surrounding environment. A Preferred Concept was selected for each interchange as part of the complete 14-mile Preferred Alternative. The Preferred Concepts for each interchange are listed in Table 2-6 and described below. The details for each interchange are shown on the project plans in Figure 2-2. Table 2-6 INTERCHANGE CONCEPTS PREFERRED ALTERNATIVE Interchange Braddock Road Little River Turnpike Gallows Road Arlington Boulevard Interstate 66 Leesburg Pike Chain Bridge Road Dulles Access/Toll Road Georgetown Pike Interchange Concepts Considered for Inclusion in Preferred Alternative* E Partial Cloverleaf with Center HOV Revised E Partial Cloverleaf with Center HOV B Partial Cloverleaf ( Option 2 ) Revised D Cloverleaf with Directional Ramps ( Option 1 ) E Improved Cloverleaf Revised A Improved Partial Diamond with No Improvements to westbound Gallows Road Auxiliary Lane Revised A, Option 1 Improved Partial Diamond with Improvements at Woodburn Road ( Option 1 ) C Full Diamond A Improved Full Cloverleaf A Directional with Full Movements B Directional with Full Movements C Directional with Partial SOV Movements E Directional with Full Movements Modifications to Existing Interchange B Directional Modifications to Existing Full Cloverleaf Interchange C Partial Cloverleaf Revised C Partial Cloverleaf with Modified Loop Ramp in Southwest Quadrant Option 1 Partial Cloverleaf with Flyover Ramp and Modified Loop Ramp in Southwest Quadrant Option 2 Partial Cloverleaf with Flyover Ramp B Directional E Directional Modifications to Existing Interchange A Diamond Revised A Diamond Preferred Concept Revised E Partial Cloverleaf with Center HOV E Improved Cloverleaf Revised A Improved Partial Diamond with No Improvements to westbound Gallows Road Auxiliary Lane A Improved Full Cloverleaf Modifications to Existing Interchange Modifications to Existing Full Cloverleaf Interchange Revised C Partial Cloverleaf with Modified Loop Ramp in Southwest Quadrant Modifications to Existing Interchange Revised A Diamond GW Parkway None None *Note: Includes all interchange options carried forward for detailed evaluation in the Draft EIS, as well as those developed after publication of the Draft EIS in an effort to minimize the impacts of the proposed improvements. Interchange options that are the same as those developed during initial screening are called by same name as in Table 2-3. If an alternative was referred to by a different name during preferred concept selection, that name is given in parentheses. 2-23
84 Capital Beltway Study Chapter Braddock Road Braddock Road (Route 620) has eight lanes immediately west of the Beltway and four lanes on the east. Because HOV lanes are planned for Braddock Road between the Beltway and Burke Lake Road in the Fairfax County Comprehensive Plan, any improvements to the interchange would need to incorporate additional ramps to provide direct Beltway access for HOV/HOT traffic. Although Interchange Concept E, a partial cloverleaf, was carried forward for detailed evaluation in the Draft EIS, the Preferred Concept selected for inclusion in the Preferred Alternative was revised somewhat to lessen the impact of the proposed interchange improvements on the surrounding community. The Preferred Concept would involve a partial cloverleaf with center access for HOT/HOV traffic. To eliminate the troublesome weave on the collector-distributor roadway along northbound I-495, the existing loop ramp connecting westbound Braddock Road to northbound I-495 would be removed. This movement would be replaced with a left turn lane that connects to the proposed eastbound Braddock Road to northbound I-495 ramp. A traffic signal would be required at this location. The other loop ramps at this interchange would be aligned to meet the widened I-495 and improve the overall configuration where possible. To provide direct access to and from the HOT/HOV lanes on the Beltway at Braddock Road, access ramps would be provided. Center-access lanes were selected because they could work with HOV lanes on either the inside or outside shoulder of Braddock Road, and to ensure that HOV/HOT traffic has access to and from the Ravensworth Industrial Park. Traffic signalization would be required for these movements Little River Turnpike Little River Turnpike (Route 236) has four lanes west of the Beltway and six lanes to the east. Although Interchange Concept B was carried forward for detailed evaluation in the Draft EIS, the Preferred Concept selected for inclusion in the Preferred Alternative is Concept E, which had been considered and dropped prior to publication of the Draft EIS. This interchange concept was revisited in an effort to minimize the impacts of interchange improvements at Little River Turnpike on the surrounding community. The Preferred Concept would retain the existing full cloverleaf configuration. The ramps for this interchange would require some realignment to tie into the new Beltway configuration and to meet minimum design standards; otherwise, the interchange would be similar to the existing Little River Turnpike interchange Gallows Road Gallows Road (Route 650) is a four- to six-lane secondary road that connects Annandale and Tysons Corner. This road also serves as a parallel alternate route for north-south Beltway traffic between the Gallows Road/I-495 interchange and Leesburg Pike. Two interchange options were carried forward for detailed evaluation in the Draft EIS: Concept A, an improved partial diamond interchange involving minor modifications to the existing configuration, and Concept C, a full diamond interchange. A revised version of Concept A was selected as the Preferred Concept for inclusion in the Preferred Alternative. 2-24
85 Alternatives Capital Beltway Study Revised Concept A would contain a half diamond interchange with a single cloverleaf quadrant. This design is similar to the existing interchange configuration; however, the alignment of the ramps is modified to improve the geometric features and the connections to I-495. This concept would also require realignment of portions of Luttrell Road, and the horizontal alignment of Gallows Road would be modified to match the existing alignment. Three residences along Luttrell Road would be potentially displaced under this preferred concept. Unlike the original Concept A design evaluated in the Draft EIS, Revised Concept A would not involve any improvements to the short auxiliary lane that currently provides right turn access for westbound Gallows Road to northbound I-495. The original Concept A extended this auxiliary lane to improve traffic flow and allow for profile improvements along Gallows Road, which resulted in impacts to the Holmes Run Acres neighborhood, a historic district. Under the Preferred Concept, the extension of the auxiliary lane and Gallows Road profile improvements are removed in order to eliminate these impacts Arlington Boulevard Arlington Boulevard (U.S. 50) is a four-lane divided roadway. Interchange Concept A, which was carried forward for detailed evaluation in the Draft EIS, was selected as the Preferred Concept for inclusion in the Preferred Alternative. Concept A would consist of minor modifications to the existing interchange layout, with the realignment of the ramps at the Beltway. However, the profile of the Beltway would have to be raised, with its bridges over Route 50 rebuilt, to provide for the necessary vertical clearance. In addition, portions of the existing ramps at the Beltway would have to be realigned Interstate 66 Interstate 66 (I-66) runs east-west between Washington, D.C. and the Shenandoah Valley, where it connects with I-81. To the west, between the Beltway and U.S. 50, I-66 is six lanes and expands to eight lanes between U.S. 50 and Business Route 234. East of the Beltway, I-66 transitions to a four lane roadway through Arlington County to the Roosevelt Bridge and the District of Columbia with several extended acceleration/deceleration lanes. At this time, I-66 includes concurrent HOV lanes during the peak periods and this study assumes I-66 will be designed with reversible HOV lanes west of the Beltway in the future. However, this assumption is not currently a part of the Constrained Long-Range Plan. Four interchange concepts (A, B, C and E) were carried forward for detailed evaluation in the Draft EIS. However, in an effort to reduce the impacts of the proposed interchange improvements on the surrounding community, these concepts were eliminated, and a Preferred Concept similar to the existing interchange was selected. The Preferred Concept would provide all of the existing movements of traffic between the two interstate highways, but would not add the two movements that are not currently allowed: southbound I-495 to eastbound I-66 and westbound I-66 to northbound I-495. The design would also provide access to and from the HOV/HOT lanes, except for westbound I-66 traffic to northbound I-495 HOV/HOT lanes and southbound I-495 HOV/HOT traffic to eastbound I-66. The configuration is similar to the existing interchange with a few revisions to improve connections to the HOV/HOT lanes and 2-25
86 Capital Beltway Study Chapter 2 improve the alignments of ramps where possible. The existing loop ramp in the northeast quadrant from northbound I-495 to westbound I-66 would be replaced with a flyover ramp. Other ramps would be shifted and in some cases split to provide access to both generalpurpose and HOV/HOT lanes; otherwise, the proposed concept is similar to existing conditions. The existing Metrorail bridge for the Orange Line would not be affected by these improvements Leesburg Pike Leesburg Pike (Route 7) is the main route between Tysons Corner and Falls Church. Inside the Beltway, it is primarily four lanes wide, and outside the Beltway, it ranges from four to eight lanes. Concept B, a directional interchange, was carried forward for detailed evaluation in the Draft EIS. However, based on public and agency comments on the Draft EIS, the proposed improvements to the Leesburg Pike interchange were scaled back, resulting in a Preferred Concept very similar to the existing interchange. The Preferred Concept selected for inclusion in the Preferred Alternative would be a full cloverleaf matching the configuration of the existing interchange, with minor modifications. Loops and ramps would be modified to tie-in to the widened I-495, and Leesburg Pike would be shifted slightly to the north to allow for maintenance of traffic during construction of the new bridge over I Chain Bridge Road Chain Bridge Road (Route 123), known as Dolley Madison Boulevard east of the Beltway, is a primary arterial running from Washington, D.C. (via the Chain Bridge crossing) through McLean, Tysons Corner, Vienna, and south into Fairfax County and Prince William County. Route 123 is primarily a four-lane roadway that runs north-south and parallel to the Beltway in the middle of Fairfax County. It has several names depending on its location, including Chain Bridge Road, Dolley Madison Boulevard, Maple Avenue, and Ox Road. Proposed modifications to this interchange were coordinated closely with DRPT and WMATA to ensure that the changes would not preclude construction of the proposed extension of Metrorail service to Tysons Corner and Dulles Airport. Although Concept C was carried forward for detailed evaluation in the Draft EIS, a new Preferred Concept was developed to reduce the impact of improvements to the Chain Bridge Road interchange on the surrounding community. The Preferred Concept is a partial cloverleaf interchange that would be compatible with the proposed Metrorail extension through the interchange. To help alleviate weave traffic along northbound I-495, the existing loop ramp in the northeast quadrant would be replaced with left turn lanes coming off the ramp from northbound I-495 to eastbound Route 123. To alleviate the weave traffic along southbound I-495, access to the loop ramp from southbound I-495 to eastbound Route 123 would be moved back to the same location as the southbound I-495 to westbound Route 123 ramp. The ramp from southbound I-495 to eastbound Route 123 would pass over the loop ramp in the northwest quadrant, as well as passing over Route 123 before tying into the existing loop. Direct access to and from HOT lanes on I-495 at Route 123 would be provided by center access depressed ramps. These ramps would provide for the movement of HOV/HOT 2-26
87 Alternatives Capital Beltway Study traffic in all directions to and from Route 123. They would connect to Route 123 in the middle of the interchange where I-495 crosses over Route 123. A traffic signal would be required at this location to allow for orderly turning movements to and from the Beltway Dulles Access/Toll Road The Dulles Access/Toll Road (Route 267) is comprised of two separate roadways within a shared right-of-way. The Dulles Airport Access Road consists of four lanes (two lanes in each direction) and provides uninterrupted access to Washington Dulles International Airport from the Beltway. The Dulles Toll Road is an eight-lane toll facility that serves northwestern Fairfax County. Slip ramps between the Toll Road and the Access Road are located along the facility (three eastbound, four westbound) to provide non-toll access for airport users. The Dulles Toll Road has a peak period, peak direction (eastbound in the morning, westbound in the evening) concurrent HOV lane. Beyond the Capital Beltway interchange, the Dulles Toll Road extends east to connect directly to I-66. On the western end, it connects to the Dulles Greenway, a private toll road extension that extends into Loudoun County. Two concepts were carried forward for detailed evaluation in the Draft EIS. However, both concepts were later eliminated in favor of a Preferred Concept that would lessen the impact of improvements to the interchange on the surrounding community. Under the Preferred Concept, the general configuration of the interchange in terms of traffic movements would remain essentially unchanged. The two movements currently missing northbound I-495 to eastbound Route 267 and westbound Route 267 to southbound I-495 would still be omitted for both HOV/HOT and general-purpose traffic. In the direction of northbound I- 495, HOV/HOT traffic would utilize a left exit to westbound Route 267, while generalpurpose traffic would utilize a right exit to westbound Route 267. In the southbound direction of I-495, HOV/HOT traffic would utilize a left exit to access both eastbound and westbound Route 267, and general-purpose traffic would utilize a right exit to access both eastbound and westbound Route 267. Access for eastbound Route 267 traffic would be provided for both northbound and southbound I-495 HOV/HOT and general-purpose lanes via a right exit off of Route 267. Eastbound Route 267 would access northbound I-495 general-purpose lanes only via the existing ramp in the northeast quadrant Georgetown Pike Georgetown Pike (Route 193) is a primary arterial that largely serves single-family residential areas and provides access to the Central Intelligence Agency/Federal Highway Administration Complex in Langley. Designated a Virginia Scenic Byway, Georgetown Pike begins at Route 123 in McLean inside the Beltway and extends west toward Great Falls in Fairfax County. The Preferred Concept is an improved diamond interchange that would involve minor improvements to the existing Georgetown Pike interchange. Unlike Concept A, which was carried forward for detailed evaluation in the Draft EIS, the Preferred Concept would tie directly into the existing ramps without modifications to the existing overpass bridge or widening of the existing ramps. 2-27
88 Capital Beltway Study Chapter George Washington Memorial Parkway The George Washington Memorial Parkway begins at the Beltway near Great Falls and travels southeast along the Potomac River through McLean, Arlington and Alexandria to Mount Vernon into southeast Fairfax County. It serves as a commuter route during the peak periods for traffic from both Virginia and Maryland to the District of Columbia. Throughout the day is serves as a convenient route connecting Arlington and Alexandria to Maryland. Concept A, an improved trumpet configuration, was evaluated in the Draft EIS. However, under the revised designs for the Preferred Alternative, no changes or improvements are proposed for the Parkway interchange HOV/HOT Direct Access Points As described in the above discussion of interchange improvements included in the Preferred Alternative, new direct access points for HOV/HOT traffic are incorporated into the interchange designs at Braddock Road, I-66, Chain Bridge Road, and the Dulles Access/Toll Road. In addition to these interchanges, partial HOV/HOT access would also be provided at the Lee Highway (Route 29) crossing of the Beltway. This access would involve two center access ramps for HOV/HOT traffic only: one from the northbound I-495 HOT lanes to Lee Highway in either direction, and one from Lee Highway in either direction to the southbound I-495 HOT lanes. There would be no HOV/HOT access from southbound I- 495 or to northbound I-495, nor any access for non-hov/hot traffic. A traffic signal would be required on Lee Highway at this location Design Exceptions Preliminary designs for the mainline segments and each of the ten interchanges were developed in accordance with the criteria set forth in AASHTO s A Policy on Geometric Design of Highway and Street (2001) and VDOT s Road Design Manual (Revised July 2005). As noted previously in Section 2.1.3, some potential design exceptions were incorporated to further reduce right-of-way requirements and thereby further reduce impacts to parks, residential areas and Metro s Orange Line. The majority of the proposed design exceptions involved reducing the radius of interchange loop ramps and resulted in reductions in design speeds. In no instance was the design speed reduced more than 5 mph. And in every instance the proposed design showed improvement over existing conditions. Details of each of the potential design exceptions are presented in Appendix D. Design exceptions used in the conceptual design have not been approved by FHWA. Consequently, VDOT will need to submit a formal design exception request to FHWA before any design exceptions can be incorporated into the final design plans Construction Costs Cost estimates for each of the Candidate Build Alternatives, including the Preferred Alternative, were based on quantity estimates developed from the conceptual designs for each alternative and utilized current unit costs from bid estimates from VDOT s Springfield Interchange project (which was under construction at the time the estimates were prepared). Quantities and costs were separated into four categories: Pavement, Bridge, Retaining Walls and Earthwork. 2-28
89 Alternatives Capital Beltway Study The cost estimate for each alternative was computed by multiplying the appropriate quantities by the unit costs developed from the bid estimates. A total cost for each concept was calculated by first adding the cost of each of the four items and then to apply appropriate contingencies. The costs and contingencies were verified based on the costs being experienced at the Springfield Interchange project. Cost developed for each of the build alternatives in the Draft EIS were based on Year 2002 dollars. To ensure an equivalent comparison, the same dollar units were used for the revised alternatives developed in 2004 and contained in the Final EIS. This use of comparable cost units allowed for a fair, equitable comparison of the build alternatives. Therefore all construction costs reported in the Draft EIS and this Final EIS for comparison purposes utilized the same base year dollars (2002). The construction costs for the Preferred Alternative are estimated at $891 million. Right-ofway costs are estimated to be $7.6 million. At the direction of the FHWA, the cost estimate for the Preferred Alternative was refined to reflect the actual year of anticipated expenditure. Current forecasts estimate construction to take place between the years 2008 and Based on this three year span, the midpoint year of 2009 was selected for the year of expenditure. In addition to the historical cost data used previously from the Springfield Interchange (Phases 2/3, 4 and 5), cost estimates were further calibrated by utilizing costs from another VDOT project currently under construction in Northern Virginia: the Route 1 Interchange (part of the Wilson Bridge Improvement project). Using these two sets of current cost data as well as VDOT s most recently approved contingencies and incidental cost items, including toll facility and construction management plans, the total design and construction cost of the Preferred Alternative is estimated to be $1.15 billion (in 2009 dollars). The right-of-way costs are estimated to be $18.9 million (in 2009 dollars). Details of the refined cost estimates including methodologies, quantities, unit costs, and final estimates, are provided in the Cost Estimates Technical Report (April 2006). 2.3 NO-BUILD ALTERNATIVE The No-Build Alternative provides for no improvements to the Beltway except for periodic maintenance and minor enhancements needed to maintain operation of the roadway. However, other planned improvements to the regional roadway and transit network other than the section of Beltway under consideration here, as outlined in the 2000 update to The Long-Range Transportation Plan for the National Capital Region, were assumed to be in place by the design year (2020) for purposes of traffic forecasting. These planned improvements include the following: 1 Roadway Improvements: Reconstruction of the I-95/I-395/I-495 interchange, with direct HOV access to the Beltway. 1 Note: These improvements were also assumed to be in place by the design year for each of the build alternatives. The environmental consequences of these improvements are discussed in the cumulative effects section of Chapter
90 Capital Beltway Study Chapter 2 Adding two HOV lanes on Braddock Road between Burke Lake Road and the Beltway. Widening of Little River Turnpike (Route 236) to six lanes from Fairfax City to Alexandria. Widening of Lee Highway (Route 29) to six lanes from Cedar Lane to the Beltway. Widening of Arlington Boulevard (Route 50) to six lanes between Route 7 and Nutley Street. Widening of Leesburg Pike (Route 7) to eight lanes between the Beltway and the Dulles Access/Toll Road. Widening of Chain Bridge Road (Route 123) to eight lanes between Route 7 and the Dulles Access/Toll Road. Widening of the Dulles Access/Toll Road to six lanes between Dulles Airport and the Beltway. Transit Improvements: Additional express bus service in the Dulles Corridor. 2.4 OPERATIONAL ANALYSIS Each of the revised Candidate Build Alternatives offers advantages and disadvantages relative to the operational needs identified in Chapter 1. The following sections of this chapter provide a comparative summary of the operational analyses that were conducted after the Draft EIS for the two most promising revised Candidate Build Alternatives as well as the No-Build Alternative. Where appropriate, the revised alternatives are compared to the initial set of Candidate Build Alternatives contained in the Draft EIS. There are also relative differences in the level of environmental consequences associated with each alternative. These will be discussed later in Chapter Travel Demand and Capacity Forecasting and Assumptions As with the initial set of Candidate Build Alternatives, travel demand forecasts for the Capital Beltway, surrounding roadways, and cross streets were developed for each revised alternative using the Metropolitan Washington Council of Governments' (MWCOG) regional model version 1. The latest available socioeconomic forecasts at the beginning of the study, Round 6A Cooperative Forecasts of population and employment for the year 2020, were used to forecast daily travel demand in the study area. Subsequently, a detailed sub-area model was developed to produce year 2020 hourly forecasts of mainline, ramp, cross street, and intersection turning movement volumes. The sub-area model was then used in conjunction with the CORSIM simulation model to develop typical peak period and peak hour traffic flows to assess operational performance. The detailed sub-area model includes the Beltway mainline and the 10 study interchanges, beginning just south of Braddock Road and extending north to the American Legion Bridge. 2-30
91 Alternatives Capital Beltway Study The assumed roadway network includes all existing roads and all applicable roadway improvements contained in the Constrained Long-Range Plan (CLRP) for the year 2020, along with interchange details, including C-D roadways, where necessary. Forecasting assumptions for each alternative are described in more detail below No-Build Alternative (8 lanes total, no HOV) The Beltway would remain as four through lanes in each direction, along with existing merge or auxiliary lanes, with no improvements. The forecasting model assumes that other improvements included in the CLRP for construction and approved by the Transportation Planning Board (TPB) will have been implemented by the year Lane HOV Alternative This alternative would add one HOV lane to the Beltway in each direction. With this alternative, the Beltway would have a total of 10 through lanes: four general-purpose lanes and one HOV lane in each direction, i.e., a configuration. The far left lane (in each direction) would be designated as an HOV lane and separated from the general-purpose lanes by a 4-foot buffer strip. The HOV lane would be used by high occupancy vehicles carrying three or more occupants and buses during peak periods, with times established by the Commonwealth Transportation Board, and as general-purpose lanes during the remainder of the day. As with the No-Build Alternative, it is assumed that all CLRP improvements will have been implemented Preferred 12-Lane HOT/ Managed Lanes Alternative This alternative would add two HOT lanes to the Beltway in each direction. With this alternative, the Beltway would have a total of 12 through lanes: four general-purpose lanes and two HOT lanes in each direction, i.e., a configuration. The two far left lanes would be designated as HOT lanes and separated from the general-purpose lanes with a 4-foot buffer strip. The HOT lanes would be used by high occupancy vehicles, buses, and tolled low occupancy vehicles carrying less than three occupants, as determined by the Commonwealth Transportation Board. As with the No-Build Alternative, it is assumed that all CLRP improvements will have been implemented Range of Volumes Table 2-7 shows the range of forecast daily and peak hour volumes over the length of the 14-mile project corridor for existing conditions, the No-Build Alternative, and each of the two revised Candidate Build Alternatives. Forecasted travel volumes increase by between 20 and 40 percent by the year 2020, with the bigger increase in traffic forecasts occurring as alternatives increase in capacity. The majority (over 95%) of the increase is due to shifts in traffic demand between the Beltway and the nearby road network, primarily parallel north-south roadways. As congestion has grown on the Beltway, drivers have increasingly found alternate routes for their trips using arterial or local roadways. However, as capacity is added to the Beltway, vehicles will shift back to the Beltway. This movement was studied by reviewing the vehicle miles traveled within two miles east and west of the Beltway and on the parallel roadways east and west of the Beltway. As the capacity increases on the Beltway, the volume of traffic on the side streets decreases as vehicles shift 2-31
92 Capital Beltway Study Chapter 2 back to the major facility. Figure 2-3 illustrates the main routes that are currently being used to avoid congestion on the Beltway. Table 2-7 RANGE OF DAILY AND HOURLY (PEAK) DEMAND VOLUMES (VEHICLES IN ONE DIRECTION) Alternative Daily Hourly 2020 No-Build (8 lanes with no HOV) 101, ,000 8,350-11, Revised 10-Lane HOV (10 lanes, 2 of which would be HOV-3 + ) 106, ,000 8,400-12, Preferred 12- Lane HOT Alternative (12 lanes, 4 of which would be HOV-3 + /HOT) 108, ,000 8,500-13,200 Typically during the course of corridor studies that span multiple years, the socioeconomic forecasts for the region have been updated several times. These forecasts are usually reviewed to ensure that modifications to the forecasts do not represent a change that would alter the comparative evaluation of the alternatives and their relative ranking in terms of operational performance. For this study, the review of the socioeconomic forecasts concluded that the change in forecasts over the years does not change the relative relationship between alternatives. Both population and employment continue to increase in areas adjacent the Beltway and in Northern Virginia as a whole. Increasing employment in the Tysons Corner area and the extension of the forecast horizon year to 2030 would result in higher daily forecasts of travel demand. However, as areas served by the Beltway reach a mature status in terms of development, the rate of growth will be much slower than the current growth in the corridor. Without additional transportation improvements, the duration of congestion will increase on the Beltway and the road network. However, relative performance of the alternatives and the relationship to the transportation network will remain substantially unchanged. The socioeconomic forecasts for population and employment in the region are discussed in detail in Section Socioeconomics. When final design is conducted on the proposed improvements, the traffic forecasts will need to be updated to reflect a 20-year horizon. When this update is done, the environmental document will need to be re-evaluated to determine if the changes in the traffic forecasts will result in impacts (most notably air and noise) not already addressed in this EIS Origins and Destinations of Traffic The origins and destinations of vehicles getting on and off the Beltway during the peak hours were studied using the ramp to ramp trip tables from the sub-area model that was developed to produce year 2020 hourly forecasts for the Beltway Corridor. This data was used to study the weaving patterns of vehicles in order to identify the need for auxiliary lanes, C-D roads, and other specific design features to facilitate the movement of traffic along the corridor. In addition, the information was used to assess the potential market and available capacity in the HOV or HOT lanes for the two revised Candidate Build Alternatives. 2-32


")

93 Alternatives Capital Beltway Study Legend: = Primary Parallel Route = Secondary Cut-through Route Approximate Scale (Miles) CUT-THROUGH TRAFFIC BLTWY151 Figure 2-3 CAPITAL BELTWAY STUDY 2-33
94 Capital Beltway Study Chapter 2 The travel patterns of vehicles using the Beltway for the Preferred Alternative are shown in Figure 2-4. The figure graphically illustrates the total number of vehicles entering the project boundary from the mainline and at each of the on ramps at the ten study interchanges. These entry volumes are color-coded so that the destination of the vehicles can be tracked along the corridor. For example, during the AM peak hour heading southbound on the Outer Loop, 11,000 vehicles (in brown) enter the project boundary from the American Legion Bridge. Of those, 1,375 travel end-to-end and exit the study area after Braddock Road. The portion of these vehicles that are HOV would most likely use the HOV lanes. In addition, a number of the 1,375 vehicles that have one or two occupants would pay for entry into the HOT lanes. The remaining users of the HOV/HOT lanes were similarly calculated given the access and egress locations that were selected along the corridor. A more detailed discussion of the assumptions and process employed to calculate the number of vehicles using the HOV/HOT lanes is provided in Section Operational Analysis Developing Typical Traffic Flows Peak hour traffic volumes have traditionally been developed after trip assignment in the travel demand modeling process by using link-based peak hour factors and directional splits adjusted by area type or facility. However, in heavily congested areas, while this approach may represent demand, it does not realistically reflect typical traffic flows as congestion in one area limits the ability of drivers to reach another area and drivers choose alternate routes to reduce their time of travel. For the Capital Beltway, a link-based peak spreading methodology was employed utilizing the sub-area model and CORSIM in an iterative manner. The basic steps were as follows: Following the procedures of NCHRP 255, develop peak hour traffic volumes and use screenline analysis to assess the diversions to and from the Beltway based on the capacity available. Develop hourly volumes for the Beltway, interchanges, and intersecting facilities using facility-based diurnals. Run the CORSIM simulation model and based on the results; adjust the subarea model before repeating the steps. The procedure was validated by applying the approach to existing conditions and by checking against a manual approach where each alternative was segmented by operational characteristics: merge, diverge, weave, basic freeway, ramp, and intersections. Finally, the capacity of each of the facilities intersecting the Beltway was determined and the projected demand was compared to the capacity available to feed or accept traffic. CORSIM was then run a minimum of five times with different start times for the analysis to assess the sensitivity of the model to changes in entry volumes at individual ramps. Potential changes in design or varying operating strategies were assessed by pivoting the input to the CORSIM models. The process used to develop typical peak hour traffic flows is described in more detail in the Transportation Technical Report. 2-34
95 Alternatives Capital Beltway Study AM Peak Hour 11,000 From American Legion Bridge 1,800 total off = 1,800 11,000 total = 11,000 George Washington Parkway total on = 900 9, , Georgetown Pike (Rt. 193) , , ,915 2,100 Dulles Access and Toll Road (Rt. 267) 2,300 6, ,300 9, ,391 2,100 Chain Bridge Road (Rt. 123) 1,000 1,000 4, ,980 2,000 9, ,400 Leesburg Pike (Rt. 7) ,100 3, ,622 1,544 2,550 9,650 NOTE: This figure illustrates the origin and destination of vehicles getting on and off the Beltway. For example, in brown, 11,000 vehicles enter the project boundary. 1,800 vehicles exit east at George Washington Parkway. Remaining on the Beltway are 9,200 vehicles and entering the Beltway from westbound George Washington Parkway are 900 vehicles for a total of 900 vehicles entering from George Washington Parkway. PM Peak Hour 9,100 From American Legion Bridge 1,450 total off = 1,450 9,100 total = 9,100 George Washington Parkway total on = 2,800 7,650 2, Georgetown Pike (Rt. 193) 10,450 10, ,037 2,213 1, ,912 2,400 Dulles Access and Toll Road (Rt. 267) 1,550 4,889 1, ,550 8, ,900 Chain Bridge Road (Rt. 123) 1,750 2,600 3, ,195 4,350 10, Leesburg Pike (Rt. 7) 784 2,792 NOTE: This figure illustrates the origin and destination of vehicles getting on and off the Beltway. For example, in brown, 9,100 vehicles enter the project boundary. 1,450 vehicles exit east at George Washington Parkway. Remaining on the Beltway are 7,800 vehicles and entering the Beltway from westbound George Washington Parkway are 2,800 vehicles for a total of 2,800 vehicles entering from George Washington Parkway ,250 Interstate 66 (I-66) 1, ,200 2,612 1,229 1,098 2,234 3,400 10,800 1, , ,050 Arlington Boulevard (US Rt. 50) 1, ,250 2,127 1, ,933 1,719 2,300 10, , ,004 3,828 3,576 13, , ,359 3,700 Interstate 66 (I-66) 400 2,600 2, ,519 3,264 3,000 12, , Arlington Boulevard (US Rt. 50) 1,500 1,450 1,851 2,133 3,014 2,181 2,950 13, Gallows Road (Rt. 650) Gallows Road (Rt. 650) , ,680 1,187 2, ,500 1,731 1,991 2,844 1,699 2,774 1,150 13, Little River Turnpike (Rt. 236) , Little River Turnpike (Rt. 236) , , , , ,800 9,800 1, ,717 2,383 1,473 2,178 1,050 1,600 12, , Braddock Road (Rt. 620) , ,900 Braddock Road (Rt. 620) ,450 1, , , ,656 3,400 11,400 1, ,225 1, , ,368 1,800 11,400 BLTWY150 RAMP-TO-RAMP TRAVEL PATTERNS Southbound (Outer Loop) Figure 2-4a CAPITAL BELTWAY STUDY 2-35
96 Capital Beltway Study Chapter 2 AM Peak Hour 10,500 From I-95/I-395/ I-495 Interchange 1,400 total off = 1,400 10,500 total = 10, total off = 400 Braddock Road (Rt. 620) total on = 1,650 total on = 1,000 8,700 2,650 11, ,050 1,300 1, Little River Turnpike (Rt. 236) 1,450 7,354 2,296 2,500 12, Gallows Road (Rt. 650) 650 1,350 6,511 1,963 2,326 2,000 12, , ,350 Arlington Boulevard (US Rt. 50) 800 1,300 5,011 1,467 1,962 1,760 2,100 12, ,315 2, Interstate 66 (I-66) 4,000 3,189 1,308 1,753 1,210 1,590 4,000 13,050 NOTE: This figure illustrates the origin and destination of vehicles getting on and off the Beltway. For example, in green, 10,500 vehicles enter the project boundary. 400 vehicles exit east at Braddock Road and 1,400 vehicles exit west at Braddock Road. Remaining on the Beltway are 8,700 vehicles and entering the Beltway from eastbound Braddock Road are 1,650 vehicles and from westbound Braddock Road are 1,000 vehicles for a total of 2,650 vehicles entering from Braddock Road. PM Peak Hour 11,100 From I-95/I-395/ I-495 Interchange 2,650 total off = 2,650 11,100 total = 11, total off = 650 Braddock Road (Rt. 620) total on = 950 total on = 750 7,800 1,700 9, ,414 1, Little River Turnpike (Rt. 236) 1,250 5,991 1,509 1,750 9, Gallows Road (Rt. 650) ,482 1,320 1,648 1,050 9, , Arlington Boulevard (US Rt. 50) 1,350 1,650 4, , ,000 10, ,535 3, ,250 Interstate 66 (I-66) 2,000 2, ,588 2,000 8, , , Leesburg Pike (Rt. 7) 750 1, ,370 2, , ,286 3,229 1,670 11, , , ,300 Chain Bridge Road (Rt. 123) 1, , , ,007 2,062 1,098 1,500 8, , ,150 Dulles Access and Toll Road (Rt. 267) 2, ,800 1, , ,275 3,800 10, Georgetown Pike (Rt. 193) , , ,265 3,395 1,800 11, , ,600 George Washington Parkway , NOTE: This figure illustrates the origin and destination of vehicles getting on and off the Beltway. For example, in green, 11,100 vehicles enter the project boundary. 650 vehicles exit east at Braddock Road and 2,650 vehicles exit west at Braddock Road. Remaining on the Beltway are 7,800 vehicles and entering the Beltway from eastbound Braddock Road are 950 vehicles and from westbound Braddock Road are 750 vehicles for a total of 1,700 vehicles entering from Braddock Road. Leesburg Pike (Rt. 7) 1, ,237 1,839 1,811 8,000 Chain Bridge Road (Rt. 123) 1, ,370 1,476 2,500 8,550 Dulles Access and Toll Road (Rt. 267) ,241 1,308 1,979 2,700 9,350 Georgetown Pike (Rt. 193) ,201 1,227 1,863 2, ,550 George Washington Parkway 2, ,161 1,151 1,712 2, ,600 10, , ,224 2,112 1,056 2,050 10, BLTWY155 RAMP-TO-RAMP TRAVEL PATTERNS Northbound (Inner Loop) Figure 2-4b CAPITAL BELTWAY STUDY 2-36
97 Alternatives Capital Beltway Study The operational comparisons described in the following sections represent average or typical peak hour conditions Operational Performance - Mainline of the Beltway As stated in Section 2.1, the maximum number of lanes on the Beltway was set at 12 in order to minimize the environmental impacts of the widening. As such, all of the alternatives studied throughout the course of the EIS will experience several hours of congestion per day. Under these conditions, examining traditional measures of performance such as level of service (LOS) at individual locations is unlikely to highlight the differences between alternatives. During the peak periods, the mainline operates at LOS F throughout much of the corridor for the build alternatives. Some locations may operate at a higher LOS due to upstream bottlenecks affecting the speeds and queues downstream from the point of congestion. Therefore, it is necessary to examine several additional measures of effectiveness to better understand the conditions of the Beltway Corridor under each alternative. The measures presented include hours of congestion; peak hour queue lengths and speeds; throughput; vehicle delays and travel times during the peak hour, peak period, and off-peak; and overall performance based on CORSIM network statistics such as number of lane changes along the entire corridor, total vehicle hours of move time, and total vehicle hours of delay Hours of Congestion The number of hours of congestion for each alternative varies by location. Congestion is defined as traffic flow that is influenced by the effects of a bottleneck. Moderate congestion exists when average speeds range from 20 to 45 mph, with periods of stopping/slowing and brief intermittent segments at free-flow speeds. Severe congestion consists of speeds ranging from 10 to 20 mph, with extended periods of stop and go conditions with few increases in speed. The No-Build Alternative experiences the highest amount of congestion with up to 16 hours per day. The revised 10-Lane HOV Alternative results in up to 13 hours of congestion per day, and the Preferred 12-Lane HOT Alternative will experience up to 11 hours of congestion per day, depending on the location. Note that for the two build alternatives, the estimates of congestion apply primarily to the general purpose lanes, the HOV/HOT lanes are generally expected to operate at free flow conditions. Figure 2-4 depicts the number of hours of various congestion levels that can be expected for each alternative Peak Hour Queuing and Speeds Traffic flows smoothly and maximum throughput is achieved when the volume to capacity (V/C) ratio remains generally constant. When demand exceeds capacity on a freeway facility, queues begin to form, usually at the location of merges, diverges, weaving areas, or where a lane drop causes a significant increase in the volume to capacity ratio. When developing concepts for and designing a freeway, the V/C profile is one of the most important considerations in determining the need for auxiliary lanes between interchanges to provide additional capacity. However, with the dynamic nature of demand, it is impossible to maintain a smooth V/C profile. As a result, queues form where the V/C ratio increases significantly, which in turn can change speeds and demands upstream and downstream of the location. Overall, throughput on the facility drops and additional 2-37
98 Capital Beltway Study Chapter 2 queuing occurs along the corridor. However, at select locations, traffic will flow at relatively high speeds. The exact location of queues and reduced speeds will vary by time of day or even by 15 minute periods. It can also vary noticeably from day to day. The general location and maximum length of queues through the project area for each of the alternatives during the AM and PM peak hours have been mapped and are shown in Figure 2-5. The queues vary between alternatives, but the following locations experience congestion in all alternatives: Northbound approaching Arlington Boulevard (U.S. 50) in the morning due to weaving at the Route 50 interchange. Northbound approaching Leesburg Pike in the morning due to the heavy volume of traffic approaching Tysons Corner. Southbound approaching the Dulles Access/Toll Road in both peaks, also due to high volumes approaching Tysons Corner. Southbound approaching Little River Turnpike in the evening due to a lane drop prior to the interchange area. Each alternative has individual bottlenecks in addition to those listed above. These bottlenecks are often caused by design restraints unique to that alternative or by particularly high volumes. Figure 2-7 illustrates the average speeds for each alternative during the AM and PM peaks, respectively. The speeds are affected by the location and severity of the bottlenecks within the project corridor Throughput Throughput is defined as the volume of traffic that passes a given point on a facility during a particular time period. On congested facilities, this volume is usually lower than the demand, the volume of traffic that desires to travel through that point during that time period. Thus, queues develop as vehicles are not accommodated and the demand exceeds the capacity of the facility. In the case of the Beltway, daily throughput was reviewed to differentiate between the alternatives. Throughput during the peak periods varies greatly from alternative to alternative. The mainline throughput for the Preferred 12-Lane HOT Alternative is the highest, accommodating over 20% more as compared to the No-Build Alternative. The 10-Lane HOV Alternative has the second highest throughput, slightly less than the Preferred Alternative, showing a 13% increase in throughput. At the on-ramps as well, the Preferred 12-Lane HOT Alternative will have higher throughput as the additional capacity on the mainline will allow vehicles to gain faster entry onto the Beltway and minimize the queues that will form on the local streets. The capacity of both of the revised Candidate Build Alternatives can handle the forecast demand on a daily basis with congestion limited to peak periods of between two and four hours each for the AM and PM peak periods. The no-build capacity, however, cannot handle the forecast demand with congestion being experienced throughout most of the day. Approximately 10,000 vehicles that desire to use the Beltway under no-build 2-38
99 Alternatives Capital Beltway Study No-Build Lane HOV (Congestion On Mainline) Preferred Alternative 12-Lane HOT/Managed Lanes (Congestion On Mainline) Severe (<20 mph) Moderate (21 to 45 mph) Free Flow (> 45 mph) 2020 HOURS OF CONGESTION BLTWY098 Figure 2-5 CAPITAL BELTWAY STUDY 2-39
100 L=6550ft L=2450ft Capital Beltway Study Chapter Washington FAIRFAX VIENNA NOT TO SCALE No-Build 7 N Leesburg Pike Dulles L=1000ft L=7850ft 236 Access L=1000ft L=10500ft L=3600ft 193 L=1950ft 650 Georgetown and Toll Road FALLS CHURCH VIRGINIA George Pike Li tle River Turnpike L=15750f L=27550ft 495 Georgetown L=4900ft George Pike AMERICAN LEGION MEMORIAL BRIDGE Washi n g ton FAIRFAX COUNTY ARLINGTON COUNTY 7 MARYLAND Me morial Parkway 244 AMERICAN LEGION MEMORIAL BRIDGE 95 WASHINGTON, D.C. 50 ALEXANDRIA 611 MARYLAND POTOMAC RIVER WOODROW WILSON MEMORIAL BRIDGE Washington Dulles VIENNA Access L=3300ft AMERICAN LEGION MEMORIAL BRIDGE and 495 Toll L=5900ft Road FALLS CHURCH 193 VIRGINIA Washington Leesburg Pike Dulles L=14100ft VIENNA 66 Access and Toll Road L=4900ft 267 FALLS CHURCH 29 VIRGINIA Washi n g ton FAIRFAX COUNTY ARLINGTON COUNTY Me morial 66 Parkway WASHINGTON, D.C. 50 FAIRFAX L=13100ft FAIRFAX POTOMAC RIVER L=3250ft Little River Turnpike L=16400ft 236 ALEXANDRIA N WOODROW WILSON MEMORIAL BRIDGE N NOT TO SCALE 1 NOT TO SCALE 10-Lane HOV 12-Lane HOT/Managed Lanes Legend: = AM = PM 2020 TRAVEL CONGESTION BLTWY100 Figure 2-6 CAPITAL BELTWAY STUDY 2-40
101 Alternatives Capital Beltway Study Georgetown George AMERICAN LEGION MEMORIAL BRIDGE MARYLAND AMERICAN LEGION MEMORIAL BRIDGE Pike Washington FAIRFAX Leesburg Pike Dulles VIENNA Access and Toll Road FALLS CHURCH Li tle River Turnpike 193 VIRGINIA Washi n g ton FAIRFAX COUNTY ARLINGTON COUNTY 7 Me morial 66 Parkway 244 WASHINGTON, D.C. 50 POTOMAC RIVER 7 Washington 267 Dulles Access 193 and Toll Road 267 VIRGINIA ALEXANDRIA N NOT TO SCALE No-Build WOODROW WILSON MEMORIAL BRIDGE VIENNA 66 FALLS CHURCH Georgetown George Pike AMERICAN LEGION MEMORIAL BRIDGE MARYLAND Washington Leesburg Pike Dulles Access and Toll Road 267 VIRGINIA Washi n g ton FAIRFAX COUNTY ARLINGTON COUNTY Me morial Parkway WASHINGTON, D.C. FAIRFAX VIENNA 66 FALLS CHURCH FAIRFAX Little River Turnpike POTOMAC RIVER ALEXANDRIA N WOODROW WILSON MEMORIAL BRIDGE N NOT TO SCALE 1 NOT TO SCALE 10-Lane HOV 12-Lane HOT/Managed Lanes Legend: = 0-20 mph = mph = mph = mph = 51> mph 2020 TRAVEL SPEEDS (AM PEAK HOURS) BLTWY101 Figure 2-7a (1 of 2) CAPITAL BELTWAY STUDY 2-41
102 Capital Beltway Study Chapter Georgetown George AMERICAN LEGION MEMORIAL BRIDGE MARYLAND AMERICAN LEGION MEMORIAL BRIDGE Pike Washington FAIRFAX Leesburg Pike Dulles VIENNA Access and Toll Road FALLS CHURCH 711 Li tle River Turnpike 193 VIRGINIA Washi n g ton FAIRFAX COUNTY ARLINGTON COUNTY 7 Me morial 66 Parkway 244 WASHINGTON, D.C. 50 POTOMAC RIVER 7 Washington 267 Dulles Access 193 and Toll Road 267 VIRGINIA ALEXANDRIA N NOT TO SCALE No-Build WOODROW WILSON MEMORIAL BRIDGE VIENNA 66 FALLS CHURCH Georgetown George Pike AMERICAN LEGION MEMORIAL BRIDGE MARYLAND Washington 267 Dulles Leesburg Pike Access and Toll Road 267 VIRGINIA Washi n g ton FAIRFAX COUNTY ARLINGTON COUNTY Me morial Parkway WASHINGTON, D.C. FAIRFAX VIENNA 66 FALLS CHURCH FAIRFAX Little River Turnpike POTOMAC RIVER ALEXANDRIA N WOODROW WILSON MEMORIAL BRIDGE N NOT TO SCALE 1 NOT TO SCALE 10-Lane HOV 12-Lane HOT/Managed Lanes Legend: = 0-20 mph = mph = mph = mph = 51> mph BLTWY TRAVEL SPEEDS (PM PEAK HOURS) Figure 2-7b (2 of 2) CAPITAL BELTWAY STUDY 2-42
103 Alternatives Capital Beltway Study conditions will be forced to find another route or to abort the trip completely. As discussed previously this will increase the amount of cut-through traffic on the local neighborhood streets, decreasing safety and increasing noise and local disruption. Determining the appropriate capacity (size of facility) to provide has been and continues to be a subject of much debate. It has been argued that providing too much capacity will encourage additional growth in traffic demand. On the other hand, insufficient capacity with limited throughput results in additional traffic on the adjacent road network on both arterial and local streets. In developing alternatives and choosing the preferred alternative the objective was to provide a level of capacity that balanced reasonably well with the existing or approved road network that feeds traffic to and receives traffic from the Beltway. As presented above it was found that the Preferred Alternative came the closest to meeting this objective. Congestion is restricted to the AM and PM peak periods in most locations. However, even with the additional capacity, operational performance in the general purpose lanes is expected to gradually decline. The HOT lanes will handle approximately 15% to 20% of the projected demand during peak periods Delay and Travel Times Delay and travel times during the peak periods were calculated for each of the mainline alternatives. Table 2-8 summarizes the number of minutes it will take to travel through the entire corridor during the AM. (5:00 to 10:00 AM) and PM (3:00 to 8:00 PM) peak periods and midday (10:00 AM to 3:00 PM), including the number of minutes of delay experienced in each of the alternatives. Again, the No-Build Alternative experiences the highest amount of delay, with the northbound Beltway forecasted to experience LOS F for most of the corridor, causing over 30 minutes of delay in the AM peak. The managed HOT lanes within the Preferred Alternative are forecasted to have substantially less delay (2 to 4 minutes). Midday performance. During the middle of the day, both of the revised build alternatives will operate for several hours under free-flow conditions, with little congestion or delay. These mainline alternatives will operate at LOS A throughout the corridor. The No-Build Alternative, on the other hand, will not clear during the midday period. In the PM peak the Outerloop LOS will vary throughout the corridor, with drivers experiencing approximately twenty minutes of delay. Delays in the PM peak will continue to be significantly less than those experienced in the AM Peak period. This is due to the limited capacity of the facilities feeding the Beltway, primarily from the Tysons Corner area Overall Performance To compare the overall performance of alternatives, a number of criteria were examined, including the number of lane changes along the corridor, the vehicle miles traveled, and average speed. The number of lane changes along the corridor gives an indication of the level of turbulence on the facility and the adequacy of the design to accommodate desired traffic movements. Travel speeds reduce and the potential for accidents increase when vehicles change lanes; thus, the design of a facility attempts to minimize the number of 2-43
104 Capital Beltway Study Chapter 2 required lane changes along the corridor. Average speeds and total vehicle miles give an overall assessment of the ability of the alternative to accommodate vehicle demand in a timely manner. Table ESTIMATED TRAVEL TIME AND DELAY Northbound Expected Delay (minutes) AM Peak Midday PM Peak ALTERNATIVE Time Delay Time Delay Time Delay No-Build Express-Local w/hov Concurrent HOV Barrier Separated HOV Revised 10-Lane HOV Southbound Expected Delay (minutes) Preferred 12-Lane HOT Alternative 46 (15) 33 (2) (17) No-Build Express-Local w/hov Concurrent HOV (4) Barrier Separated HOV Revised 10-Lane HOV Preferred 12-Lane HOT Alternative 17 (15) 4 (2) (15) 6 (2) Notes: 1. Travel Time and Delay values in parentheses are for the separated managed lanes (HOV/HOT) 2. Midday statistics are not available for the Revised 10-Lane HOV and the Preferred Alternative. Table 2-9 summarizes the performance of the alternatives by these three criteria. These statistics were extracted from the CORSIM microsimulation model for the AM and PM peak hour. As shown in the table, when comparing operations in the general purpose lanes, the number of lane changes is lowest for the Preferred 12-Lane HOT Alternative given the physical separation of the HOV/HOT lanes from the general-purpose lanes and given that the majority of the access to the managed lanes is provided via direct ramps at interchanges. Figure 2-8 illustrates the impact of lane changing on traffic flow. Although the additional lanes proposed under each of the build alternatives results in more total vehicle miles traveled (VMT) on the Beltway -- this increase is offset by the reduction in VMT on adjacent roadways (as discussed previously in Section 2.4.1) Finally, both of the build alternatives demonstrate substantial increases in travel speeds compared to the No- Build Alternative in most locations, as shown previously in Figure 2-7. In fact, the HOV/HOT lanes in the Preferred Alternative operate at free flow conditions. 2-44
105 Alternatives Capital Beltway Study Table 2-9 OPERATING PERFORMANCE EXISTING NO-BUILD REVISED 10-LANE HOV PREFERRED 12-LANE HOT Lane Changes AM Peak Hour Inner Loop Outer Loop Vehicle Miles Avg Speed Lane Changes Vehicle Miles Avg Speed Lane Changes Vehicle Miles Avg Speed Lane Changes Vehicle Miles GP 155, , , , ,868 96, ,549 92, HOV / NA NA NA NA NA NA NA 16, ,707 33, HOT Total 155, , , , , , , ,929 GP 133,013 99, , , , , , , HOV / NA NA NA NA NA NA NA 10, ,439 32, HOT Total 133,013 99, , , , , , ,468 PM Peak Hour Inner Loop Outer Loop GP 128,692 96, , , , , , , HOV / NA NA NA NA NA NA NA 12, ,618 26, HOT Total 128,692 96, , , , , , ,000 GP 151, , , , , , , , HOV / NA NA NA NA NA NA NA 15, ,429 37, HOT Total 151, , , , , , , ,137 Note: GP = General Purpose lanes; HOV/HOT = High Occupancy Vehicle and High Occupancy Toll Lanes There are no HOV/HOT lanes on the existing Beltway. Avg Speed Despite the improvements, it should be noted that the average speed for a vehicle driving the length of the corridor on the Inner Loop during the AM and PM peak hours in the general purpose lanes will decrease somewhat with the build alternatives as compared to the No-Build Alternative. This speed reduction is cased by the congestion in the Tyson s Corner area. Specifically, the delays are caused by the queues that extend back on to the mainline from the Inner Loop to the westbound Route 123 ramp, where traffic exiting from the general purpose lanes yields to traffic exiting from the HOT lanes HOV/HOT Network One of the objectives of the Beltway improvements is to include the Beltway in the regional HOV/HOT system, which would provide seamless travel between destinations on HOV/HOT facilities. The build alternatives meet this objective, while the No-Build Alternative does not. Under the No-Build Alternative, there are no time saving advantages for carpools or bus transit because all lanes are for general use. The 10-Lane HOV Alternative provides some benefit, as there is a dedicated HOV lane provided during the peak periods. However, this alternative is limited in its benefits because HOV vehicles must first merge across four general-purpose lanes before accessing the HOV lane when there is no direct connection. In addition, there is not sufficient surplus capacity to implement a HOT lane. HOT lanes were developed to respond to situations where HOV lanes were underutilized as way to increase the overall throughput on congested facilities. In the case of the Beltway there would only be room for 400 to 500 vehicles per hour with this alternative. 2-45
106 Capital Beltway Study Chapter 2 Excessive lane changing reduces speeds and increases congestion on the roadway AM - Peak Hour Northbound Cross Weaving 840 1,965 2,805 8,700 6,510 1,965 2,325 10,800 2,650 Route 620 Braddock Rd. Weaving 2,300 1,350 3, ,350 1,700 2,500 Route 236 Little River Turnpike Weaving ,325 3, ,350 Route 650 Gallows Rd. BLTWY152 LANE CHANGING Figure 2-8 CAPITAL BELTWAY STUDY 2-46
107 Alternatives Capital Beltway Study The Preferred 12-Lane HOT Alternative provides better access to the HOV lanes than the Concurrent HOV Alternative, and provides capacity for 1,600 to 2,000 tolled vehicles per each direction as discussed in more detail in the following paragraphs. In addition this alternative provides capacity for the implementation of transit services along the Beltway and reliable travel times for express bus service Assessment of Demand and Available Capacity for HOV and Tolled Vehicles The origin-destination data extracted from the sub-area model (see Section 2.4.1) was used to identify the appropriate combination of access points to the HOV/HOT facilities that would optimize their performance. Originally, the system was designed to provide access at either end of the corridor and at the I-66 and Dulles Access/Toll Road interchanges, as both of these roadways currently have HOV facilities in operation. However, traffic assignments indicated that the HOV/HOT facilities would be underutilized given this configuration, as shown in Figure 2-9a. Therefore, upon evaluation of origin-destination patterns of users of the Beltway, additional access points were included at the Braddock Road interchange (where an HOV facility is planned for implementation), at the Route 123 interchange (to improve access to Tysons Corner), and at the Lee Highway (Route 29) crossing of the Beltway (to improve access to Merrifield). As shown in Figure 2-9b, this configuration maximizes the use of the HOV/HOT lanes. In the figures, the HOV traffic that is able to use the facility given their origin and destination is shown in blue and the number of tolled vehicles that are able to use and that will be allowed to buy access into the managed lanes given the available capacity is shown in green. For purposes of this analysis, the capacity of the two lane facility was set at 3,400 vehicles per hour, or 1,700 vehicles per hour per lane, in order to maintain traffic operations at Level of Service C or better. The demand for the HOT lanes is higher on certain segments of the Beltway, and in these locations, the number of tolled vehicles that are able to use the HOT lanes exceeds the 3,400 vehicle per hour limit set for the managed facility. These excess vehicles will be priced out (where the cost to enter the lanes is raised to discourage further entry) and they are shown in yellow. In the figures, the maximum volume of traffic in any section is limited by the section with heaviest demand. In some cases, sections run below the theoretical capacity in order to accommodate downstream demand. Actual volumes will vary in response to the level of tolls charged. However, it is estimated that an average volume of 1,400 vehicles per hour per lane could be maintained over the length of the corridor. These calculations assume that all of the HOV vehicles that desire to use the HOT facility during the peak hour will be accommodated. However, in reality, this may not be the case as the arrival rates of the HOV traffic and the tolled vehicles will vary during that hour. If more tolled vehicles arrive first, they will enter the HOT facility, forcing it to reach capacity, and some of the HOV vehicles that arrive later in the hour may be part of the group that is priced out. The policy and operating decisions that will be made by the Commonwealth Transportation Board will address these types of issues. Revenue and pricing strategies were not conducted as part of this study; this analysis was conducted solely to determine the feasibility of HOT lanes. 2-47
108 Capital Beltway Study Chapter 2 NORTH Direction of flow Capacity = 3400 vph ,550 Capacity = 3400 vph 2,080 SOUTHBOUND (OUTER LOOP) Direction of flow 2,010 3,400 AM Capacity = 3400 vph Capacity = 3400 vph 2,390 NORTHBOUND (INNER LOOP) 2,560 2,170 Legend: = Priced out LOV = HOT Users (LOV Vehicles) = HOV Users NORTH Direction of flow Note: The access points are: Southern Terminus of HOT Lanes, I-66, Dulles Toll Road (Rt. 267), Northern Terminus of HOT Lanes 3,210 Capacity = 3400 vph 0 1,280 Capacity = 3400 vph 2,890 SOUTHBOUND (OUTER LOOP) Direction of flow 2,180 3,400 PM Capacity = 3400 vph Capacity = 3400 vph 2,890 NORTHBOUND (INNER LOOP) 2,530 1,920 BLTWY153 HOV/HOT LANE UTILIZATION Basic Access Points Figure 2-9a (1 of 2) CAPITAL BELTWAY STUDY 2-48
109 Alternatives Capital Beltway Study NORTH Capacity = 3400 vph 4,415 1,795 Direction of flow 705 1,295 2,480 3,550 Capacity = 3400 vph 3,340 2,560 2,190 2,700 3,070 3,320 SOUTHBOUND (OUTER LOOP) Direction of flow AM Capacity = 3400 vph 2,610 2,240 3,380 1,900 1,970 NORTHBOUND (INNER LOOP) 3,190 2,520 3,180 1,990 3,010 1,620 2,560 Capacity = 3400 vph Legend: = Priced out LOV = HOT Users (LOV Vehicles) = HOV Users Note: The access points are: Southern Terminus of HOT Lanes, Braddock Road, Route 29, I-66, Route 123, Dulles Toll Road (Rt. 267), Northern Terminus of HOT Lanes NORTH Capacity = 3400 vph 2,500 4,110 Direction of flow 2,240 3,890 3,280 4,590 Capacity = 3400 vph 2,760 3,320 2,960 3,130 2,900 3,400 SOUTHBOUND (OUTER LOOP) Direction of flow PM Capacity = 3400 vph 4,410 2,030 1,320 1,370 2,260 1,570 Capacity = 3400 vph 3,160 2,240 1,740 2,010 NORTHBOUND (INNER LOOP) 2,610 2,130 BLTWY154 HOV/HOT LANE UTILIZATION Additional Access Points Figure 2-9b (2 of 2) CAPITAL BELTWAY STUDY 2-49
110 Capital Beltway Study Chapter Safety and Roadway Design Construction of any of the build alternatives would substantially improve safety within the corridor. As discussed in Chapter 1, Purpose and Need, the number of accidents on this portion of the Beltway has steadily increased in recent years, primarily due to the increase in congestion, and will continue to rise as long as congestion becomes more severe. Other primary causes of crashes in the corridor include ramps with entrances and exits on the left, substandard acceleration and deceleration lanes, tight loop ramps, and closely spaced interchanges. Without improvements, the number of crashes on the Beltway will continue to rise as congestion increases, and the safety performance of the Beltway would deteriorate substantially. The No-Build Alternative does not solve any of the current safety issues, exacerbating the existing problem. All of the build alternatives, on the other hand, would both reduce congestion and eliminate existing substandard design issues. The greatest level of improvement would occur with the construction of the barrier-separated alternatives, particularly the Express-Local Alternative previously considered in the Draft EIS. However, with the inclusion of a 4-foot buffer between the HOV/HOT lanes and the general purpose lanes, the Preferred Alternative also provides additional safety benefits when compared to the existing Beltway. While not new, such concepts are increasingly being considered to resolve safety concerns in high-volume corridors, including: I-270 in Montgomery County, Maryland Dulles Access and Toll Road in Fairfax County, Virginia New Jersey Turnpike The safety benefits provided by the Preferred Alternative are discussed below: Fewer Traffic Conflicts HOV and HOT vehicles traveling through the corridor within the managed lanes are separated from vehicles entering and exiting at local interchanges. This concentrates the weaving on the general purpose lanes, where drivers are expecting such conditions. With most express-local type systems such as the Preferred Alternative, the number of weaving maneuvers and lane changes required is usually reduced through the selective use of direct connections at high-volume entrances or exits or for special purposes, such as HOV connections. In addition to the required lane changes, many drivers change lanes in response to slowing traffic. With the buffer separation provided by the Preferred Alternative, the higher speeds will be separated from the slower vehicles in the congested lanes, which should also reduce the number of discretionary lane changes. The C-D roadways included in the 10-Lane HOV Alternative would also provide this benefit, but to a lesser extent Freeway Management In congested corridors, it has become increasingly difficult for law enforcement and emergency response equipment to reach the scene of an incident. Vehicles responding to incidents have had to "fight" their way through the queue formed upstream of the incident. 2-50
111 Alternatives Capital Beltway Study With the Preferred12-Lane HOV/HOT Alternative, vehicles responding to an incident would be able to reach the scene using the unaffected lanes (managed or local) or using the shoulder. Crossing the painted four foot separation would be permitted for law enforcement and emergency response personnel when responding to an incident. However, unlike the express-local facilities cited above, in the event of a more serious incident, all lanes could be blocked by serious incidents. 2.5 ALTERNATIVES CONSIDERED AND ELIMINATED The following section describes the various alternatives that were considered during the alternatives development and EIS process but eliminated for various reasons. These include the three Candidate Build Alternatives considered in the Draft EIS and the Revised 10-Lane HOV Alternative which was developed in response to public and agency comments on the original Candidate Build Alternatives. Other alternatives considered and eliminated include the conversion of existing lanes to HOV or HOT lanes, a rail transit alternative, express bus service, a transportation system management alternative, and various mainline and interchange configurations. Reasons for the dismissal of several of these alternatives were presented previously in the Draft EIS Revised Candidate Build Alternatives As described previously in Section 2.1.3, the Candidate Build Alternatives contained in the Draft EIS were scaled back substantially in response to public and local government comments. The alternatives were also evaluated for their ability to accommodate HOT operations as proposed by a recent PPTA proposal. Of the six potential modifications to the original Candidate Build Alternatives, only two were considered viable for further study: the Preferred 12-Lane HOT Alternative and the 10-Lane HOV Alternative Lane HOV Alternative This alternative is a scaled back version of the Concurrent HOV Alternative (described below). Like the Preferred Alternative, this reduced-scale alternative required substantially less new right-of-way than the original Candidate Build Alternatives and, in fact, slightly less than the Preferred Alternative. However, this alternative did not provide sufficient capacity in the two HOV managed lanes to accommodate any future consideration of HOT lane operations. Therefore, this alternative was not selected. This alternative would add one HOV lane to the Beltway in each direction. No additional general-purpose lanes would be constructed. With this alternative, the Beltway would have a total of 10 through lanes: four general-purpose lanes and one HOV lane in each direction. The far left lane would be designated as an HOV lane and would be separated from the general-purpose lanes by a 4-foot buffer strip. The HOV lane would be used by high occupancy vehicles and buses. The principle advantage of the 10-Lane HOV Alternative would be its smaller footprint and right-of-way impacts. The collector-distributor roadways would be barrier-separated from the mainline at interchanges and also between closely spaced interchanges for the reasons described previously. Continuous C-D roadways would be provided in both directions between Gallows Road and Route 50, extending to I-66, and only in the southbound direction 2-51
112 Capital Beltway Study Chapter 2 between Route 123 and Route 7, extending to the Dulles Access/Toll Road. In addition, the two C-D roadway systems would extend to I-66 and to the Dulles Access/Toll Road, respectively. In general, connection to interchanges would be made via the C-D roadways; however, at selected locations, direct access/egress would also be provided from the main roadways. The locations where direct access/egress would occur are at I-66, only to and from the south, and southbound at the Dulles Access/Toll Road and Route 123 interchanges. The HOV lanes would have direct access/egress to the HOV facilities at three interchanges: Braddock Road, I-66, and the Dulles Access/Toll Road. HOV traffic could also connect with Beltway interchanges by first merging (across the striped pavement) with the generalpurpose lanes of the mainline roadway and then exiting to the C-D roadways. In addition to these three interchanges, direct HOV access would also be provided at the Route 123 interchange to improve access to Tysons Corner and to and from the south side of Route 29 to improve access to Merrifield. Left exits and entrances from the mainline and the C-D roadways for non-hov traffic would be eliminated, except in the northbound ramps and C-D lanes of Route 123 and the Dulles Toll Road. However, such connections would be provided from the HOV lanes for HOV traffic only. At the northern end of the project segment, both the northbound and southbound portions of the 10-lane roadway configuration would transition to match the roadway cross-section south of the George Washington Memorial Parkway interchange. Similarly, at the southern end of the project segment, the I-495 mainline roadways would tie into the Springfield Interchange Project at Heming Avenue. At this location, the Beltway would have a 12-lane cross-section Draft EIS Candidate Build Alternatives Three Candidate Build Alternatives were discussed in the Draft EIS, and the reader should refer to that document for a detailed description of the physical and operational elements of each. Comments from the general public and local government suggested that none of the Candidate Build Alternatives as proposed in the Draft EIS should be considered for the Preferred Alternative. Accordingly, these alternatives are no longer under consideration and have been scaled back considerably in response to those comments as discussed previously Concurrent HOV Alternative Like the Revised 10-Lane HOV Alternative, this alternative would add one concurrent HOV lane to the Beltway in each direction. No additional general-purpose lanes would be constructed. With this alternative, the Beltway would have a total of 10 through lanes: four general-purpose lanes and one HOV lane in each direction. The principle advantage of a concurrent flow HOV roadway system would be its smaller footprint and right-of-way impacts. The C-D roadways would be barrier-separated from the mainline at interchanges and also between closely spaced interchanges for the reasons described above. Continuous C-D roadways would be provided in both directions between Gallows Road and Route 50, extending to I-66, and only in the southbound direction between Route 123 and Route 7, extending to the Dulles Access/Toll Road. In addition, the two C-D roadway systems would extend to I-66 and to the Dulles Access/Toll Road, 2-52
113 Alternatives Capital Beltway Study respectively. In general, connection to interchanges would be made via the C-D roadways; however, at selected locations, direct access/egress would also be provided from the main roadways. The locations where direct access/egress would occur are at I-66, only to and from the south, and southbound at the Dulles Access/Toll Road and Route 123 interchanges. The HOV lanes would have direct access/egress to the HOV facilities at three interchanges: Braddock Road, I-66, and the Dulles Access/Toll Road. HOV traffic could also connect with Beltway interchanges by first merging (across the striped pavement) with the generalpurpose lanes of the mainline roadway and then exiting to the C-D roadways. In addition to these three interchanges, direct HOV access would also be provided at the Route 123 interchange to improve access to Tysons Corner and to and from the south side of Route 29 to improve access to Merrifield. Left exits and entrances from the mainline and the C-D roadways for non-hov traffic would be eliminated, except in the northbound ramps and C-D lanes of Route 123 and the Dulles Toll Road. However, such connections would be provided from the HOV lanes for HOV traffic only. At the northern end of the project segment, the 10-lane roadway configuration would transition to match the roadway cross-section at the American Legion Bridge. Proceeding northbound from the Dulles Access/Toll Road, the I-495 mainline roadway cross-section would transition to match the section at the American Legion Memorial Bridge. The improvements to the southbound I-495 roadway would begin south of the George Washington Memorial Parkway. Similarly, at the southern end of the project segment, the I-495 mainline roadways would tie into the Springfield Interchange Project at Heming Avenue. At this location, the Beltway would have a 12-lane cross-section Express/Local with HOV Alternative This alternative would add two lanes (one HOV lane in each direction) and would reconfigure the Beltway to separate short- and long-distance trips. The express lanes (for longer trips) would be separated from the local lanes by a concrete barrier and shoulders. Access to these lanes would be provided at selected interchanges and at various points along the Beltway. One of the express lanes in each direction would be reserved for HOVonly use during peak periods. With this alternative, the Beltway would have a total of 10 through lanes (two local and three express lanes in each direction, i.e., a configuration). The advantage of an express/local roadway system is that, by efficiently catering to trip purpose and destination, most of the conflicts (weaving and merging) that routinely occur on concurrent lane roadways are eliminated. The local directional lanes function as a continuous C-D roadway, where connections can be made at every interchange and, at selected locations, to the express roadway. The express roadway better serves motorists making longer trips within the corridor, or just passing through the area. Alternatively, such traffic also can access the local roadway to terminate trips at designated interchanges or continue via the local roadway depending upon destination objective and perceived convenience. The express roadway would have direct access/egress at the I-66, Route 123, and the Dulles Access/Toll Road interchanges. 2-53
114 Capital Beltway Study Chapter 2 The HOV lanes would have direct access/egress to the HOV facilities at three interchanges: Braddock Road, I-66, and the Dulles Access/Toll Road. HOV traffic could also connect with Beltway interchanges by first merging (across the striped pavement) with the generalpurpose lanes of the express roadway and then exiting to the local roadway. In addition to these three interchanges, direct HOV access would also be provided at the Route 123 interchange to improve access to Tysons Corner and to and from the south side of Route 29 to improve access to Merrifield. Left exits and entrances from the general-purpose lanes of the express roadways for non- HOV traffic would be eliminated. However, as noted previously, such connections are provided from the HOV lanes, for use by HOV traffic only. With regard to the local roadways, left exits and entrances would be provided for the movement of traffic between them and the express roadways. At the northern end of the project segment, the express/local roadway configuration would transition to match the roadway cross-section at the American Legion Bridge, and also to connect with the George Washington Memorial Parkway. The improvements to the southbound I-495 roadway would begin at the bridge. In the northbound direction, the necessary transition in the express/local cross-sections would begin north of the Dulles Access/Toll Road interchange. Similarly, at the southern end of the project segment, the mainline I-495 express/local configuration would merge with the roadways and ramps of the I-95/I-395/I-495 interchange project immediately north of the bridge carrying the Beltway over Backlick Road. Crossover ramps were considered at the following four locations between interchanges to allow traffic to move between the express/hov lanes and the local lanes: Between Backlick Road and Heming Avenue. Between Little River Turnpike and Gallows Road. Between I-66 and Leesburg Pike. Between the Dulles Access/Toll Road and Georgetown Pike. Two types of crossover ramps were considered: braided ramps and slip ramps. Braided ramps involve a grade-separation of two nearly parallel ramps. The grade separation eliminates weaving conflicts of entering and exiting traffic. Braided ramps were considered at locations where traffic volumes warrant the additional capacity they provide, such as the connection between the I-95/I-395/I-495 interchange and the Beltway. Slip ramps are diagonal ramps that connect parallel barrier-separated lanes at the same level or grade. In those cases where additional traffic capacity would not be needed, slip ramps were considered. Slip ramps are normally preferred over braided ramps because they are less costly and less intrusive Barrier-Separated HOV Alternative This alternative would add four HOV lanes (two in each direction) and would reconfigure the Beltway to separate general-purpose and HOV traffic with a concrete barrier. Access to 2-54
115 Alternatives Capital Beltway Study the HOV lanes would be provided at selected interchanges and by slip ramps at various points along the Beltway. The HOV lanes would be available to all traffic during off-peak periods. With this alternative, the Beltway would have a total of 12 through lanes (four general-purpose lanes and two HOV lanes in each direction, i.e., a configuration). The main advantage of this Barrier-Separated HOV roadway is the capacity it provides for HOV traffic, thereby encouraging car-pooling and bus ridership by facilitating movement throughout the HOV roadway network. Accordingly, the HOV roadways would have direct access/egress to the existing and anticipated HOV facilities at three interchanges: Braddock Road, I-66, and the Dulles Access/Toll Road. In addition, direct HOV access would also be provided at the Route 123 interchange to improve access to Tysons Corner and to and from the south side of Route 29 to improve access to Merrifield. HOV traffic would not be able to connect with any of the other Beltway interchanges, except where the barrier has been terminated prior to the Georgetown Pike and George Washington Parkway. C-D roadways would be barrier-separated from the mainline roadways at interchanges and also between closely spaced interchanges to minimize movement conflicts and to improve safety and traffic operations. Continuous C-D roadways would be provided in both directions between Gallows Road and Route 50, extending to I-66, and in the southbound direction between the Dulles Access/Toll Road and Route 7. Generally, connection to interchanges would be made via the C-D roadways; however, direct access/egress would also be provided from the main roadways at selected locations. The locations where direct access/egress would occur are at I-66, only to and from the south, and southbound at the Dulles Access/Toll Road and Route 123 interchanges. Left exits and entrances for non-hov traffic, from the mainline and the C-D roadways, would be eliminated, except in the northbound ramps and C-D lanes of Route 123 and the Dulles Access/Toll Road. However, such connections would be provided from the HOV roadways, for use by HOV traffic only. At the northern end of the project segment, the 12-lane roadway configuration would transition to match the roadway cross-section at the American Legion Memorial Bridge. Toward the bridge, the required transition in the I-495 mainline cross-section would begin after the Dulles Access/Toll Road. The improvements to the southbound I-495 roadways would begin south of the George Washington Memorial Parkway. Similarly, at the southern end of the project segment, the I-495 mainline cross-section would tie into the I-95/I-395/I-495 interchange improvements immediately north of the Beltway bridge crossing over the Norfolk Southern Railway. At this location, the Beltway cross-section would consist of a 12-lane cross-section Interchange Improvement Options The interchange improvement options evaluated in detail in the Draft EIS, as well those options developed after the publication of the Draft EIS but not selected as Preferred Concepts, are described below. Braddock Road. Braddock Road (Route 620) has eight lanes immediately west of the Beltway and four lanes on the east. Interchange Concept E, a partial cloverleaf, was carried 2-55
116 Capital Beltway Study Chapter 2 forward for detailed evaluation. Because HOV lanes are planned for Braddock Road between the Beltway and Burke Lake Road in the Fairfax County Comprehensive Plan, the Braddock Road interchange improvement option would include additional ramps that would provide direct Beltway access for HOV traffic. Center-access HOV lanes were selected to ensure that HOV traffic had access to and from the Ravensworth Industrial Park and could work with HOV lanes on either the inside or outside shoulder. To eliminate the existing troublesome weave on the C-D roadway along northbound I-495, the existing loop ramp connecting northbound I-495 to westbound Braddock Road would be removed. That movement would be replaced by the single fly-over ramp that would tie into westbound Braddock Road on the far side of the Inverchapel Road intersection. To provide for traffic from the northbound C-D lanes of I-495 to locations on Braddock Road west of the interchange but east of the tie-in of the fly-over ramp, a left-turn lane would be provided to facilitate these movements in the form of a dog-leg extending from the northbound to the eastbound ramp. A traffic signal would be required at this location. The removal of the loop ramp would allow for improved alignment for the ramp carrying eastbound Braddock Road traffic heading north onto I-495. The alignments of the other loop ramps in this interchange would be upgraded, and the profile of Braddock Road would be raised slightly to provide for the minimum vertical clearance between the Beltway and Braddock Road. The horizontal alignment of Braddock Road would remain the same as the existing alignment. To allow for direct access to and from the HOV lanes on I-495 at Braddock Road, access ramps would be provided. These ramps, located in the center of the interchange, would facilitate movement of HOV traffic in all directions. Traffic signalization would be required to maintain proper traffic flow. The pedestrian bridge from Americana Drive to Wakefield Park located north of the Braddock Road interchange would be replaced due to the widening of I-495. Little River Turnpike. Interchange Concept B, a partial cloverleaf, was carried forward for detailed evaluation in the Draft EIS but eliminated from the Preferred Alternative. In an effort to minimize the impact of improvements to this interchange on the surrounding community, several of the interchange improvement concepts originally identified prior to the Draft EIS as reasonable alternatives for further study were also reconsidered. Concept B. To reduce weaving problems that occur on the C-D roadways at the existing interchange, the loop ramp carrying traffic from northbound I-495 to westbound Little River Turnpike and the loop ramp carrying traffic from southbound I-495 to the eastbound direction would be removed in order to reduce weaving problems that occur on the C-D roadways at the existing interchange. Left turn lanes from the I-495 exit ramps would replace the movements previously provided by these ramps. For proper control of traffic, signalization would be provided along Little River Turnpike at the two locations described. By eliminating the loop ramps, improvements would be made to the alignments of the eastbound ramp from Little River Turnpike to southbound I-495, and the westbound ramp from Little River Turnpike to northbound I
117 Alternatives Capital Beltway Study The horizontal alignment of Little River Turnpike would match the existing alignment, and the profile would be raised to maintain the required minimum vertical clearance with I Alignment adjustments would also be required for Lafayette Village Drive, Americana Drive, and Accotink Parkway. Concept B was ultimately eliminated in favor of a Preferred Concept that would lessen the impact of improvements at the Little River Turnpike interchange on the surrounding community. Other Interchange Options Considered. An interchange design similar to Concept D, except with the ramp in the northeast quadrant redesigned to flyover the proposed loop ramp in that quadrant in an effort to minimize impacts, was also considered and eliminated. Concept E, which had been dropped prior to publication of the Draft EIS, was ultimately selected for inclusion in the Preferred Alternative and is described in Section above. Gallows Road. Two options for the Gallows Road interchange were carried forward for detailed evaluation in the Draft EIS: Concept A, a revised version of which was selected as the Preferred Concept and is described in Section above, and Concept C. Concept C. This concept involved a full diamond interchange at Gallows Road. The concept would require traffic signals at the ramp intersections on either side of the Beltway and at the reconfigured Woodburn Road intersection. Due to widening at the interchange, portions of Luttrell Road require would alignment modifications under this concept. Other Interchange Options Considered. In addition, a Revised Concept A was developed and considered after the publication of the Draft EIS in an attempt to further reduce the impact of proposed interchange improvements at Gallows Road. This concept would be similar to the original Concept A, except that the loop ramp would be upgraded to a much higher design speed and the intersection with Woodburn Road improved. Due to the additional impacts that the Woodburn Road intersection improvements would cause in the northwest quadrant of the interchange and along Woodburn Road, Revised Concept A was eliminated, and the original Concept A was retained as the Preferred Concept. Arlington Boulevard. Interchange Concept A, which was carried forward for detailed evaluation, was retained as the Preferred Concept for the Arlington Boulevard interchange. Interstate 66. Three general options for the I-66 interchange were carried forward for detailed evaluation in the Draft EIS, all of which were eventually eliminated in favor of a Preferred Concept similar to the existing interchange footprint. Concepts A and B would be a directional interchange with full movements and I-66 reversible HOV lanes on the north. Concept A would apply only to the Concurrent HOV mainline alternative; Concept B would be identical in design and would apply to all other mainline alternatives. Concept C would be a directional interchange with partial (existing) SOV movements, full HOV movements, and I-66 reversible HOV lanes on the north. Concept E would be a directional interchange with full movements and I-66 reversible HOV lanes on the south. Concept A. This proposed interchange would provide for full movement of traffic between the two interstate highways, whereas the existing interchange excludes two movements: southbound I-495 to eastbound I-66 and westbound I-66 to northbound I-495. The design 2-57
118 Capital Beltway Study Chapter 2 now provides for direct access from the express, local, and HOV lanes of the Beltway to I-66 as well as the movement from I-66 to the express, local, and HOV lanes of the Beltway. This design would accommodate the widest typical section for I-66 proposed in the I-66 MIS. Regarding the HOV facilities inside (east of) the Beltway, the current operation of I-66 as a peak direction HOV facility would remain unchanged. Outside (west of) the Beltway, the I-66 interchange design would have two reversible HOV lanes that operate eastbound in the morning and westbound in the afternoon. The reversible HOV lanes would be located in the middle of I-66 on the north side of the Metrorail tracks. Inside the Beltway, the reversible roadway would be connected to eastbound I-66 via a fly-over ramp crossing the Metrorail bridge. In the westbound direction, a two-lane gated exit immediately west of the Beltway and east of Gallows Road would connect I-66 to the reversible roadway. Direct fly-over ramps would facilitate the movement of traffic between I-66 and I-495. The highest ramp would carry the westbound I-66 traffic to southbound I-495, and the high point would be located on the west side of the Beltway. The ramp carrying westbound I- 66 traffic to northbound I-495 would cross over the Beltway and under I-66 before merging with the northbound roadways, while the ramps carrying southbound I-495 traffic to eastbound I-66 and northbound I-495 traffic to westbound I-66 would be positioned in the middle. This interchange design is compatible with the I-495 Concurrent HOV and Barrier-Separated HOV Alternatives evaluated in the Draft EIS. A number of roadways and bridges in the vicinity of this interchange would have to be relocated and/or replaced to accommodate the proposed widening and to provide for required vertical clearance. These roadways include Shreve Road, Lee Highway (Route 29), Gallows Road, Virginia Lane, Barbour Road, Idylwood Road, Oak Street, and the Washington and Old Dominion Trail. The new bridges would be longer and slightly higher than the existing bridges. At Lee Highway and Gallows Road, the bridges would also be widened to accommodate anticipated future expansion. Concept B. This proposed interchange would provide for full movement of traffic between the two interstate highways, whereas the existing interchange excludes two movements: southbound I-495 to eastbound I-66 and westbound I-66 to northbound I-495. The design now provides for direct access from the express, local, and HOV lanes of the Beltway to I- 66, as well as the movement from I-66 to the express, local, and HOV lanes of the Beltway. Inside the Beltway, current operation of I-66 as a peak direction HOV facility would remain unchanged. Outside the Beltway, the I-66 interchange design would have two reversible HOV lanes that operate eastbound in the morning and westbound in the evening during the peak periods. The reversible HOV lanes would be located in the middle of I-66 on the north side of the Metrorail tracks. Inside the Beltway, the reversible roadway would be connected to eastbound I-66 via a fly-over ramp crossing the Metrorail bridge. In the westbound direction, a two-lane gated exit immediately west of the Beltway and east of Gallows Road would connect I-66 to the reversible roadway. Similar to Concept A, direct fly-over ramps would facilitate the movement of traffic between the two interstate highways. The highest ramps would carry the westbound I-66 traffic to southbound I-495 and the eastbound I-66 traffic to northbound I-495. The high 2-58
119 Alternatives Capital Beltway Study points of these ramps would occur on the northwest and northeast quadrants of the Beltway. The ramp carrying the westbound I-66 traffic to northbound I-495 would cross over the Beltway, the HOV ramps, and I-66 before merging with the C-D roadways and express northbound I-495 roadways. The ramps carrying southbound I-495 traffic to eastbound I-66 and northbound I-495 traffic to westbound I-66 would be positioned in the middle. This interchange design is compatible with both the Express/Local with HOV and Barrier-Separated HOV Alternatives evaluated in the Draft EIS. A number of roadways and bridges in the vicinity of this interchange would have to be relocated and/or replaced to accommodate the proposed widening and to provide for required vertical clearance. These roadways include Shreve Road, Lee Highway (Route 29), Gallows Road, Virginia Lane, Barbour Road, Idylwood Road, Oak Street, and the Washington and Old Dominion Trail. The new bridges would be longer and slightly higher than the existing bridges. At Lee Highway and Gallows Road, the bridges would also be widened to accommodate anticipated future expansion. Concept C. This design is similar to Concepts A and B, except for the two missing movements that would serve non-hov traffic: the southbound I-495 to eastbound I-66 and the westbound I-66 to northbound I-495. In other words, this design would provide for all traffic movements currently available between the two interstate facilities, plus HOV access in all directions. This interchange design is compatible with the three mainline alternatives evaluated in the Draft EIS. Concept E. Depending on the Beltway typical section, the traffic movements in this interchange design are similar to Concepts A and B. However, this concept differs from all the other concepts considered in the Draft EIS in that the reversible HOV lanes on I-66, outside the Beltway, would be located on the south side of the Metrorail tracks. The reversible lanes would merge into eastbound I-66 to facilitate the movement of HOV traffic in the morning peak period. In the afternoon, a two-lane exit ramp crossing over the Metrorail bridge would connect westbound I-66 inside the Beltway with the reversible lanes outside the Beltway to facilitate the HOV movements in the evening. Although the reversible HOV lanes and one HOV ramp would merge with eastbound I-66 at a single location inside the Beltway, the design could be modified to have two separate merges to reduce the cost of the interchange. The reversible lanes could merge with eastbound I-66 immediately outside the Beltway, and the HOV ramp could merge with I- 66 eastbound inside the Beltway. The westbound connection with the reversible lanes would take place immediately west of the Beltway and east of the Gallows Road Bridge over I-66. This interchange design is compatible with the three mainline alternatives evaluated in the Draft EIS. Leesburg Pike. Concept B, a directional interchange, was carried forward for detailed evaluation in the Draft EIS but later eliminated in favor of a Preferred Concept with fewer impacts on the surrounding community. Concept B would replace all the loops of the existing Leesburg Pike interchange with direct ramps, except for the loop in the southwest quadrant. The southwest loop ramp, which provides for southbound Beltway and northbound Route 123 traffic headed east on Leesburg Pike, would be retained. 2-59
120 Capital Beltway Study Chapter 2 Concept B would provide connections for all destinations currently available via the Beltway. Due to the proximity of Route 123, only access to the northbound Beltway would be provided in the vicinity of Route 123. However, Route 7 traffic headed to Route 123 would be able to access directly the Beltway ramps to Route 123, without using the local or express mainline Beltway roadways. Similarly, northbound Route 123 traffic headed to Route 7 would access the ramps to Route 7 without using the Beltway roadways. Direct access between these two interchanges would be made possible by the construction of two viaducts running parallel to and on top of the southbound local roadways and northbound exit ramp, thereby eliminating the merging and weaving that would prevail if the mainline Beltway were used for those movements. Southbound traffic from Route 123 to southbound I-495 would access Route 7 via the local lanes of the Beltway. The profile of Route 7 crossing over the Beltway would be raised both to accommodate the widening of the Beltway and to maintain the minimum clearance over it. The widening of Route 7 in the vicinity of the interchange would require reconstruction or closure of a number of driveways and entrances on both sides of the Beltway. Furthermore, reconstruction of the Kidwell Bridge over Route 7, immediately west of the Beltway, as well as portions of Magarity Road east of the Beltway, would be required. Chain Bridge Road. Interchange Concept C was carried forward for detailed evaluation in the Draft EIS but was later eliminated in favor of a Preferred Concept with fewer impacts on the surrounding community. Concept C would be a partial cloverleaf with center HOV access and directional (flyover) ramps for northbound Beltway to southbound Chain Bridge Road and northbound Chain Bridge Road to northbound Beltway traffic. This concept would provide for the proposed extension of Metrorail through the interchange. Concept C. Under Concept C, the loop ramps for northbound I-495 to southbound Route 123 and the northbound Route 123 to northbound I-495 movements would be replaced with direct fly-over ramps, and the two loops on the northwest and southwest quadrants retained. The radii of the loops, although smaller than the existing ones, would meet current design criteria. Direct ramps from Route 7 and the northbound lanes of the Beltway to southbound Route 123, and from northbound Route 123 to Route 7 and the southbound express and C-D lanes of the Beltway, would eliminate weaving movements that would otherwise occur on the mainline Beltway. As noted previously, these ramps, which would be located on two viaducts running parallel to the Beltway, (one on top of the southbound C-D lanes and the other on top of the exit ramp from the northbound roadway), would facilitate the direct access between the roadways. Direct access to and from HOV lanes on I-495 at Route 123 would be provided by center access depressed ramps. These ramps would provide for the movement of HOV traffic in all directions to and from Route 123. They would connect to Route 123 in the middle of the interchange where I-495 crosses over Route 123. A traffic signal would be required at this location to allow for orderly turning movements to and from the Beltway. The profile of I-495 would be raised in the interchange area to provide the minimum clearance required where I-495 crosses Route 123. The horizontal alignment of Route 123 would remain the same as the existing alignment and is designed to accommodate its 2-60
121 Alternatives Capital Beltway Study future expansion. The Tysons Corner Connector overpass crossing Route 123 immediately west of the Beltway would be reconstructed to allow for the widening of Route 123 and the ramps to and from the Beltway. The new bridges would be built slightly wider than required to better accommodate the maintenance of traffic during construction. Other Interchange Options Considered. In addition to the Preferred Concept selected for inclusion in the Preferred alternative, two additional interchange options were developed after the publication of the Draft EIS in an effort to reduce the impact of improvements to the Chain Bridge Road interchange on the surrounding community. Option 1 would be similar to the Preferred Concept, except that instead of replacing the existing loop ramp in the northeast quadrant with left turn lanes, it would be replaced with a flyover ramp. However, this flyover ramp interfered with the proposed extension of Metrorail through the interchange and was therefore eliminated. Like Option 1, Option 2 would replace the existing loop ramp in the northeast quadrant with a flyover ramp. However, Option 2 would not include the modified loop ramp in the southwest quadrant, and therefore would not address the weave issues along southbound I This concept also interferes with the proposed extension of Metrorail through the interchange. For both of these reasons, Option 2 was eliminated. Dulles Access/Toll Road. Concepts B and E were carried forward for detailed evaluation in the Draft EIS but were later eliminated in favor of a Preferred concept with fewer impacts to the surrounding community. Concept B involved a directional interchange with HOV access and a flyover ramp for eastbound Dulles Access/Toll Road traffic to and from the Beltway. Concept E involved a directional interchange with HOV access with dual flyover ramps for Dulles Access/Toll Road traffic and realignment of the Beltway. Both of these interchange options would include direct access to the HOV lanes on the Dulles Access/Toll Road. Concept B. The general configuration of this interchange in terms of traffic movements would remain essentially unchanged. The two current missing movements, northbound I- 495 to eastbound Route 267 and the reverse movement from westbound Route 267 to southbound I-495, would still be omitted for both HOV and non-hov traffic. The left exits from the express roadways would be dedicated to HOV traffic only. For non-hov traffic in the northbound direction, a right exit from the express roadway and a left exit from the local roadway would provide access to westbound Route 267. For non-hov traffic in the southbound direction, one right exit would provide access to both westbound and eastbound Route 267. Access for Route 267 traffic to northbound I-495 would be provided via the C-D roadways, and access for eastbound Route 267 traffic to southbound I-495 would be provided to both the C-D and express lanes. Direct HOV access would be provided between the Beltway and Route 267 to the west; however, direct HOV access to the east would be provided only from the southbound Beltway. HOV access from the east would be provided only to the northbound Beltway and only via the C-D lanes. This concept would allow for the movement of traffic between the Beltway and the Dulles Airport Access/Toll Road via both the HOV and non-hov ramps. 2-61
122 Capital Beltway Study Chapter 2 The Beltway profiles over the Dulles Airport Access/Toll Road would be slightly raised to provide for the required minimum vertical clearance. North of Route 267, reconstruction of Lewinsville Road and Old Dominion Drive bridges and approaches would be required to allow for the proposed I-495 mainline improvements. Concept E. This design concept is similar to Concept B in that Concept E would provide for all the movements currently allowed at this interchange to be maintained. However, there are several major differences in the layout of this design compared to Concept B: The southbound Beltway would be shifted to the east closer to the northbound Beltway, resulting in a smaller footprint. The shift would eliminate the right-of-way impact in the southwest quadrant of the interchange. Under Concept E, a loop ramp would replace the fly-over ramp from the southbound Beltway to eastbound Route 267, resulting in a somewhat longer weaving distance on eastbound Route 267 than under the Concept B design. The westbound Route 267 roadway between Route 123 and the Beltway would be reconfigured to eliminate the existing weaving movements in this segment of the roadway. The off ramp from southbound Route 123 would be split into two separate roadways: one for traffic headed to westbound Route 267 and one for traffic headed to the northbound Beltway. A left exit fly-over ramp from Route 267, before its merge point with the on ramp from Route 123, would be provided to facilitate the movement of traffic headed to the northbound Beltway. The two ramps carrying traffic headed for the northbound Beltway would merge first before merging with the C-D lanes of the Beltway. This configuration could be incorporated into Concept B as well. HOV access to westbound Route 267 from southbound I-495 would be provided via a direct fly-over ramp. Under Concept B, this movement would be provided via a loop ramp. This design would not provide direct HOV access from the southbound Beltway to eastbound Route 267. HOV traffic would access eastbound Route 267 via the general-purpose roadways and ramps. Georgetown Pike. Concept A, an improved diamond interchange, was carried forward for detailed evaluation in the Draft EIS. This concept involved minor modifications to the existing interchange configuration, including the widening of the Georgetown Pike overpass and ramps to meet traffic demand and to improve operation, and a longer and slightly higher bridge to accommodate the widening of the Beltway and to ensure the required minimum vertical clearance over the Beltway. However, this concept was later eliminated in favor of a Preferred Concept with fewer impacts on the surrounding community. George Washington Memorial Parkway. The George Washington Memorial Parkway begins at the Beltway near Great Falls and travels southeastward along the Potomac River 2-62
123 Alternatives Capital Beltway Study through McLean, Arlington, and Alexandria to Mount Vernon into southeast Fairfax County. It serves as a commuter route during the peak periods for traffic from both Maryland and Virginia to the District of Columbia. Throughout the day, it serves as a convenient route connecting Arlington and Alexandria to Maryland. Concept A, an improved trumpet, was carried forward for detailed evaluation in the Draft EIS. This concept would involve minor modifications would be made to the existing interchange configuration. A portion of Live Oak Drive and the bridge over I-495 may need to be reconstructed to accommodate the widening of the Beltway. The ramp from northbound I-495 to the southbound George Washington Parkway would be widened to two lanes, and the ramp from the northbound George Washington Parkway would be slightly modified to provide for an improved alignment. However, unlike the Candidate Build Alternatives considered in the Draft EIS, the Preferred Alternative ties into the existing Beltway south of the George Washington Parkway interchange. Therefore, no improvements to this interchange are included in the Preferred Alternative HOV Direct Access Points All of the HOV direct access points evaluated in the Draft EIS were incorporated into the various interchange improvements included in the Preferred Alternative. None of these direct access points has been eliminated Other Alternatives Considered and Eliminated As a result of the alternatives refinement and screening that occurred prior to publication of the Draft EIS, several of the original improvement concepts were eliminated from further consideration and were not carried forward in the environmental process as reasonable alternatives. In addition, two new configurations were considered after the publication of the Draft EIS at the suggestion of the Environmental Defense Fund; however, these were ultimately determined unfeasible and eliminated as well. Reasons for elimination varied; only the bestperforming concepts were retained at each stage of the screening process. The concepts dropped from further study and the rationale behind their elimination is summarized below Conversion of Existing Lanes to HOV or HOT Based on comments on the Draft EIS by the Environmental Defense Fund, the potential to convert existing Beltway general-purpose lanes to HOV or HOT lanes, with or without adding additional capacity, was investigated. Two variations of this configuration were considered: Alternative. This alternative would involve the conversion of one existing lane in each direction to HOT lanes. No additional capacity would be added Alternative. This alternative would also involve the conversion of one existing lane in each direction to HOT lanes, and would also add one new HOT lane in each direction. 2-63
124 Capital Beltway Study Chapter 2 However, after further evaluation, both of these alternatives were dismissed from further evaluation because: Projected demand exceeds the capacity to handle traffic without congestion lasting for most of the day resulting in significant diversion of trips to the adjacent street network (especially with the alternative where capacity on the single HOV/HOT lane would be quickly used up, negating any benefit it would provide when compared to the general purpose lanes). Due to the close spacing of interchanges and origin destination patterns in Northern Virginia, lane changing and weaving movements would result in significant speed reductions in the HOT lanes when compared to alternatives that maintain four general purpose lanes in each direction. Converting general purpose lanes to special use lanes has not been well received in Virginia and elsewhere throughout the country (most recently in Minneapolis). A public backlash could easily undermine an otherwise successful project. With the Preferred Alternative, if the HOT lanes are well utilized the Beltway could be re-striped in the future to provide three general purpose lanes and three HOT lanes in each direction. Lastly, neither of these two alternatives were determined to be fundamentally different (e.g., location/configuration; operations or impacts) from the preliminary alternatives developed during the Draft EIS. Nor did either satisfy the project s Purpose and Need as well as the revised Candidate Build Alternatives discussed in this Final EIS; these alternatives actually congest the Beltway and are ineffective at removing cut-through traffic from the adjoining and parallel road network, contrary to one of the components of the purpose and need Rail Transit The feasibility of circumferential rail, parallel to the existing Beltway, has been analyzed extensively in a number of studies, including MISs performed in both Virginia and Maryland. The MIS analyses included studying the potential for a circumferential rail system running the entire length of the Beltway. It was concluded that rail transit alone cannot fully meet future travel demand or provide the design and operational enhancements needed to increase Beltway capacity and safety. In 1997, VDOT concluded the Capital Beltway MIS with a recommended multi-modal strategy for further consideration. The recommendation was comprised of two components: Lane management strategies in the Beltway Corridor that support high occupancy vehicles and bus transit use, and Rail transit planning for connectivity of radial lines. The MIS recommended that each component be studied separately, in parallel, by the appropriate agencies. Hence, the Capital Beltway Study (EIS Phase) and the Capital Beltway Corridor Rail Feasibility Study were undertaken. The studies were launched with the direction that any widening 2-64
125 Alternatives Capital Beltway Study of the Capital Beltway should be constructed so as not to preclude transit in the corridor and the development of transit should not prevent widening of the Beltway. The rail feasibility study also concluded that the effect of introducing rail transit in the corridor does not eliminate the need for roadway improvements. A summary of the Capital Beltway Corridor Rail Feasibility Study is included in Chapter 2 of the Draft EIS Express Bus Service The MIS analyses also evaluated express bus services in the Beltway Corridor, but it was concluded that the implementation of such services alone would not preclude the need for other improvements to the Beltway. For express bus service to be effective, highway facilities that provide higher-speed routes would be needed to ensure travel time saving during peak hours. It is clear that neither the existing Beltway nor any other nearby highway is capable of providing such a route. Though not effective as a stand-alone alternative, expansion of available express bus services is nevertheless desirable. Alternatives that feature HOV facilities would provide the necessary high-speed route to make such services more viable and attractive to potential users. A number of new bus routes and operational assumptions were developed to test the effects of Beltway express bus service on regional travel demand and Beltway traffic volumes. The results indicated that if improvements contained a managed lane or lanes (HOV or HOT), then express bus service could be implemented, but would be the responsibility of others. Express bus service on I-495 has been included in the 2000 Long Range Transportation Plan for the National Capital Region for implementation by Transportation System Management The MIS analyses included examining various strategies to manage the existing transportation system more effectively, such as increased enforcement, additional driver education, and new technologies to improve traffic flow. These strategies were determined to be ineffective in reducing congestion or improving mobility on the Beltway. Transportation control measures to reduce trip generation and transportation demand management measures to reduce travel demand were also evaluated and were found to have only a minimal effect on overall Beltway traffic volumes and travel demand. A more capital-intensive Transportation System Management (TSM) Alternative was developed and evaluated as part of the NEPA process to determine if there were viable alternatives to expanding the Beltway. The TSM Alternative would involve actions designed to improve traffic operations and maximize the efficiency of the existing roadway network, such as upgrading existing arterial roadways, providing new or additional turning lanes, optimizing traffic signal timing, and enhancing the regional bus system. Evaluation of traffic, operational, safety, and environmental factors showed that implementing the TSM Alternative alone would not meet the project s purpose and need. Though not effective as a stand-alone alternative, some TSM elements would nevertheless be beneficial as part of the Beltway improvements. Some elements were incorporated into the various build alternatives, and others could become components of an overall 2-65
126 Capital Beltway Study Chapter 2 transportation plan for the region that would be evaluated as independent projects in separate studies when more definite proposals are made Beltway Mainline Configurations Several levels of screening were developed to identify mainline configurations that would reasonably increase Beltway capacity and improve operations without causing unacceptable community and environmental disruption by requiring significant land outside of the existing right-of-way. As a result, 11 of the mainline alternatives shown in Table 2-2 were eliminated from detailed consideration in the Draft EIS. The reasons for their elimination are discussed in detail in the Alternatives Development Technical Report and are summarized below. Non-HOV Roadway Concepts. Concepts that did not include HOV lanes were eliminated from further consideration because construction of Beltway improvements without HOV lanes would preclude completion of the regional HOV system; would preclude or prevent effective express bus operations on the Beltway; would not be consistent with state, regional, and local land use and transportation plans; would provide 25 percent less person-capacity in this highly congested corridor; would increase travel times for HOV and express bus traffic; and would introduce operational and safety problems, including additional merges and weaves between the Beltway and intersecting roadways with dedicated HOV lanes. Single-Lane Barrier-Separated Roadway Concepts. Concepts that included only a single barrier-separated HOV lane in each direction were eliminated from further consideration because the cost of required infrastructure improvements (e.g., direct access ramps, shoulders, and barriers) would be high relative to the modest improvements in capacity and operations they would provide. A single-lane separated HOV system would require infrastructure investments similar to those required for a two-lane separated HOV system or an express/local system with HOV, yet would not provide the same benefits of these concepts. In addition, a single-lane barrier-separated configuration would be the least flexible for future roadway modifications and for incident or accident management; would not allow vehicles to pass one another; could be rendered inoperable by a minor accident or incident which may not be cleared expeditiously; and would require pavement widths approaching those of a two-lane system to meet current AASHTO standards. Roadway Concepts with Two Express Lanes. Concepts that included only two express lanes were eliminated from further consideration because of the operational and safety problems arising from having only one express lane in each direction for general-purpose traffic (the other lane would be reserved for HOV traffic). A single lane for all generalpurpose express traffic is insufficient to meet projected demand and would result in an imbalance between the local and express roadways. Moreover, this configuration would not meet the standards of a freeway (which requires two or more lanes in each direction for all traffic). An incident or accident in a non-hov express lane would block the entire express roadway, and additional slip ramps would be required. Express/Local with HOV Roadway Concepts. The 10- and 12-lane express/local configurations on the Beltway were consolidated to create an optimized Express/Local with 2-66
127 Alternatives Capital Beltway Study HOV alternative. It was determined that the 12-lane option provided some additional capacity in the local lanes, but did not perform substantially better than the 10-lane alternative. The 12-lane concept also had the largest footprint of any configuration considered and required additional lanes (collector-distributor roadways) at several interchanges. These additional lanes and short weaving distances in several locations would reduce the safety and operating efficiency of the roadway. Therefore, the decision was made to begin the design of the Express/Local alternative with two local and three express lanes in each direction, which were continuous throughout the corridor. Subsequently, locations were identified where an additional express or local lane could be implemented to improve operational performance without the environmental effects caused by the 12-lane alternative. The final Express/Local Alternative is neither the original 10- or 12-lane option, but a hybrid which optimizes the lane balance and continuity throughout the entire corridor, while minimizing the environmental impacts of this type of configuration Interchange Improvement Options Each of the 44 interchange concepts listed in Table 2-3 was evaluated for their traffic operations, safety, engineering considerations, and potential environmental impacts during the development of the Draft EIS. Concepts were eliminated at various stages of the alternatives development process, although several were re-evaluated after the Draft EIS in an effort to reduce impacts in the vicinity of interchanges. A summary of the reasons that the concepts were dismissed is provided below. Further details are provided in the Draft EIS Alternatives Development Technical Report. Braddock Road Interchange. Interchange Concepts A, B, C, and D for the Braddock Road interchange were dropped. Concepts A, B, and C, all full cloverleaf designs, were dropped because they would not provide sufficient capacity to service the design hour or peak period demand. The high weaving volumes northbound on the mainline would cause lowered throughput past Braddock Road during both peak periods. Due to the high traffic volumes, vehicles would not be able to enter and exit the Beltway in the short merging area between the loop ramps. This, in turn, would result in back-ups along the Beltway itself. Concept A also included a northbound-to-westbound flyover with the full cloverleaf; however, not enough vehicles could use the flyover due to their destination. Therefore, the heavy northbound weave on the mainline remains. Concept D, which included elevated ramps to/from the Beltway HOV lanes, was dropped because of the HOV ramps' effects on Braddock Road traffic operations and environmental (visual) impacts to the surrounding community. This concept would also eliminate direct access to the Ravensworth Industrial Park for HOV traffic; instead, vehicles would have to make a U-turn at Inverchapel Road. Little River Turnpike Interchange. Six concepts considered for the Little River Turnpike interchange were dropped: A, C, D, E, F, and G. Concepts A, D, E, and F would require additional right-of-way and would have insufficient weaving capacity to handle projected traffic volumes. As a result: Concept A would fail southbound on the Beltway and westbound on Little River Turnpike. 2-67
128 Capital Beltway Study Chapter 2 Concept D would fail northbound and southbound on the Beltway and eastbound and westbound on Little River Turnpike. Concept E would fail northbound and southbound on the Beltway and eastbound and westbound on Little River Turnpike. Concept F would fail northbound on the Beltway and westbound on Little River Turnpike. Concept C, a single-point diamond design, could provide sufficient capacity, however two left-turn lanes would be required for the eastbound Little River Turnpike to northbound Beltway movement. This would require realignment and further widening of Little River Turnpike and the structure crossing the Beltway. Concept G, a non-traditional interchange design for urban interstates, would not provide sufficient capacity. This concept would require three roadway levels and additional ramps or pavement to serve the heavy right-turn volumes. However, in an effort to minimize the impacts of interchange improvements at Little River Turnpike on the surrounding community, Concept E was revisited subsequent to the publication of the Draft EIS and ultimately selected as the Preferred Concept. Gallows Road Interchange. Concept B for the Gallows Road interchange was dropped because of excessive environmental impacts in the southwest quadrant of the interchange (due to an additional loop ramp that would not markedly improve traffic operations). This concept would also introduce a weave on the southbound Beltway, which is not present today. I-66 Interchange. Concepts D, F, and G considered for the I-66 interchange were dropped or consolidated. Concept D would have insufficient weaving capacity to handle projected traffic volumes at two locations due to lack of access to/from I-66 for vehicles traveling in the express lanes. Vehicles from the southbound express lanes would have to weave across the local lanes to access the ramp to I-66, while local vehicles would attempt to move to the express lanes. A similar situation would occur as entering I-66 traffic would attempt to access the Beltway express lanes. Concepts F and G were dropped after they were revised to accommodate vertical alignments and constructability issues. Concept F was dropped because it would be similar to Concept B; Concept G was dropped because it would be similar to Concept E. Leesburg Pike Interchange. Concepts A, C, D, and E considered for the Leesburg Pike interchange were dropped or consolidated. Concepts A, C, and D were all similar to Concept B. Concept E would have a failing weave on westbound Leesburg Pike. Also, the northbound to westbound loop ramp in Concept E would not provide sufficient capacity for that movement. Chain Bridge Road Interchange. Seven concepts considered for the Chain Bridge Road interchange were dropped or consolidated: A, B, D, E, F, G, and H. Concept A was dropped because the vertical alignment for the directional ramp from northbound I-495 to southbound Chain Bridge Road would conflict with the proposed Metrorail vertical alignment. The Metrorail alignment would have to be relocated approximately 125 meters north of Route 123 to make it compatible with this interchange concept. In addition, Concept A would provide 2-68
129 Alternatives Capital Beltway Study less storage capacity and slower ramp speeds than Concept C, which was retained. Concepts B, D, and G were similar to Concept A and were dropped for the same reasons. Concepts E, F, and H would have insufficient weaving capacity to handle projected traffic volumes. As a result: Concept E would fail on the roadway servicing vehicles traveling from eastbound and westbound Route 123 to the northbound Beltway and westbound Dulles Toll Road. Concepts F and H would fail on the northbound mainline roadway, south of the interchange. Dulles Access/Toll Road Interchange. Three interchange concepts considered for the Dulles Access/Toll Road interchange were dropped or consolidated during the alternatives screening process. Concept A was similar to Concept B, which would provide an additional connection from the Dulles Access lanes directly onto the local lanes of the Beltway. For analysis purposes, Concept A was dismissed. Concept C was a modification of Concept B, and would have the same operational characteristics. The modification was intended to remove Concept B s right-of-way impact to the residences in the northwest quadrant of the interchange. However, it would result in additional commercial right-of-way impacts. Through refinement, Concept B would no longer affect the residential property. Therefore, Concept C was eliminated. From an operational, capacity, and safety standpoint, Concept D was dropped from further consideration because it would result in an interchange inferior to the existing one. It would introduce weave conditions on the Beltway and the Dulles Access/Toll Road, and would be designed with substandard loop radii and insufficient weave lengths. Georgetown Pike Interchange. Concept B, a partial cloverleaf for this interchange was dropped from further consideration because it: Would increase residential impacts compared to Concept A. Would connect a Beltway ramp to a local street. Would have an at-grade street crossing on a ramp. Would introduce a weave on Georgetown Pike. Was strongly opposed at the Citizen Workshops. 2-69
130 Capital Beltway Study Chapter
131 3 AFFECTED ENVIRONMENT This chapter characterizes the existing social, economic, and environmental setting potentially affected by the Beltway improvement alternatives outlined in Chapter 2. First, a discussion regarding how potential environmental issues were identified is presented. Next, information on land use, socioeconomics, natural resources, parklands, noise, air quality, historic resources, visual characteristics, and hazardous materials is presented. Effects on these resources are discussed in Chapter 4. Finally, an overview of other activities occurring in the project area is presented. This information provides the context within which cumulative effects are discussed in Chapter ISSUES IDENTIFICATION Consistent with Council on Environmental Quality (CEQ) regulations implementing the National Environmental Policy Act of 1969 (NEPA), this document focuses on the most important environmental issues, and de-emphasizes less important issues (40 CFR (d)). The environmental issues were identified based on input from citizens recorded at a number of public information meetings, comments from agencies during the scoping and interagency review process, mapping and aerial photography from various sources, other existing data sources, and visual observations of human and natural resources in the corridor. See Chapter 7 for discussion of public and agency coordination. Table 3-1 lists several environmental issues with remarks indicating their relevance to the project. Some issues involve resources that receive a relatively high level of protection under environmental laws and regulations. Others were identified by the public as important, or particularly sensitive to potential adverse effects. Some of the issues involve resources likely to experience only minor effects from the proposed project and some involve resources that are not present in the corridor, or that have only a limited presence in the corridor. 3.2 LAND USE Current Land Use Fairfax County encompasses 399 square miles (1,033 square kilometers). Over the past 50 years, Fairfax County has changed from a primarily rural and agricultural area to an 3-1
132 Capital Beltway Study Chapter 3 Table 3-1 ENVIRONMENTAL ISSUES Issue Noise Home Displacements, Community Impacts, Property Damage Air Quality Remarks By far, the most frequently expressed concern of citizens. Numerous residences and recreation areas along corridor. Existing noise walls. Frequently expressed concern of citizens. Numerous homes and neighborhoods in proximity to the Beltway. Frequently expressed concern of citizens. Comments from U.S. Environmental Protection Agency, Virginia Department of Environmental Quality, and Environmental Defense. High traffic volumes in congested area with numerous points of human exposures (residential yards, schools, and other outdoor activity areas). Region is nonattainment for ozone and fine particulate matter. Parks and Recreation Areas Important parks and recreational properties adjacent to corridor. Comments from local parks and recreation officials and from citizens. High level of protection under Section 4(f) regulations. Historic and Archaeological Resources Streams/Water Resources/Wetlands Vegetated Buffers Visual Impacts Lighting and Light Pollution Wildlife and Habitat Environmental Justice Populations Land Use/Secondary & Cumulative Effects Hazardous Material Sites Forest Land Farmland Public Water Supplies Navigable Waterways Endangered Species Scenic Rivers/Scenic Byways Coastal/Marine Resources One potential district and one archaeological site near the corridor. One historic resource (W & OD Railroad Regional Park) crosses the Beltway. High level of protection under Section 4(f) and Section 106 regulations. Mentioned by some citizens and by state and federal agencies. Wetlands are mostly marginal; many streams are heavily channelized and already influenced by surrounding urbanization. Nevertheless, high level of protection afforded under Clean Water Act and permits required for construction. Comments from the US Army Corps of Engineers, Federal Emergency Management Agency, and Virginia Department of Environmental Quality s Water Protection Permit Program. Mentioned by some citizens. Existing tree areas along right-of-way provide screen between the Beltway and adjacent neighborhoods. Mentioned by some citizens. Urbanized area with a few somewhat scenic visual attractions. Mentioned by some citizens. Urbanized area with lights from numerous sources other than Beltway. Urbanized area with few substantial blocks of natural habitat. Some populations present, but impacts not likely to be disproportionate. Mentioned by some citizens. Comments from U.S. EPA. Widespread perception that major highway improvements stimulate development. A number of sites containing potentially hazardous materials are situated along the Beltway. The potential human health effects of such materials and the potentially high costs of acquiring and cleaning up such sites make them a concern. This is an urban corridor with no substantial forest resources (but see issue regarding vegetated buffers). Comments from Virginia Department of Forestry. No prime farmland in Corridor. Comments from Virginia Department of Agriculture and Consumer Services and U.S. Natural Resources Conservation Service. No surface or groundwater public water supplies in corridor. Comments from Virginia Department of Health. None in Corridor. Comments from U.S. Coast Guard. No federally listed threatened or endangered species in corridor. Comments from U.S. Fish and Wildlife Service, Virginia Department of Agriculture and Consumer Services, Virginia Division of Natural Heritage, Virginia Department of Game and Inland Fisheries. None in corridor. Comments from Virginia Department of Conservation and Recreation. None in corridor. Comments from Virginia Institute of Marine Science. 3-2
133 Affected Environment Capital Beltway Study urbanized metropolitan area. The county, particularly the eastern portion, is now largely developed, and includes a mixture of low-density residential, commercial, industrial, and public land uses. About 54 percent of the land in Fairfax County is used for residences. Industrial and commercial land uses each account for almost four percent of the total developed acreage. Other major land uses include parklands (12 percent) and public facilities or institutions (11 percent). About 16 percent of the land in Fairfax County is now vacant or undevelopable open space. As shown in Figure 3-1, the distribution of land uses along the Beltway is similar to the land use distribution countywide, although offices and retail uses are more prevalent than in other areas. Some adjacent development predates the Beltway, but most of it was built after the roadway was constructed in the early 1960s. Commercial, industrial, and mixed uses tend to predominate near interchanges. Other land uses along the Beltway include parks and recreation areas, institutional land uses (schools, hospitals, and community facilities), public utilities, and transportation facility rights of way. There are more than 2,600 buildings within 500 feet of the Beltway. More than 88 percent are residences, primarily single-family detached dwellings. Another five percent are businesses or offices. Less than one percent is institutions or community facilities. Backlick Road to Gallows Road. Between Backlick Road and Gallows Road, most of the land along the Beltway is residential use, mainly in the form of single-family housing in established neighborhoods. Multi-family housing is concentrated near the Little River Turnpike interchange. Two industrial areas and a number of parks also lie along this section of the Beltway. Gallows Road to Interstate 66. Between Gallows Road and I-66 is a mixture of residential and commercial developments. Commercial uses are concentrated around the Arlington Boulevard interchange (Merrifield area). Residential uses, including single-family and multi-family housing, are interspersed among the commercial developments on both sides of the Beltway. Interstate 66 to Dulles Access/Toll Road. Between I-66 and Leesburg Pike, the predominant land use is residential, primarily low-density single-family housing. In recent years, infill residential development has occurred along the Beltway north of the I-66 interchange. This section also includes some multi-family housing and offices (near the Leesburg Pike interchange), parkland, and community facilities (Marshall High School). From Leesburg Pike to the Dulles Access/Toll Road, the Beltway runs through the Tysons Corner area. Land uses along this section are almost entirely office and retail, although there is some multi-family housing east of the Beltway. Dulles Access/Toll Road to the American Legion Bridge. Between the Dulles Access/Toll Road and the American Legion Bridge, the land use along the Beltway consists of lowdensity residential development, parklands, and private open space Land Use Plans and Future Land Use The Comprehensive Plan for Fairfax County and County ordinances guide land use planning in Fairfax County. The Plan, first adopted in 1975, was last updated in August The Comprehensive Plan for Area I, which includes the Annandale and Jefferson 3-3


 EXISTING LAND")

134 Capital Beltway Study Chapter 3 Legend: = Low Density Housing = High Density Housing = Commercial/Offices = Parks and Recreation = Mixed = Public Facilities, Governmental, and Institutional = Industry Begin Project Approximate Scale (Miles) EXISTING LAND USE I-95/I-395/I-495 Interchange to I-66 BLTWY093 Figure 3-1a (1 of 2) CAPITAL BELTWAY STUDY 3-4


")

135 Affected Environment Capital Beltway Study End Project 495 Legend: = Low Density Housing = High Density Housing = Commercial/Offices = Parks and Recreation = Mixed = Public Facilities, Governmental, and Institutional = Industry BLTWY Approximate Scale (Miles) EXISTING LAND USE I-66 to American Legion Memorial Bridge Figure 3-1b (2 of 2) CAPITAL BELTWAY STUDY 3-5
136 Capital Beltway Study Chapter 3 planning districts, was updated in Area II s Comprehensive Plan, which includes the Vienna and McLean planning districts, also was updated in The Plan has several components, including a policy plan, a land use classification system, and area plans for each planning district that contain specific development recommendations for vacant or underutilized lands. General land uses and development patterns planned for the county are shown in Figure 3-2. The proposed Beltway improvements cross portions of four Fairfax County planning districts: Annandale, Jefferson, Vienna, and McLean (see Figure 3-3). Based on the County s current land use plan, the established land use patterns in the districts along the Beltway are not expected to change substantially in the future. Most of these areas are already largely developed, and complete build-out is expected by As shown in Table 3-2 and Table 3-3, no major changes to current land use patterns or the distribution of land uses along the Beltway are indicated in future land use plans. The Comprehensive Plan calls for the continued urbanization of the Tysons Corner area, further development of suburban activity centers, maintenance of existing residential neighborhoods, and retention of the county s existing industrial base. Additional infill housing is anticipated in the Vienna and McLean planning districts (primarily in and around the Tysons Corner area), while the share of commercial land uses will increase in the Jefferson planning district (mostly in the Merrifield area). Table 3-2 CURRENT AND FUTURE LAND USE DISTRIBUTION BY PLANNING DISTRICT Annandale Planning District Jefferson Planning District Vienna Planning District McLean Planning District Land Use Residential 89% 91% 76% 78% 87% 93% 84% 94% Commercial 3% 3% 11% 14% 5% 5% 5% 5% Industrial 5% 6% 7% 8% 2% 2% 1% 1% Vacant 3% 0% 6% 0% 6% 0% 11% 0% Note: Figures represent share of total acreage for the three major zoning classifications and vacant developable land; parks, community facilities, and undevelopable open space or natural areas are not included in these totals. Source: Fairfax County Department of Management and Budget Activity Centers As Fairfax County has evolved from a residential suburb to a multi-faceted urbanized area, concentrations of land use and economic activity have developed throughout the county, mostly along major regional roadways, such as the Beltway, I-95, Arlington Boulevard, I- 66, and the Dulles Access/Toll Road. Two regional activity centers (Merrifield and Tysons Corner) and a local activity center (Ravensworth Industrial Park) are located just off the Beltway. The Beltway plays a major role in linking customers, suppliers, and employees to these activity centers. A number of smaller activity centers in Fairfax County, including the Annandale, McLean, and Vienna business districts, also rely partially on the Beltway for their economic viability. In addition, the Beltway carries portions of many trips to other regional activity centers beyond the limits of the study corridor, such as Springfield (via I- 95), Fairfax/Fair Oaks and Arlington/Falls Church (via I-66), Reston/Herndon (via the Dulles 3-6
137 Affected Environment Capital Beltway Study LOCATIONS OF MIXED-USE CENTERS Urban Center 1. Tysons Corner Urban Center Suburban Centers 2. Fairfax Center 3. Dulles (Route 28 Corridor) 4. Reston-Herndon 5. Merrifield 6. Flint Hill 7. Centreville 8. Lorton-South Route 1 Community Business Centers 9. McLean 10. Seven Corners 11. Baileys Crossroads 12. Annandale 13. Springfield (West) 14. Kingstowne 15. North Gateway and Penn Daw 16. Beacon/Groveton 17. Hybla Valley/Gum Springs 18. Woodlawn Transit Station Areas 19. Huntington Metro Station 20. Van Dorn Metro Station 21. Franconia/Springfield Metro Station 22. West Falls Church Metro Station 23. Dunn Loring Metro Station 24. Vienna Metro Station LOCATIONS OF LARGE INSTITUTIONAL AND INDUSTRIAL AREAS Industrial Areas 25. Beltway South 26. Ravensworth 27. I-95 Corridor Large Institutional Land Areas 28. Washington Dulles International Airport 29. George Mason University 30. Fort Belvoir (Main Post and Engineer Proving Ground) 31. Land Fill / Resource Recovery / Park 32. Water Authority Facility Washington Dulles International Airport I Sully Road Rt. 3 7 Lee Town of Herndon John S. Mosby Rt. 50 Rt Town of Clifton Georgetown Pike Rt. 193 Leesburg Pike Rt. 6 Dulles Airport Access Road 29 I-66 Fairfax County Parkway Chain Bridge Road City of Fairfax Ox Rd. Rt. 123 Town of Vienna Little River Turnpike Braddock Rd I Rt. 50 Rt. 620 Capital Beltway I-95 8 I-95 G.W. Memorial Pkwy Rt City of Falls Church Rt miles 30 9 Beulah St. SCALE County of Arlington 10 City of Alexandria Franconia Rd. Telegraph Rd Richmond Hwy Rt. 18 G.W. Memorial Legend: Suburban Neighborhoods (Residential density ranges defined in Area Plans; FAR* for neighborhood-serving non-residential use) Low Density Residential Areas (Residential density of 0.1 to 0.5 du/ac**, specific density ranges in Area Plan; Non-residential use intensity 0.05 to 0.1 FAR) Tysons Corner Urban Center Core ( FAR; du/ac) Non-core ( FAR; 8-45 du/ac Suburban Centers Core ( FAR; du/ac) Non-core ( FAR; 5-25 du/ac) Community Business Centers ( FAR; 5-25 du/ac; if a core is designated, intensities of up to 0.70 FAR may be allowed) Transit Station Areas ( FAR; 8-45 du/ac) Industrial Areas ( FAR for Industrial Uses) Large Institutional Land Areas * FAR - floor area ratio ** du/ac - dwelling units per acre Source: The Comprehensive Plan for Fairfax County and Amendments (1999) FUTURE LAND USE IN FAIRFAX COUNTY BLTWY033 Figure 3-2 CAPITAL BELTWAY STUDY 3-7
138 Capital Beltway Study Chapter Source: The Comprehensive Plan for Fairfax County and Admendments (1999) FAIRFAX COUNTY PLANNING AREAS AND DISTRICTS BLTWY032 Figure 3-3 CAPITAL BELTWAY STUDY 3-8
139 Affected Environment Capital Beltway Study Table 3-3 DEVELOPMENT POTENTIAL BY PLANNING DISTRICT Land Use Developed to Date Development Potential per Comprehensive Plan % of Build-Out Completed ANNANDALE Residential 8,934 acres 9,197 acres 97.1% Commercial 298 acres 305 acres 97.7% Industrial 498 acres 580 acres 85.9% Vacant 352 acres 0 acres 0 % JEFFERSON Residential 3,920 acres 4,055 acres 96.7% Commercial 595 acres 736 acres 80.8% Industrial 364 acres 387 acres 94.1% Vacant 299 acres 0 acres 0 % VIENNA Residential 8,895 acres 9,511 acres 93.5% Commercial 512 acres 556 acres 92.1% Industrial 212 acres 216 acres 98.1% Vacant 664 acres 0 acres 0 % McLEAN Residential 13,777 acres 15,401 acres 89.5% Commercial 734 acres 912 acres 80.5% Industrial 129 acres 147 acres 87.8% Vacant 1,820 acres 0 acres 0 % Note: Figures show total acreage for the three major zoning classifications and vacant developable land; totals do not include parks, community facilities, and undevelopable open space or natural areas. Source: Fairfax County Department of Management and Budget Access/Toll Road) and Montgomery County, Maryland (via I-270). Continued development of these activity centers and increases in employment are anticipated by Ravensworth Industrial Area. This mixture of warehouses, distribution facilities, and offices is a county-designated Industrial Area and a location for businesses that provide services or supplies to industrial companies, operate wholesale operations, or serve as warehouse/distribution facilities. The Ravensworth Industrial Area is already largely developed; currently it includes 25 businesses with more than 3,000 employees. Merrifield. Located between Gallows Road and I-66, Merrifield is a mixture of office, retail, and residential land uses in a cohesive setting, which allows residents to live near work places. It has about 7 million square feet of office space and 4 million square feet of industrial or hybrid space (more than 10 percent of the Fairfax County total). The Merrifield area is home to several major employers (Exxon Mobil, INOVA Fairfax Hospital), as well as retail establishments and numerous firms providing business and household services. There are more than 250 businesses, and more than 36,000 people work in the Merrifield area. Fairfax County's recent amendments to the Comprehensive Plan include conversion of industrial-zoned properties into mixed-use areas and a substantial increase in 3-9
140 Capital Beltway Study Chapter 3 housing in the area. The plan amendments identify four distinct areas (Core Areas, Adjacent Areas, Non-Core Areas, and Edge Areas) to be developed over the next 20 to 30 years. When fully built out, the area could include as much as 22 million square feet of non-residential space and 12 million square feet of residential space. Tysons Corner. The Tysons Corner area, encompassing more than 2,000 acres on both sides of the Beltway between Leesburg Pike and the Dulles Access/Toll Road, is one of the largest activity centers in the region. It has the region s largest concentration of employment outside downtown Washington, D.C., with more jobs than Crystal City in Arlington County, Virginia, and Bethesda, Maryland, combined. Often referred to as the economic engine of Fairfax County, Tysons Corner is home to more than 700 businesses employing almost 90,000 people. It has 29 million square feet of office space (33 percent of the Fairfax County total), which is more than downtown Miami. It is the preferred location in Northern Virginia for law firms, real estate companies, accountants, and consultants (the Reston/Herndon/Dulles area is favored by local high-technology firms). Tysons Corner is also one of the premier shopping destinations in the region, with more than 7 million square feet of retail space and two of the region s largest shopping centers (Tysons Corner Center and Tysons II Galleria). Ten hotels with 3,500 rooms are located in the Tysons Corner area. Several new office buildings are now planned or are currently under construction along the Beltway, and an expansion of Tysons Corner Center is underway. The Comprehensive Plan calls for the creation of high-density office, retail, and residential land uses in a pedestrian-oriented, urban environment at Tysons Corner, in keeping with its designation as the urban core or downtown for Fairfax County. An emphasis will be placed on developing a balanced central city form, which would be populated all day long, and would provide sufficient density to encourage efficient use of transit. The goal is a more urban environment that retains the best features of a suburban activity center. Tysons Corner is envisioned to contain more housing within walking distance of jobs, circulation systems that are not automobile-dependent, and a wide variety of communitylevel retail and service uses that meet the daily needs of workers and residents alike. Although only about 6 percent of the land in Tysons Corner is still undeveloped, it is expected that, through infill and redevelopment, Tysons Corner will continue to be a major center for new development. By the time full build-out is completed, Tysons Corner could have as much as 55 million square feet of non-residential space, more than 125,000 jobs, and almost 13,000 dwelling units. The total amount of additional development will depend largely on whether a planned rapid rail system is constructed to serve Tysons Corner. If a rail system is built, the Comprehensive Plan allows parcels adjacent to (or near) the rail line and station areas to be developed at higher densities. However, even if rail transit service is not provided, there is substantial potential for additional development. Non-residential floor space and dwelling units could increase more than 70 percent under the current Comprehensive Plan. The build-out plan for Tysons Corner establishes three major areas for development, each with distinct land-use types and long-range plans: 1) a core area with intense office and retail land uses; 2) non-core areas with a mixture of office, retail, and residential land 3-10
141 Affected Environment Capital Beltway Study uses; and 3) transition areas to integrate the Tysons Corner area with surrounding residential neighborhoods Utilities Electrical transmission lines, electrical substations and transformers, telecommunications lines and towers, and water and sewage delivery systems are located along the Beltway, as shown in Figure Beltway Right-of-Way The existing VDOT right-of-way for the Beltway ranges from 308 to 410 feet (94 to 125 meters) wide along the length of the mainline roadway, and extends outward at the interchanges. This right-of-way was acquired in the late 1950s, before the initial construction of the Beltway. The current Beltway uses about 50 to 70 percent of the available right-of-way along the mainline and most of the right-of-way at each interchange location. Portions of the remaining right-of-way include noise barriers and wooden screening fences; the rest has been left in its natural (mostly wooded) state. Additional details on the amount of available right-of-way and the width of the existing roadway are provided in Table 3-4. Table 3-4 EXISTING BELTWAY RIGHT-OF-WAY Average Right-of- Roadway Way Width Roadway Width Backlick Road to Braddock Road 312 feet (95 meters) 138 to 171 feet (42 to 52 meters) Braddock Road to Little River Turnpike 348 feet (106 meters) 164 to 216 feet (50 to 66 meters) Little River Turnpike to Gallows Road 361 feet (110 meters) 164 to 223 feet (50 to 68 meters) Gallows Road to Arlington Boulevard 344 feet (105 meters) 187 to 197 feet (57 to 60 meters) Arlington Boulevard to Interstate feet (120 meters) 171 to 230 feet (52 to 70 meters) Interstate 66 to Leesburg Pike 308 feet (94 meters) 138 to 230 feet (42 to 70 meters) Leesburg Pike to Chain Bridge Road 308 feet (94 meters) 164 to 226 feet (50 to 69 meters) Chain Bridge Road to Dulles Access/Toll Road 367 feet (112 meters) 167 to 269 feet (51 to 82 meters) Dulles Access/Toll Road to Georgetown Pike 390 feet (119 meters) 144 to 272 feet (44 to 83 meters) Georgetown Pike to GW Memorial Parkway 380 feet (116 meters) 194 to 210 feet (59 to 64 meters) GW Memorial Parkway to American Legion Bridge 410 feet (125 meters) 135 to 184 feet (41 to 56 meters) 3.3 SOCIOECONOMICS Population Characteristics In 2000, Fairfax County had more than 969,000 residents, who comprised 51 percent of the population in Northern Virginia and 21 percent of the Washington, D.C. metropolitan area population. Nearly 15 percent of the county s total population (140,000 residents) lives in census tracts along or near the Beltway (see Figure 3-5). The population density along the Beltway is approximately 2,800 persons per square mile, 15 percent greater than the density of Fairfax County as a whole. 3-11
142 Capital Beltway Study Chapter 3 Legend: = Power/Phone Lines = Sanitary Sewer Lines = Water Lines = Gas Lines = Telecommunications Tower Begin Project Approximate Scale (Miles) UTILITIES I-95/I-395/I-495 Interchange to I-66 BLTWY096 Figure 3-4a (1 of 2) CAPITAL BELTWAY STUDY 3-12
143 Affected Environment Capital Beltway Study End Project 495 Legend: = Power/Phone Lines = Sanitary Sewer Lines = Water Lines = Gas Lines = Telecommunications Tower Approximate Scale (Miles) UTILITIES I-66 to American Legion Memorial Bridge BLTWY097 Figure 3-4b (2 of 2) CAPITAL BELTWAY STUDY 3-13


")

144 Capital Beltway Study Chapter 3 Tract 4403 Tract 4507 BG2 Tract 4408 Tract 4523 BG1 BG1 BG2 BG3 Tract 4522 Legend: 4524 = Tract Number BG4 = Block Group Meeting Environmental Justice Threshold Tract 4407 BG4 495 Tract 4524 Tract 4304 BG4 Tract 4305 BG1 Begin Project Tract 4306 Approximate Scale (Miles) CENSUS TRACTS I-95/I-395/I-495 Interchange to Little River Turnpike BLTWY007 Figure 3-5a (1 of 4) CAPITAL BELTWAY STUDY 3-14


145 Affected Environment Capital Beltway Study Tract 4606 Tract 4713 BG2 Tract 4714 BG3 Tract 4616 BG1* Tract 4501 Tract 4402 BG3 495 Tract 4506 BG4 Legend: 4524 = Tract Number BG4 = Block Group Meeting Environmental Justice Threshold Note: * = Tract 4402, Block Group 1 from 2000 Census as shown is equivalent to Tract 4402, Block Group 9 from the 1990 Census. Tract 4403 Tract 4507 BG Approximate Scale (Miles) Tract 4408 Tract BG BG1 BG2 Tract 4522 BLTWY006 CENSUS TRACTS Little River Turnpike to I-66 Figure 3-5b (2 of 4) CAPITAL BELTWAY STUDY 3-15


 CENSUS")
 CAPITAL")
146 Capital Beltway Study Chapter 3 Tract 4706 Tract 4802 Tract 4712 BG3 Legend: 4524 = Tract Number BG4 = Block Group Meeting Environmental Justice Threshold 495 BG1 Tract 4711 Tract 4605 BG1 BG4 Tract 4713 Tract 4606 Tract 4714 Tract 4616 BG2 BG Approximate Scale (Miles) CENSUS TRACTS I-66 to Dulles Access/Toll Road BLTWY005 Figure 3-5c (3 of 4) CAPITAL BELTWAY STUDY 3-16

147 Affected Environment Capital Beltway Study End Project Tract 4801 Legend: 4524 = Tract Number BG4 = Block Group Meeting Environmental Justice Threshold Tract Tract 4802 Tract 4705 Tract 4706 Tract 4712 BG Approximate Scale (Miles) CENSUS TRACTS Dulles Access/Toll Road to American Legion Memorial Bridge BLTWY004 Figure 3-5d (4 of 4) CAPITAL BELTWAY STUDY 3-17
148 Capital Beltway Study Chapter 3 In the future, regional and local population growth will continue. Population trends and projections for the project area, Fairfax County, and the Northern Virginia area are summarized in Table 3-5. Table 3-6 lists racial and age distributions and income characteristics. Table 3-5 CURRENT AND FUTURE POPULATION Area 2000 Population 2020 Population % Change ( ) Project Area 140, , % Fairfax County 969,749 1,158, % Northern Virginia 1,907,643 2,464, % Sources: Fairfax County Office of Management and Budget and MWCOG, Round 6a Cooperative Forecasts Table 3-6 POPULATION CHARACTERISTICS (2000) Characteristic Project Area Fairfax County Racial Distribution: White 66.9% 69.9% Black 4.7% 8.6% Asian 18.5% 13.0% Native Hawaiian/Pacific Islander 0.1% 0.1% American Indian/Alaska Native 0.3% 0.3% Other Single Race 5.5% 4.5% Two or More Races 4.0% 3.7% Age Distribution: Less than % 18.6% % 11.1% % 17.9% % 17.6% % 15.4% % 9.6% 65 and Older 9.9% 9.9% Median Age Median Family Income $70,140 $65,201 Persons Below Poverty Level 3.4% 3.5% Source: 2000 Census of Population and Housing, Summary File 1 and Summary File 3A Housing Characteristics The project area s share of housing units is consistent with its share of the county s population, and most housing units (primarily single-family detached dwellings) are owneroccupied. However, there are some differences in housing characteristics. Compared to all of Fairfax County, areas next to the Beltway have more multi-family housing units (apartments and condominiums), fewer single-family dwellings and townhouses, more renters, smaller households, and higher housing values. Table 3-7 lists key housing characteristics for the project area and Fairfax County. 3-18
149 Affected Environment Capital Beltway Study Although overall housing characteristics are not expected to change substantially, the number of housing units will continue to increase. It is estimated that Fairfax County will have an additional 100,000 housing units (a 30 percent increase) by 2020, when the county is expected to be fully built out. Nearly 14,000 (a 25 percent increase) of these will be located within the project area, mostly between Leesburg Pike and the American Legion Bridge. Table 3-7 HOUSING CHARACTERISTICS (2000) Characteristic Project Area Fairfax County Total Housing Units 54, ,411 Housing Unit Type: Single-Family Detached 48.0% 50.1% Single-Family Attached 13.3% 24.3% Garden Apartments 31.0% 20.4% Mid-Rise Apartments 0.9% 0.9% High-Rise Apartments 6.7% 3.9% Mobile Home/Other 0.0% 0.5% Occupied Housing Units: 53, ,714 Owner-Occupied 62.5% 71.0% Renter-Occupied 37.5% 29.0% Persons per Household Housing Values and Rent: Median Housing Value $262,231 $226,825 Median Monthly Rent $834 $989 Source: 2000 Census of Population and Housing, Summary File 1, Fairfax County Department of Systems Management for Human Services Environmental Justice Populations Table 3-8 lists Block Groups meeting the race thresholds for environmental justice considerations under Executive Order The Census tract maps in Figure 3-5 show their locations. One block group, 4402 BG1, also met the threshold for low-income population Neighborhoods and Community Characteristics Communities along the Beltway include Annandale, Falls Church, Merrifield, Vienna, Tysons Corner, McLean, and Great Falls. Within these communities, there are a number of residential neighborhoods and subdivisions that are shown in Figure 3-6. Most of these neighborhoods are characterized by low-density suburban residential development (two to three units per acre), and contain primarily single-family residences. Pockets of higherdensity housing (townhouses and apartments) are located near some interchanges. Because most of the surrounding neighborhoods were not fully developed until after the Beltway was constructed in the early 1960s, the Beltway has not historically separated or bisected any neighborhoods. Instead, as these areas were developed, they were platted to make full use of the land up to the Beltway right-of-way. Today, with build-out of these areas completed, the edges of several subdivisions now abut the Beltway. 3-19
150 Capital Beltway Study Chapter 3 Table 3-8 CENSUS BLOCK GROUPS THAT MEET ENVIRONMENTAL JUSTICE RACE THRESHOLDS Tract/Block Group % Black % Asian % Hispanic % Minority 4306 BG1 7.60% 20.43% 35.53% 66.00% 4524 BG4 6.70% 16.21% 25.51% 52.93% 4522 BG4 2.29% 30.44% 11.16% 46.18% 4523 BG3 8.13% 20.49% 27.05% 59.46% 4523 BG2 8.30% 43.36% 17.48% 74.13% 4523 BG1 8.59% 22.05% 18.44% 52.45% 4522 BG1 8.19% 35.55% 21.50% 70.10% 4507 BG2 6.01% 18.02% 40.97% 67.17% 4402 BG4 9.42% 17.53% 27.25% 57.34% 4402 BG3 9.29% 27.09% 34.92% 74.51% 4402 BG % 24.43% 30.24% 74.81% 4616 BG3 5.44% 35.50% 11.87% 55.75% 4714 BG % 20.56% 23.22% 60.69% 4605 BG4 3.10% 23.21% 3.43% 34.79% 4713 BG1 6.96% 26.43% 22.71% 58.20% 4711 BG1 4.26% 10.83% 24.56% 41.49% 4712 BG3 3.17% 24.21% 9.72% 40.97% Project Area 4.72% 18.52% 13.24% 39.71% Fairfax County 8.57% 13.00% 11.03% 35.62% *Racial categories that meet EJ thresholds are bolded for emphasis. Source: 2000 Census of Population and Housing, Summary File 1, P8: Hispanic or Latino by Race Community Facilities and Services Community facilities and services located near the Beltway are shown in Figure 3-7. The most prevalent community facilities are schools and churches. Three elementary schools (North Springfield, Woodburn, and Stenwood), one middle school (Cooper), and one high school (Marshall) are located near the Beltway within the project area. North Springfield Elementary is the only school property which directly abuts the Beltway right-of-way. Similarly, Stenwood Elementary is immediately adjacent to Interstate 66. The Beltway and adjoining streets provide access to each of these public schools. The Beltway is also an important means of access (via Little River Turnpike) to the Northern Virginia Community College s Annandale campus, located just west of the Beltway. Five churches are also within the project area. Three medical facilities, the INOVA Fairfax Hospital, the Woodburn Center for Mental Health in Merrifield, and the Iliff Rehabilitation Center (located northwest of the I-66/I-495 interchange) are located in the project area. The North Springfield Post Office is located just west of the Braddock Road/I-495 interchange. 3-20
151 Affected Environment Capital Beltway Study Shrevewood Merrifield Village Yorktown Square Poplar Hills Camelot Holmes Run Woods Holmes Run Acres Raintree 495 Holmes Run Village Mill Creek Park Lafayette Village Accotink Heights Fairfax Hills Chapel Square Chapel Hill Fairfax Heritage Patriot Village Tall Tree Ravensworth Bristow North Springfield Ravensworth Ravensworth Farm Springfield Village Begin Project Approximate Scale (Miles) NEIGHBORHOOD AND COMMUNITY AREAS I-95/I-395/I-495 Interchange to I-66 BLTWY035 Figure 3-6a (1 of 2) CAPITAL BELTWAY STUDY 3-21
152 Capital Beltway Study Chapter 3 River Oaks End Project Linganore Saigon Balmacra River Oaks McLean Hamlet Westpark Scotts Run Timberly West Langley Elmwood Estates Windy Hill Tysons II Westgate Tysons Corner Center 495 Tysons Executive Village Tysons Glen Idylwood Kings Glen Falls Hill Dunn Loring Fallswood Shrevecrest Sandburg Dunn Loring Woods Courts of Tysons Station Merrifield Village Dolley Madison Village Shrevewood Approximate Scale (Miles) NEIGHBORHOOD AND COMMUNITY AREAS I-66 to American Legion Memorial Bridge BLTWY036 Figure 3-6b (2 of 2) CAPITAL BELTWAY STUDY 3-22
153 Affected Environment Capital Beltway Study Stenwood Elementary School M Dunn Loring Metro Station Luther Jackson Middle School Fairfax Hospital Woodburn Center for Mental Health Iliff Rehabilitation Center World and Grace Fellowship Church Woodburn Elementary School Legend: = Hospital/Medical Facility = School = Church P = Police Station F = Fire Station PO = Post Office M = Transit Station 495 PO North Springfield Post Office North Springfield Elementary School Saint Mark's Lutheran Church Begin Project Approximate Scale (Miles) COMMUNITY FACILITIES I-95/I-395/I-495 Interchange to I-66 BLTWY016 Figure 3-7a (1 of 2) CAPITAL BELTWAY STUDY 3-23
154 Capital Beltway Study Chapter 3 End Project Legend: = Hospital/Medical Facility = School = Church P = Police Station F = Fire Station PO = Post Office M = Transit Station M Tysons Westpark Transit Center Cooper Middle School McLean Presbyterian Church Church of Latter Day Saints McLean Bible Church 495 St. Luke's United Methodist Church Marshall High School Iliff Rehabilitation Center Stenwood Elementary School M Dunn Loring Metro Station World and Grace Fellowship Church Approximate Scale (Miles) COMMUNITY FACILITIES I-66 to American Legion Memorial Bridge BLTWY017 Figure 3-7b (2 of 2) CAPITAL BELTWAY STUDY 3-24
155 Affected Environment Capital Beltway Study The Fairfax County Police serve the communities along the Beltway including the Franconia, West Springfield, Mason, and McLean Districts. The Virginia State Police are responsible for traffic enforcement and safety on the Beltway. In addition, VDOT maintains a safety patrol that provides motorist assistance on major highways in the region, including the Beltway. Fire and rescue services are also provided by Fairfax County. Each of the following stations covers a portion of the project area along the Beltway: Companies 1 (McLean), 8 (Annandale), 13 (Dunn Loring), 18 (Jefferson), 23 (West Annandale), 29 (Tysons Corner), and 30 (Merrifield). No police or fire stations are located within 1 mile of the Beltway Economic Setting and Employment Once focused and largely dependent on the federal government, the economy of the Washington, D.C. region has become a diversified information economy. Northern Virginia, and Fairfax County in particular, has been at the forefront of this economic shift. The economic base of the Washington, D.C. region now includes high technology services, corporate and regional headquarters operations, trade and business associations, and business and financial services firms. In 1995, the total employment in Northern Virginia was 941,000, 34 percent higher than the total employment in the District of Columbia. About half of all jobs in Northern Virginia are now located in Fairfax County, home to more than 27,000 businesses. This employment is concentrated in three sectors: services (47 percent), wholesale/retail trade (19 percent), and government (12 percent). Fairfax County and other jurisdictions in Northern Virginia have high labor force participation rates. Nearly 80 percent of all eligible workers are employed (compared to 65 percent nationally), and the region ranks first in the share of women participating in the labor force. Almost three-quarters of all households in Northern Virginia have two full or part-time workers, with each adult often working in different parts of the metropolitan area. Fairfax County, with 93 million square feet of office space, is the largest commercial office market in the Washington, D.C. metropolitan area and the Commonwealth of Virginia. As a suburban office market, Fairfax County ranks tenth in the nation, with several of its submarkets (notably Tysons Corner and Reston) also ranking among the nation s largest. The county has more than 30 million square feet of retail space and is home to four of the largest shopping centers in the metropolitan area (Tysons Corner Center, Tysons II, Fair Oaks Mall, and Springfield Mall). Development of new office space throughout Northern Virginia is continuing at a rapid pace. Vacancy rates in existing buildings have been declining since 1990 and several new buildings are under construction. In 2000, more than 8.6 million square feet of new commercial construction was started in Fairfax County; two-thirds of this space was preleased. This new office construction is concentrated in the Tysons Corner area and along the Dulles Access/Toll Road Tax Base More than half (53 percent) of Fairfax County s annual revenue is generated from real estate taxes, primarily from residential properties. Real estate is assessed annually and property is taxed on 100 percent of market value. In 2001, the total value of real property 3-25
156 Capital Beltway Study Chapter 3 in Fairfax County was $99.8 billion. Residential properties accounted for 71 percent of total valuation ($70.9 billion); commercial and other non-residential properties made up the remaining 29 percent ($28.9 billion). At a tax rate of $1.23 per $100 of assessed value, property taxes generated $1.1 billion in tax revenue in Of that total, $779 million was raised from taxes on residential properties and another $321 million from taxes on commercial and business properties. Another 20 percent ($426.4 million) of the county s revenues are from taxes on personal property, such as cars and boats. Taxes on professional occupations and businesses, consumer utilities, cigarettes, gasoline, hotels, and the local sales tax generate another 17 percent of revenues ($339.1 million). The rest of the county s revenues come from permit fees, fines, service charges, interest and income on assets, and direct transfers from the state and federal governments. Fairfax County, like all cities and counties in Virginia, levies a local sales and use tax (1 percent), which is collected at the point of sale along with the state s 3.5 percent sales and use tax. In 2000, Fairfax County s taxable sales of $13.9 billion generated more than $485 million in tax revenue for the Commonwealth of Virginia, 19 percent of the state s total. 3.4 PARKS AND RECREATION AREAS A variety of public parklands and recreation areas, including county parks, regional parks, and national parks, are located adjacent to the Beltway within the project area. These parklands are owned and operated by the Fairfax County Park Authority, Northern Virginia Regional Park Authority, Fairfax County School Board, and the National Park Service. The location of each park or recreation area is shown in Figure 3-8. Table 3-9 provides a summary of the specific facilities and amenities available at each park or recreation area. Additional information on these parks is included in Chapter 8 (Section 4(f) Evaluation) County Parks The Fairfax County Park Authority (FCPA), an independent unit of the Fairfax County government, operates and maintains 357 parks and recreational facilities, totaling more than 17,000 acres (6,880 hectares) throughout the county. Within the project area, there are 16 parks and 1 nature preserve owned or maintained by the FCPA. These parks include undeveloped stream valley parks, neighborhood parks with fields and play equipment, community parks with recreational or community facilities, and district parks with major facilities such as golf courses and recreation centers. An overview of each FCPA park located within the project area is provided below. The FCPA also maintains a network of trails in its various parks along major streams and tributaries. 3-26


157 Affected Environment Capital Beltway Study Accotink Stream Valley Park Annandale Community Park Americana Park Wakefield Park Howery Field Park Fitzhugh Park Canterbury Woods Park 495 Flag Run Park Lake Accotink Park North Springfield Elementary School Begin Project Approximate Scale (Miles) PARKS AND PUBLIC RECREATION AREAS I-95/I-395/I-495 Interchange to Little River Turnpike BLTWY111 Figure 3-8a (1 of 4) CAPITAL BELTWAY STUDY 3-27
158 Capital Beltway Study Chapter 3 Stenwood Elementary School Jefferson District Park 495 Holmes Run Acres Historic District Accotink Stream Valley Park Woodburn Elementary School Annandale Community Park Americana Park Approximate Scale (Miles) Wakefield Park BLTWY112 PARKS AND PUBLIC RECREATION AREAS Little River Turnpike to I-66 Figure 3-8b (2 of 4) CAPITAL BELTWAY STUDY 3-28
159 Affected Environment Capital Beltway Study Scotts Run Stream Valley Park 495 Lisle Park George C. Marshall High School W&OD Railroad Regional Park Idylwood Park Stenwood Elementary School Jefferson District Park Approximate Scale (Miles) PARKS AND PUBLIC RECREATION AREAS I-66 to Dulles Access/Toll Road BLTWY113 Figure 3-8c (3 of 4) CAPITAL BELTWAY STUDY 3-29
160 Capital Beltway Study Chapter 3 Scotts Run Nature Preserve End Project George Washington Memorial Parkway Scotts Run Stream Valley Park 495 Cooper Middle School Timberly Park McLean Hamlet Park Falstaff Park Scotts Run Stream Valley Park Approximate Scale (Miles) PARKS AND PUBLIC RECREATION AREAS Dulles Access/Toll Road to American Legion Memorial Bridge BLTWY114 Figure 3-8d (4 of 4) CAPITAL BELTWAY STUDY 3-30
161 Capital Beltway Study Affected Environment 3-31
162 Capital Beltway Study Chapter 3 Lake Accotink Park. This acre (194.0-hectare) multiple resource park offers a wide variety of facilities and activities including sports fields, numerous trails, a large lake with boating and fishing facilities, miniature golf, and picnic and playground areas. Only a small portion of this park is within the project area: an undeveloped area where Flag Run crosses the Beltway and another undeveloped area where Accotink Creek crosses Braddock Road. Flag Run Park. This 8.6-acre (3.5-hectare) neighborhood park is located along Flag Run adjacent to the east side of the Beltway. It is primarily wooded and includes a recreational trail along Flag Run. Flag Run Park is located off of Elgar Street in the North Springfield neighborhood. Canterbury Woods Park. This 4.7-acre (1.9-hectare) neighborhood park contains a basketball court, open space, and a trail along Long Branch. The park s parking lot is used as an informal park-and-ride lot by commuters during the workweek. Canterbury Woods Park is located west of the Beltway at the intersection of Braddock and Wakefield Chapel Roads. Howery Field Park. This 7.5-acre (3-hectare) community park includes three lighted baseball diamonds, a multi-use field, a biking/hiking trail, and a small parking lot. It is used by local residents and organized youth leagues. Howery Field Park is located west of the Beltway and north of Braddock Road on Glen Park Road. Wakefield Park. Wakefield Park is one of the county s largest and most heavily used parks. The 293-acre (118.6-hectare) multiple resource park offers a wide range of indoor and outdoor facilities. Outdoor facilities include picnic areas, playgrounds, community gardens, 4 baseball diamonds, outdoor restrooms, a concession stand, 2 multi-use fields, 2 basketball courts, 13 tennis courts (including platform tennis), shuffleboard courts, horseshoe pits, and large amounts of undeveloped open space and natural areas. The indoor recreation center includes a pool, sun deck, fitness equipment, squash and racquetball courts, meeting rooms, and a gymnasium. An extensive network of trails within the park is used by both hikers and mountain bikers. These trails connect to trails in Lake Accotink Park and Accotink Stream Valley Park. A Virginia Power easement with highvoltage transmission wires also extends through the park and an FCPA maintenance facility is located on site. Wakefield Park is located on the west side of the Beltway between Braddock Road and Little River Turnpike. Fitzhugh Park. A 10.9-acre (4.4-hectare) neighborhood park with a multi-use court, a playground/tot lot area and recreational trail, Fitzhugh Park is located east of the Beltway and north of Braddock Road on Americana Drive. Most of the park s facilities are located off Americana Drive; the remainder of the park and the portion closest to the Beltway is an undeveloped wooded area. Americana Park. This 3.9-acre (1.6-hectare) community park is located next to the southeast quadrant of the I-495/Little River Turnpike interchange on Accotink Parkway and abuts the northern edge of Wakefield Park. Its facilities include a baseball diamond (without lighting), a small parking area, and a trail connection to Wakefield Park. The baseball diamond is used by local residents and organized youth leagues. 3-32
163 Affected Environment Capital Beltway Study Annandale Community Park. A moderately sized district park that encompasses 50.8 acres (20.6 hectares), Annandale Park is located off Hummer Road east of the Beltway and north of Little River Turnpike. Facilities at the park include two baseball diamonds, a basketball court, two tennis courts, a playground and tot lot, picnic areas, and a series of trails through the wooded and undeveloped portions of the park. The park also contains an FCPA maintenance garage, the Hidden Oaks Nature Center, which is used for community educational programs, and the Packard Center, a community center that is often used by local civic groups for public meetings. The Packard Center also includes a gallery and gift shop for locally produced artwork. Two streams, Coon Branch and an unnamed tributary, run through the park Accotink Stream Valley Park. This acre ( hectare) stream valley park is a collection of unconnected parklands along Accotink Creek, which extends through Fairfax County between the City of Fairfax and the Potomac River. Stream valley parks are intended preserve natural areas for environmental corridors, provide riparian habitat, and to protect local water quality. They are often located within the floodplains of streams and rivers. Only a small portion (62.75 acres/25.4 hectares) of this park is located near the Beltway. Within the project area, the park is heavily wooded and has no structures; a recreational trail is located along Accotink Creek as it winds through the park. There is no vehicular access to the park within the project area, but pedestrian access is provided via a trail along Accotink Creek. The nearest trailhead is at King Arthur Road, nearly two-thirds of a mile (one kilometer) from the Beltway. Jefferson District Park. This 60.8-acre (24.6-hectare) district park features a nine-hole golf course, a clubhouse, an 18-hole miniature golf course, a concession stand, 12 tennis courts, and 2 multi-use courts. An FCPA maintenance facility is also located on site. The park also includes a small, undeveloped parcel located between Shreve Road and the Beltway. Jefferson District Park is located east of the Beltway between Lee Highway and a Virginia Power transmission easement. Idylwood Park. This 13.8-acre (5.6-hectare) neighborhood park is located on Virginia Lane in the northeast quadrant of the I-66/I-495 interchange. Pedestrians can also access the park via Nottingham Drive and the Washington & Old Dominion (W&OD) Railroad Regional Park. Idylwood Park was built in the late 1970s on a site formerly owned by the Fairfax County School Board and once reserved for construction of a new school. Facilities at the park include an unlit baseball diamond, a soccer field, a basketball court, and four tennis courts. The FCPA also maintains a connector trail for the W&OD Railroad Regional Park through Idylwood Park. Lisle Park. A small (0.9-acre/0.4-hectare) neighborhood park located north of Leesburg Pike between Edgar Court and Magarity Court, Lisle Park is completely surrounded by neighboring homes; access to the park is provided via a path from Leesburg Pike. Facilities at the park include a basketball court and a playground area. Scotts Run Stream Valley Park. This 26.2-acre (10.6-hectare) stream valley park includes three separate parcels located along Scotts Run. Two of these parcels are located east of the Beltway and south of Chain Bridge Road; the other is north of Old Dominion Drive 3-33
164 Capital Beltway Study Chapter 3 west of the Beltway. The southern parcels, which include a hiking trail, are connected through a portion of Westgate Park. Access to these parcels is provided at trailheads located at Colshire Drive and Provincial Drive. The northern parcel of this park is actually a long-term easement on private land located along Scotts Run between Old Dominion Drive and Georgetown Pike. This portion of the park includes a hiking trail and bridle path. It is maintained and managed by the FCPA. McLean Hamlet Park. This 17.1-acre (6.9-hectare) neighborhood park, consisting of open space and an adjacent wooded area, is located west of the Beltway in the McLean Hamlet neighborhood. It provides a buffer between the houses and Dulles Access/Toll Road to the south. Pedestrian access to the park is provided via MacBeth Street and adjoining properties. Falstaff Park. This 3.7-acre (1.5-hectare) neighborhood park is also located in the McLean Hamlet neighborhood west of the Beltway and north of the Dulles Access/Toll Road. It includes a playground and picnic areas. Access to the park is provided via Falstaff Road. Timberly Park. This 23.1-acre (9.4-hectare) community park is located west of the Beltway and south of Old Dominion Drive. Timberly Park is a group of undeveloped, wooded parcels bisected by a small stream (Bradley Branch). Pedestrian access to the park is provided via Swinks Mill Road, Old Dominion Drive, or from adjoining properties. Scotts Run Nature Preserve. This acre (155.6-hectare) natural resource park protects environmentally sensitive areas in the northeastern portion of the county. Its limited facilities include an extensive trail network and a fishing area. The preserve is managed and maintained by the FCPA even though a large portion of the park s land is owned by the Fairfax County Board of Supervisors. Scotts Run Nature Preserve is located on the west side of the Beltway between Georgetown Pike and the Potomac River. Vehicular access to parking areas is provided via Georgetown Pike; access to most of the park is provided via the trail network and adjoining road Regional Parks One regional park, the W&OD Railroad Regional Park, is located within the project area. The W&OD Park is a multi-use trail that runs along the right-of-way for the former W&OD railroad and extends from Arlington County to Loudoun County. It was developed between 1974 and 1988, and is owned and maintained by the Northern Virginia Regional Park Authority (NVRPA). The W&OD Park crosses the Beltway just north of the I-66/I-495 interchange on a dedicated overpass. The 100-foot-wide (30-meter) park runs for 45 miles between Arlington and Purcellville in Loudoun County, providing a continuous linear park from the Potomac River to foothills of the Blue Ridge Mountains. It also connects a series of wayside parks and provides access to the rural countryside beyond the Beltway. A paved trail runs from Shirlington in Arlington County, through Falls Church, Vienna, Reston, and Herndon and into Loudoun County, and is heavily used bikers, joggers, and walkers. An adjoining bridle trail between Vienna and Purcellville is used extensively by area horseback riders. It was designated a National Recreation Trail by the U.S. Department of Interior in 1987 and is included on its national register of trails. 3-34
165 Affected Environment Capital Beltway Study State Parks There are no state-owned or operated parks, recreational areas, or nature preserves located within the project area National Parks One national park, the George Washington Memorial Parkway, is located at the northern end of the project area along the Potomac River. This 7,200-acre (2,914-hectare) park, owned and maintained by the National Park Service, includes the Parkway itself (a fourlane roadway) and the adjoining land to the Potomac shoreline. The Parkway was developed as a memorial to George Washington; the first segment (between Memorial Bridge and Mount Vernon) it was completed in the 1930s to connect various sites associated with his life. The northern portion of the Parkway, including an interchange with the Beltway, was constructed in the 1950s and 1960s. Numerous natural, historic, and memorial sites have been developed along its route, which extends from the Beltway south to Mount Vernon, passing through Arlington and the City of Alexandria. The portion of the Parkway property located next to the Beltway is wooded and undeveloped, but includes a part of the Potomac Heritage Trail. This section of the Potomac Heritage Trail, which runs for 10 miles (16 kilometers) from Roosevelt Island to just north of the Beltway, is a part of a proposed 700-mile (1,127 kilometer) trail that would trace the natural and cultural features of the Potomac River Basin. The trail winds along the Potomac River through the hillsides and palisades (cliffs) and forested stream valleys. Access to the trail is provided at many points south of the Beltway and from Live Oak Drive just north of the Beltway. Although the trail is located on National Park Service property, it is maintained by the Potomac Appalachian Trail Club (and its volunteer members) School Recreational Facilities In addition to parks or recreation areas owned and operated by the FCPA or the NVPRA, recreational areas or facilities are located at a number of schools within the project area as shown in Figure 3-8. These facilities are owned and maintained by the Fairfax County School Board, though in some cases, the Fairfax County Department of Community Recreation uses these facilities for its organized activities and instructional classes. The recreational facilities located at these schools (e.g., ball fields, basketball courts, and tennis courts) are also used by neighborhood residents and the general public during non-school hours. Schools within the project area with recreational facilities open to the public are summarized below. North Springfield Elementary School. Recreational facilities open to the public at this school include: a playground (with equipment), three basketball courts, two baseball diamonds and an open field. North Springfield Elementary School is located adjacent to the east side of the Beltway just north of Heming Avenue. The recreational facilities are located behind the school, which fronts to the Beltway. Woodburn Elementary School. Recreational facilities open to the public at this school include: a playground (with equipment), a basketball court, two tennis courts, and a 3-35
166 Capital Beltway Study Chapter 3 baseball diamond. The tennis courts at this location are owned and maintained by the FCPA. Woodburn Elementary School is located east of the Beltway at the intersection of Gallows Road and Hemlock Drive. The recreational facilities are located behind the school. Stenwood Elementary School. Recreational facilities open to the public at this school include: a playground (with equipment), two baseball diamonds, two basketball courts, and a soccer field. Stenwood Elementary School is located on Gallows Road and is directly across I-66 from the Dunn Loring Metrorail station. The southern portion of the school s recreational fields abut the westbound lanes of I-66. George C. Marshall High School. Recreational facilities open to the public at this school include: softball and baseball fields, a track and football stadium, seven tennis courts, three basketball courts, and a soccer/football practice field. Marshall High School is located between Leesburg Pike and the Beltway. A portion of the school s recreational (athletic) fields border the Beltway right-of-way. Cooper Middle School. Recreational facilities open to the public at this school include: a baseball diamond, two basketball courts, four tennis courts, and a soccer field with a track. The tennis courts at this location are owned and maintained by the FCPA. Cooper Middle School is located just east of the Georgetown Pike/I-495 interchange on Balls Hill Road. The recreational facilities are located behind the school, which faces the Beltway and Georgetown Pike Recreational Trails FCPA, in conjunction with the Fairfax County Non-motorized Transportation Committee maintains maps of the existing and planned trails within Fairfax County. In addition, VDOT recently completed the Northern Virginia Regional Bikeway and Trail Network Study. Table 3-10 lists the existing recreational trails located along Beltway. The FCPA maintains recreational trails or paved pathways for hiking, biking and exercise through a number of its parks. Where possible, these trails connect to adjoining parklands. The FCPA also maintains a network of nature trails in its various stream valley parks located along major streams and tributaries. While most of these trails are located on FCPA parkland, in some cases they are located on easements the FCPA has obtained from private property owners. Trails that are located on easements are maintained by the FCPA. Other trails in the project area include the W&OD Railroad Regional Park and the Potomac Heritage Trail. According to the Countywide Trails Plan Map, which was adopted by the Fairfax County Board of Supervisors in 2002, a trails are planned along the length of the Capital Beltway within the project limits and at each of the existing crossings of the Beltway. The I-495 trail is designated as a part of the major regional trail system which is a system of planned trails that would run along major roadways intersecting at interchanges. In late 2003, the Northern Virginia Regional Bikeway and Trail Study was completed by VDOT. This study was completed as a first step in developing a coordinated and strategic approach to developing a regional transportation system for bicycling in Northern Virginia. A major recommendation included in this study is to provide bicycle access across major 3-36
167 Affected Environment Capital Beltway Study barriers such as the Capital Beltway. The Study includes a map of a recommended trail network which includes crossings of the Beltway at Braddock Road, Little River Turnpike, Route 50, Route 7, Route 123, and Lewinsville Road. It does not include a trail at every crossing. The plan also includes a trail running parallel to the Beltway between the American Legion Bridge and the Dulles Toll Road. This trail does not extend along the remainder of the Beltway; instead it connects to other trails that extend to activity centers. Table 3-10 EXISTING RECREATIONAL TRAILS NEAR THE CAPITAL BELTWAY Location Lake Accotink Park Flag Run Park Canterbury Woods Park Wakefield Park Fitzhugh Park Annandale Community Park Trail Description Large network of hiking, biking, and nature trails, including one that crosses under Braddock Road into Wakefield Park. Recreational trail along Flag Run on the east side of the Beltway. Paved trail that runs along Long Branch. A network of trails through natural areas in the park, used primarily for mountain biking. Connects to trails in Lake Accotink, Americana, and Accotink Steam Valley Park. Trails also connect to pedestrian overpass that connects park with neighborhoods on the east side of the Beltway. Paved trail through wooded sections of park. Hiking and nature trail that connects to Hidden Oaks Nature Center. Accotink Stream Valley Park Trail along Accotink Creek that connects to trails running through Americana, Wakefield and Lake Accotink Parks. Americana Park Recreational trail providing connection to Wakefield Park. Fairfax County Cross County Trail under development. Trail will eventually extend for 40 miles from the Occoquan River near Route 123 to the Potomac River at Great Falls. The proposed route will connect three major stream valley parks including the Pohick, the Accotink, and Difficult Run. This trail crosses the Little River Turnpike within the project limits. W&OD Railroad Regional Park Multi-use trail that runs from Arlington County to Purcellville in Loudoun County. Includes paved path for pedestrians and bicyclists, and bridle path. Trail crosses the Beltway just north of the I-66/I-495 interchange on a dedicated overpass. Idylwood Park Connector trail for the W&OD Railroad Regional Park. Scotts Run Stream Valley Park Hiking trail along Scotts Run in section south of Chain Bridge Road; hiking trail and bridle path on section between Old Dominion Drive and Georgetown Pike. Scotts Run Nature Preserve Extensive network of hiking trails through the preserve. George Washington Memorial Parkway Source: Fairfax County Park Authority, Other Recreational Resources Potomac Heritage Trail extends along the Potomac River from the Beltway to Roslyn. In addition to the public parks and recreation areas described above, there are also a number of private recreational facilities within the project area. These facilities include: community swim and tennis clubs; outdoor pools, playgrounds, basketball courts, volleyball courts, and picnic areas at apartment, condominium, and townhouse complexes; swimming pools and tennis courts at private residences; and common lands owned by community associations. These recreational facilities are located on private property and are not open to the public for general use. 3-37
168 Capital Beltway Study Chapter HAZARDOUS MATERIALS Available federal, state, and local agency databases were reviewed to determine whether hazardous materials-related activities occurring within or near the current right-of-way could impair the environmental quality of the right-of-way and adjacent properties. These databases track information about underground and aboveground storage tanks; hazardous materials users; hazardous waste generators; hazardous waste treatment, storage, and disposal sites; water pollution incidents; and landfills. After sites were identified by the database searches, field investigations were conducted to confirm their existence and to identify additional sites that could be of concern. A total of 122 potential hazardous materials sites were identified and confirmed within the project area. Most of the sites consist of underground storage tanks or locations of previous hazardous material spills. None of the sites were identified on the EPA's national priority list (the superfund program). One site, the northern Virginia steel corporation, was identified in EPA s comprehensive environmental response, compensation, and liability information system (CERCLIS), although further investigation found that a preliminary assessment was conducted at the site and concluded that further studies were not warranted. Eighteen sites were listed in the resource conservation and recovery information system (RCRIS) as small quantity generators and one site was listed as a large quantity generator. Detailed information about the sites, databases searched, and agency coordination is presented in the hazardous materials technical report. 3.6 AIR QUALITY Criteria Pollutants Pursuant to the Clean Air Act of 1970, as amended, the U.S. EPA established National Ambient Air Quality Standards (NAAQS) for six air pollutants associated with vehicular emissions: carbon monoxide (CO), lead (Pb), nitrogen dioxide (NO2), ozone (O3), particulate matter (PM2.5 and PM10), and sulfur dioxide (SO2). These NAAQS were set at levels protective of human health and welfare and are reviewed every five years to ensure that they are based on the best available science. The NAAQS include both primary and secondary standards. Primary standards protect against adverse health effects; secondary standards protect against welfare effects such as decreased visibility and damage to crops, ecosystems, vegetation, and buildings. The Virginia Department of Environmental Quality (VDEQ) and the Fairfax County Health Department operate air quality monitoring stations near the project area at three locations: Station Number L-46-Z - Doctor s Exchange at 6120 Brandon Avenue, Springfield; Station Number L-46-C1 Mason Government Center at 6507 Columbia Pike; Annandale and Station Number L-46-A8 - McLean Government Center at 1437 Balls Hill Road, McLean. The locations of these three sites are shown in Figure 3-9. Table 3-11 shows monitoring data collected at the stations, along with applicable NAAQS for comparison. 3-38
169 Affected Environment Capital Beltway Study End Project Legend: = Air Toxics Monitoring Station = State and Local Air Monitoring Station = National Air Monitoring Station L-46-A L-46-C1 Begin Project Approximate Scale (Miles) AIR QUALITY MONITORING STATIONS 46-B9 BLTWY013 Figure 3-9 CAPITAL BELTWAY STUDY 3-39
170 Capital Beltway Study Chapter 3 Table 3-11 EXISTING AMBIENT AIR QUALITY MEASURED CONCENTRATION Criteria Pollutant Criteria Type McLean Govt. Ctr. (L-46-A8) Mason Govt. Ctr. (L-46-C1) Doctor s Exchange (L-46-Z) Applicable NAAQS Carbon Monoxide (CO) 1-Hour Concentration a 3.6 ppm 2.4 ppm n/a 35 ppm 8-Hour Concentration a 2.8 ppm 1.8 ppm n/a 9 ppm Lead (Pb) b Quarterly Average n/a n/a 0.01 ug/m ug/m 3 Nitrogen Dioxide (NO 2 ) Annual Arithmetic Mean 0.023* ppm ppm n/a ppm Ozone (O 3 ) 8-Hour Concentration f ppm n/a n/a 0.08 ppm Particulate Matter (PM 10 ) Annual Arithmetic Mean c n/a n/a 20 ug/m 3 50 ug/m 3 24-Hour Concentration a n/a n/a 61 ug/m ug/m 3 Particulate Matter (PM 2.5 ) f Annual Arithmetic Mean d 13.6 ug/m ug/m 3 n/a 15 ug/m 3 24-Hour Concentration e 32.9 ug/m ug/m 3 n/a 65 ug/m 3 Sulfur Dioxide (SO 2 ) Annual Arithmetic Mean ppm ppm n/a 0.03 ppm 24-Hour Concentration a ppm ppm n/a 0.14 ppm Notes: ppm = parts per million, ug/m 3 = micrograms per meter cubed, n/a = data not available. * Did not meet EPA s minimum requirements for data capture. a. Not to be exceeded more than once per year. b. Lead is not monitored because the measurements fall at or below the detectable level. c. To attain this standard, the expected annual arithmetic mean PM 10 concentration at each monitor within an area must not exceed 50 ug/m 3. d. To attain this standard, the 3-year average of the annual arithmetic mean PM 2.5 concentration from single or multiple community oriented monitors must not exceed 15.0 ug/m 3. e. To attain this standard, the 3- year average of the 98 th percentile of 24-hour concentrations at each population-oriented monitor within an area must not exceed 65 ug/m 3. f. To attain this standard, the 3-year average of the fourth-highest daily maximum 8-hour average ozone concentrations measured at each monitor within an area over each year must not exceed 0.08 ppm Sources: USEPA website; Virginia Ambient Air Monitoring Data Report, Since publication of the Draft EIS, the U.S. EPA has resolved the court challenges associated with the new 8-hour standard for ozone and the PM2.5 standard. In April 2004, U.S. EPA designated the Washington, DC-MD-VA region as a Moderate nonattainment area for the 8-hour ozone standard. The Region is required to submit a new air quality plan (called a State Implementation Plan or SIP) to the U.S. EPA in 2007 and meet the new standard by In early January this year, the U.S. EPA published the final designations for fine particulates or PM2.5 and designated the Washington, DC-MD-VA region as a nonattainment area. The U.S. EPA expects to issue guidance for implementing the new standard later this year. Ambient concentrations of Pb, CO, NO2, SO2, PM10, and total suspended particulates were well within the NAAQS for the region. Data for the monitoring sites show that the 8-hour ozone standard was violated at the McLean monitoring site. In February 2004, Virginia submitted data to the EPA showing that no areas of the state were in violation of the NAAQS for PM2.5 in 2001, 2002, and 2003 and recommended that the state be designated in attainment with particulate matter standards. In June, the U.S. EPA responded with a letter announcing its intention to include the Northern Virginia, which is part of the Washington, DC-MD-VA air quality region, as a nonattainment area. In January of this year, the U.S. EPA formally designated the Washington, DC-MD-VA region as nonattainment for PM
171 Affected Environment Capital Beltway Study Regional Attainment and Conformity Status Nationwide, atmospheric levels of all four pollutants to which motor vehicles contribute significantly O3, CO, airborne Pb, and NO have declined consistently for almost two decades, and violations of the NAAQS for airborne Pb, CO, and NO2 have been virtually eliminated. Controlling ground-level ozone has proven more challenging, but violations of the federal ozone standard have also been sharply reduced. Most of the reduction in atmospheric concentrations of these pollutants in the region can be attributed to tighter emissions standards for cars and trucks, point source controls, federal programs to reduce pollution such as Tier I and II controls, the use of reformulated gasoline and other cleaner burning fuels, etc. These lower concentrations have occurred despite the increasing population, gross domestic product, and vehicle miles traveled. A similar trend has occurred within the Washington metropolitan region. Air quality is improving for each of the criteria pollutants listed above and today the region is meeting most of the six standards with ample margins. Ground-level ozone and PM2.5 are the two pollutants for which the Washington, DC-MD-VA region has not attained. However, as discussed above, none of the monitoring data from Virginia show violation of the NAAQS for PM Air Toxics Toxic air pollutants include a number of substances that are known or suspected to cause cancer or other serious health effects in humans (e.g., respiratory problems, neurological problems, and reproductive problems) when they are exposed to certain levels of the pollutants. The federal Clean Air Act authorizes the EPA to characterize, prioritize, and control emissions of these pollutants. The sources of these substances can be broadly divided into stationary sources (e.g., power, manufacturing, and processing plants) and mobile sources (on-road and off-road motor vehicles). Mobile sources emit toxic air pollutants in three ways: exhaust emissions of uncombusted or incompletely combusted fuels and fuel byproducts, evaporative emissions from fuels, and particle emissions from vehicle wear and tear. The EPA developed a list of mobile source air toxics known to have, or suspected of having adverse health effects. The list was generated by intersecting a list of known motor vehicle emissions (from available databases and studies) with a list of compounds characterized as having potential serious adverse health effects resulting from lifetime exposures. Table 3-12 lists the substances, ranked by relative percentage of total national emissions attributable to on-highway mobile sources. The EPA s final rule for the Control of Emissions of Hazardous Air Pollutants from Mobile Sources (40 CFR Parts 80 and 86) states: It is important to note that inclusion on the list is not itself a determination by EPA that emissions of the compound in fact present a risk to public health or welfare, or that it is appropriate to adopt controls to limit the emissions of such a compound from motor vehicles or their fuels. 3-41
172 Capital Beltway Study Chapter 3 Table 3-12 EPA S LIST OF MOBILE SOURCE AIR TOXICS Substance 1 General Description Health Effects Toluene colorless, flammable, liquid hydrocarbon nonclassifiable 2 as used as gasoline octane enhancer, as a human carcinogen, solvent in many commercial products, & neurotoxicity, narcosis, for production of polymers used in cardiac arrhythmia, & numerous consumer products (including respiratory system paints, polyurethanes, plastics, dyes, & irritation adhesives); emitted from motor vehicles in exhaust and through evaporation Benzene Ethylbenzene Methyl Tertiary-Butyl Ether (MTBE) Xylene 1,3-Butadiene Styrene colorless, highly flammable, liquid hydrocarbon, a constituent of motor fuels and widely used as a solvent & manufacturing agent (e.g., in detergents, explosives, dyestuffs & pharmaceuticals); benzene in tobacco smoke accounts for nearly half the national exposure; emitted in exhaust and through evaporation colorless, liquid hydrocarbon, a constituent of motor fuels and asphalt, used to manufacture styrene & as a solvent; present in both exhaust and evaporative emissions. colorless, liquid hydrocarbon used as a gasoline additive to increase octane and reduce carbon monoxide emissions colorless, liquid hydrocarbon, a constituent of gasoline and diesel fuel, used in manufacture of ethylbenzene & as solvent in paints & coatings; present in both exhaust and evaporative emissions colorless, gas hydrocarbon used in manufacturing chemicals, rubber, & plastics; released through combustion of wood and tobacco; found in motor vehicle exhaust because of incomplete combustion of gasoline and diesel fuel colorless, liquid hydrocarbon used to manufacture polystyrene plastics & resins; constituent of gasoline & diesel fuels, emitted in exhaust human carcinogen, blood disorders, fertility impairment, eye, skin, respiratory system irritation, drowsiness, dizziness, headaches nonclassifiable as human carcinogen, respiratory irritant, neurotoxicity nonclassifiable as human carcinogen, neurotoxicity, respiratory irritant nonclassifiable as human carcinogen, respiratory and gastrointestinal irritant, neurotoxicity, impaired pulmonary function, heart palpitation & chest pain probable human carcinogen, respiratory irritant, neurotoxicity, cardiovascular disease possible human carcinogen, respiratory and gastrointestinal irritant, central nervous system dysfunction, blood & liver effects On-highway Mobile Source Contribution to Total National Emissions 1 Short Tons % of Total National Emissions 549, , , , , , ,
173 Affected Environment Capital Beltway Study Table 3-12 EPA S LIST OF MOBILE SOURCE AIR TOXICS Substance 1 General Description Health Effects Acetaldehyde colorless, liquid hydrocarbon used in probable human manufacturing a variety of chemicals, carcinogen, respiratory perfumes, polyester resins, & dyes; also & skin irritant, used as fruit & fish preservative, a flavoring agent; as a solvent in the rubber, tanning, and paper industries; an intermediate product of higher plant respiration; also formed in combustion of wood (residential fireplaces) & tobacco & in coffee roasting; also formed in the body from breakdown of ethanol (alcoholic beverages); found in motor vehicle exhaust because of incomplete combustion of gasoline and diesel fuel. n-hexane Formaldehyde Acrolein Polycyclic Organic Matter 3 Chromium Compounds colorless, liquid hydrocarbon used to extract edible oils from seeds & vegetables, as a solvent, & as a cleaning agent; a constituent of gasoline, it is emitted through exhaust and evaporation colorless, gas hydrocarbon used in synthesis of other chemicals & in a multitude of consumer & commercial products, including many building materials & home furnishings; formed in the atmosphere by oxidation of virtually all volatile organic compounds; formed from incomplete combustion of gasoline and diesel fuel water-white or yellow, liquid hydrocarbon used principally in the manufacture of acrylic acid; also formed from tobacco combustion; found in motor vehicle exhaust because of incomplete combustion of gasoline and diesel fuel. broad class of organic compounds; generally formed from combustion of fuels, wood, tobacco, vegetation, garbage, etc. metal used in making steel & other alloys, automobile brake linings & catalytic converters, & wood preservatives nonclassifiable as human carcinogen, mild neurotoxicity, respiratory & skin irritant, probable human carcinogen; respiratory, skin, & gastrointestinal irritant possible human carcinogen; respiratory & skin irritant probable human carcinogen, skin disorders, some respiratory effects human carcinogen [chromium VI only (hexavalent chromium)] ; shortness of breath, coughing, wheezing; neurological & gastrointestinal effects On-highway Mobile Source Contribution to Total National Emissions 1 Short Tons % of Total National Emissions 28, , , ,
174 Capital Beltway Study Chapter 3 Table 3-12 EPA S LIST OF MOBILE SOURCE AIR TOXICS Substance 1 General Description Health Effects Nickel Compounds Lead Compounds 4 Manganese Compounds Dioxin/Furans Arsenic Compounds Mercury Compounds Naphthalene metal used in alloys, electroplating, batteries, coins, plumbing, machinery parts, & catalysts; present in trace quantities in exhaust emissions from gasoline and diesel engines metal used in manufacture of batteries & various metal products; no longer used as fuel additive, which had been major source of emissions metal used in manufacture of steel, batteries, fertilizer, varnishes, ceramics, & in water purification; a manganese compound is used in some motor fuels as an octane enhancer Derived primarily from solid/medical waste combustion, forest fires, pulp & paper production; dietary intake is the primary route for human exposures; formed by and emitted from heavy-duty diesel trucks naturally occurring element in the earth s crust, combines readily with many other elements; used in wood preservation, pesticides, & microelectronics manufacture; food ingestion is largest source of human exposure; found in motor vehicle exhaust due to impurities in fuel or fuel additives. metal used in batteries, lamps, industrial processes, refining, lubricants, & thermometers; emissions from motor vehicles are negligible white solid or powder hydrocarbon used as insecticide, moth repellant (moth balls), & in miscellaneous organic chemicals; also released to the air from burning of wood, coal, & oil; present in small quantities in gasoline and diesel fuels, it is emitted in exhaust and by evaporation human carcinogen (nickel refinery dust & nickel subsulfide); dermatitis and respiratory effects from chronic exposures probable human carcinogen; brain & kidney damage; gastrointestinal symptoms; anemia; reproductive system effects nonclassifiable as human carcinogen; neurotoxicity; respiratory effects; impotence probable human carcinogen human carcinogen; nervous system, gastrointestinal, & respiratory effects; kidney damage possible human carcinogen or nonclassifiable (depending on the form); neurotoxicity; kidney damage; gastrointestinal & respiratory effects possible human carcinogen, anemia, liver & neurological damage, cataracts & retina damage On-highway Mobile Source Contribution to Total National Emissions 1 Short Tons % of Total National Emissions N.A. N.A. 3-44
175 Affected Environment Capital Beltway Study Table 3-12 EPA S LIST OF MOBILE SOURCE AIR TOXICS Substance 1 General Description Health Effects Diesel Particulate Matter & Diesel Exhaust Organic Gases particle (primarily polycyclic organic matter, metals, and dioxin) and gaseous (including benzene, formaldehyde, acetaldehyde, acrolein, & 1,3-butadiene) emissions probable carcinogen; respiratory irritant On-highway Mobile Source Contribution to Total National Emissions 1 Short Tons % of Total National Emissions Notes: 1. Source: EPA Control of emissions of hazardous air pollutants from mobile sources; final rule. Federal Register 66:61 p17238, table III-2 listing emission inventories from 1996 National Toxics Inventory. 2. Nonclassifiable generally means that EPA has insufficient data upon which to base a classification of human carcinogenicity. The substance may or may not be a carcinogen; there simply is not enough relevant data to make a conclusion. 3. Includes organic compounds with more than one benzene ring and with a boiling point 100 degrees centigrade or higher; within this group, EPA has identified seven polynuclear aromatic hydrocarbons (PAH) as probable human carcinogens: benz(a)anthracene, benzo(b)fluoranthene, benzo(k)fluoranthene, benzo(a)pyrene, chrysene, 7,12-dimethylbenz(a)anthracene, and indeno(1,2,3-cd)pyrene. 4. Lead is a criteria pollutant for which a National Ambient Air Quality Standard was established in Lead as a gasoline additive was completely phased out in January Consequently, lead emissions from motor vehicles now are minimal and the Virginia Department of Environmental Quality discontinued monitoring atmospheric concentrations of lead in It is also important to note that EPA determined that additional controls for these substances are not needed at present because existing and already-proposed control programs for volatile organic compounds (VOCs) and diesel particulate emissions are expected to achieve the maximum feasible reductions in emissions of these other substances as well. Thus EPA is not proposing to address air toxics on a project-by-project basis when it comes to mobile source air toxics. Accordingly, there are no National Ambient Air Quality Standards for any of these substances, with the exception of lead, which prior to its outlawing as a fuel additive had been a constituent of gasoline to boost octane. Notwithstanding, EPA has agreed under a consent degree to establish hazardous air pollutant emissions limits for motor vehicles by February The majority of mobile source toxic emissions are hydrocarbons, which result from evaporation or incomplete combustion of petroleum fuels. Increasingly stringent emission standards over the last 35 years have dramatically lowered emissions of hydrocarbons. Prior to regulation, the typical emission rate for light-duty vehicles was 9 grams/mile, compared to the current standard of 0.09 grams/mile, a reduction of 99%. The EPA estimates that controls already in place will reduce on-highway emissions of benzene, formaldehyde, 1,3-butadiene, and acetaldehyde by 67-76% and diesel particulate emissions by 90% between 1990 and In 2002, DEQ established an Air Toxic Monitoring Station in northern Virginia (in Lee Regional District Park at Telegraph Road and Rose Hill Drive, DEQ Site Code 46-B9, AIRS# , approximately 5.5 miles southeast of the Capital Beltway Project). Data collected from the station will be used to characterize urban air toxic concentrations and to assess the reasonableness of the National Air Toxics Assessment (NATA) inventory/modeling that EPA conducted in The NATA estimates emissions and health risk information on 32-air toxics pollutants and diesel particulate matter (diesel PM). As shown in Table 3-13, the air samples collected at the site were analyzed for a number of target pollutants. 3-45
176 Capital Beltway Study Chapter 3 Table 3-13 DEQ TOXICS MONITORING DATA FROM NORTHERN VIRGINIA SITE Concentrations (ppbv) 1 Substance Average Minimum Maximum Toluene Benzene Ethylbenzene m/p Xylene ,3-Butadiene Styrene Acetaldehyde Formaldehyde Acrolein Source: VDEQ Virginia Ambient Air Monitoring 2003 Data Report Notes: 1. parts per billion of carbon 3.7 NOISE Noise Terminology and Criteria The potential noise impact of the proposed alternatives was assessed in accordance with Federal Highway Administration (FHWA) and Virginia Department of Transportation (VDOT) noise assessment guidelines. The FHWA guidelines are set forth in 23 CFR Part VDOT s regulations are contained within the State Noise Abatement Policy 2, and are consistent with the FHWA guidelines. To determine the degree of impact of highway traffic noise on human activity, the Noise Abatement Criteria (NAC) established by the FHWA regulation were used in this study (see Table 3-14). The NAC are given in terms of the hourly, A-weighted, equivalent sound level in decibels (dba). The A-weighted sound level is a single number measure of sound intensity with weighted frequency characteristics that corresponds to human subjective response to noise. Most environmental noise (and the A-weighted sound level) fluctuates from moment to moment, and it is common practice to characterize the fluctuating level by a single number called the equivalent sound level (Leq). The Leq is the value or level of a steady, non-fluctuating sound that represents the same sound energy as the actual time-varying sound evaluated over the same time period. For traffic noise assessment, Leq is typically evaluated over a one-hour period, and may be denoted as Leq(h). Noise-sensitive land uses potentially affected by this project are in Category B and consist of residences, schools, places of worship, and parks and recreational areas where outdoor activity occurs. Per FHWA, noise impact occurs when the predicted design-year Build Alternative noise levels in the project area approach or exceed the NAC during the loudest 1 Federal Highway Administration, 23 CFR Part 772: Procedures for Abatement of Highway Traffic Noise and Construction Noise B Final Rule. Federal Register, Vol. 47, No. 131, 8 July Virginia Department of Transportation, State Noise Abatement Policy, adopted pursuant to the authority of Section of the Code of Virginia, January
177 Affected Environment Capital Beltway Study hour of the day. As shown in Table 3-14 above, the applicable NAC for exterior activities in Category B is 67 dba Leq(h). VDOT defines the word approach to mean when the loudesthour Leq equals 1 db less than the NAC. Therefore, noise impact is assessed when future Build noise levels equal or exceed 66 dba Leq, for Activity Category B. Table 3-14 FHWA NOISE ABATEMENT CRITERIA Activity Category A L eq (h) (dba) * 57 (Exterior) Description of Activity Category Lands on which serenity and quiet are of extraordinary significance and serve an important public need and where the preservation of those qualities is essential if the area is to continue to serve its intended purpose. B 67 (Exterior) Picnic areas, recreation areas, playgrounds, active sports areas, parks, residences, motels, hotels, schools, churches, libraries and hospitals C 72 (Exterior) Developed lands, properties, or activities not included in Categories A or B above. D -- Undeveloped lands. Residences, motels, hotels, public meeting rooms, schools, churches, libraries, E 52 (Interior) hospitals and auditoriums. *Hourly Equivalent A-weighted Sound Level In situations where there are no exterior activities that would be affected by traffic noise (such as may occur at places of worship or schools), noise impact is assessed with respect to the FHWA NAC for Activity Category E. The applicable NAC for interior activities is 52 dba Leq(h). Based on VDOT s definition of approach, noise impact also occurs if interior noise levels with the future Build Alternative equal or exceed 51 dba Leq(h). Noise impact also occurs when predicted project noise levels substantially exceed existing noise levels. An increase of 10 decibels or more is considered substantial by VDOT. In short, for Category B land uses, wherever the predicted design-year Build Alternative noise levels during the loudest hour of the day either (1) equal or exceed 66 dba Leq, or (2) exceed existing noise levels by 10 decibels or more, noise impact occurs. Likewise for Category E land uses, wherever the predicted design-year Build Alternative noise levels during the loudest hour of the day either (1) equal or exceed 51 dba Leq, or (2) exceed existing noise levels by 10 decibels or more, noise impact is assessed. If traffic noise impacts are identified as a result of the project, then noise abatement measures must be considered for feasibility and reasonableness. Noise levels in the project study area were determined for the existing conditions, and the design-year No-Build and build conditions Existing Noise Conditions Existing noise levels were measured at noise-sensitive sites along the Beltway, as shown in Figure Noise levels, shown in Table 3-15, are expressed as equivalent sound levels (Leq) in A-weighted decibels (the A-weighting represents frequency characteristics that correspond to human subjective response to noise). The noise measurements provided valuable information on current noise conditions and the effects of terrain and shielding on sound propagation from the roadway to the nearby noise-sensitive land uses. 3-47
178 Capital Beltway Study Chapter (LT1) Begin Project Approximate Scale (Miles) NOISE MEASUREMENT LOCATIONS I-95/I-395/I-495 Interchange to I-66 BLTWY024 Figure 3-10a (1 of 2) CAPITAL BELTWAY STUDY 3-48
179 Affected Environment Capital Beltway Study 34 End Project LT Approximate Scale (Miles) BLTWY025 NOISE MEASUREMENT LOCATIONS I-66 to American Legion Memorial Bridge Figure 3-10b (2 of 2) CAPITAL BELTWAY STUDY 3-49
180 Capital Beltway Study Chapter 3 Table 3-15 MEASURED SHORT-TERM NOISE LEVELS Measured L eq (dba) Site No. Location Total Traffic Only* Dominant Sources of Noise 1 Cul-de-sac 5500 block Flag Run Drive 2 Residence 7535 Axton Street 3 Residence 7533 Axton Street 4 Residence 5338 Ravensworth Road 5 Fitzhugh Park Basketball Court 4966 Americana Drive 6 Wakefield Park Hiking Trail (near picnic area) 8100 Braddock Road 7 Bristow Village Townhomes 4900 block Americana Drive 8 Americana Park Baseball Field 4301 Accotink Parkway 9 Residence Pence Court 10 Residence 3450 Luttrell Avenue 11 Residence 7916 Sycamore Drive 12B Yorktowne Square Condominiums Kings Chapel Road 13 Residence 2725 Pleasantdale Road 14 Residence 2622 Pioneer Lane 15 Residence 2620 Shelby Court 16 Residence 8331 Wesleyan Street 17 Residence 8101 Cottage Street 18 Iliff Rehabilitation Center 8000 Illiff Drive 19 Vacant Land 7800 block Railroad Street (at Beltway) 20 Residence 7810 Helena Drive Beltway traffic, aircraft overflights, insects Beltway traffic, aircraft overflights, Beltway traffic, aircraft overflights, lawn mower Beltway traffic, aircraft overflights, birds Beltway traffic, local traffic Beltway traffic, aircraft overflights, local traffic, siren Beltway traffic, local traffic Beltway traffic, local traffic, aircraft overflights Beltway traffic, aircraft overflights Beltway traffic, aircraft overflights Beltway traffic, aircraft overflights Beltway traffic, local traffic Beltway traffic, aircraft overflights, local traffic Beltway traffic, local traffic Distant Beltway and I-66 traffic, birds, aircraft overflights, local traffic I-66 traffic Beltway and I-66 traffic, aircraft overflights Beltway traffic, aircraft overflights, car door Beltway traffic, aircraft overflights, siren Beltway traffic, aircraft overflights, wind 3-50
181 Affected Environment Capital Beltway Study Table 3-15 MEASURED SHORT-TERM NOISE LEVELS Measured L eq (dba) Site No. Location Total Traffic Only* Dominant Sources of Noise 21 Renaissance Apartments Balcony (1st Floor) 2230 George C. Marshall Drive 22 Renaissance Apartments Tennis Courts 2230 George C. Marshall Drive 23 Marshall High School 7731 Leesburg Pike 24 Residence 2121 Tyson Executive Village 25 Residence 1808 Old Meadow Road, Apartment Gates of McLean Apartments 1500 block Spring Gate Drive 27A Residence (patio) 7733 Falstaff Road 27B Residence (deck) 7733 Falstaff Road 28 Residence 7600 Timberly Court 29 Residence 7506 Box Elder Court 30 Residence 1038 Delf Drive 31 Residence 906 Helga Place 32 Residence 7112 Benjamin Street 33 Residence 720 Lawton Street 34 Residence 611 Live Oak Drive 35 Idylwood Park Athletic Field 7800 Virginia Lane 36 Residence Opposite 2430 Center Street 37 Residence 4034 Estabrook Drive 38 Yorktowne Square Condominiums 2902/2904/2906 Kings Chapel Road 39 Residence 7424 Leighton Drive West Beltway traffic, parking lot traffic, aircraft overflights, a/c units Beltway traffic, fan noise Beltway traffic, aircraft overflights Beltway traffic, local traffic, aircraft overflights, construction equipment Beltway traffic, aircraft overflights Beltway traffic, aircraft overflights Beltway traffic, aircraft overflights, birds, insects Beltway traffic, aircraft overflights, birds, insects Beltway traffic, aircraft overflights Beltway traffic, aircraft overflights, lawn mowers Beltway traffic, aircraft overflights Beltway traffic, aircraft overflights Beltway traffic, aircraft overflights, local traffic Beltway and G.W. Parkway traffic, aircraft overflights, barking dog Beltway traffic, aircraft overflights I-66 traffic, Metrorail trains I-66 traffic, Metrorail trains, birds Little River Turnpike and Lafayette Village Drive traffic Beltway traffic I-66 traffic, Metrorail trains, aircraft overflights * The Traffic-Only noise measurement represents the equivalent sound level excluding those 1-minute periods dominated by noise events that were not traffic-related. 3-51
182 Capital Beltway Study Chapter 3 Short-Term Measurements. The measured noise levels (Leq) along the Beltway ranged from a low of 56 dba in front of 2620 Shelby Court (Site 15) to a high of 74 dba at the north end of Live Oaks Drive (Site 34). At almost every site, the dominant noise sources included traffic on the Beltway, traffic on local roads, and aircraft flying overhead. These noise sources are typical in the project area and are included in the total noise levels shown in Table At measurement sites nearest the Beltway, the total and traffic-only noise levels were very close, indicating that traffic is the dominant noise source at those locations. At measurement sites in quieter locations farther from the roadway, the contributions from aircraft and other noise sources were more important, resulting in a greater difference between the total and the traffic-only noise levels. Long-Term Measurements. Measurements over a period of 24 hours were conducted at two sites in the project area to determine the daily cycle of fluctuations in noise levels and the loudest hour of the day. Both sites were adjacent to the Beltway where the noise environment was dominated by Beltway traffic. The hourly Leq varied by up to 9 dba over a 24-hour period. At Site LT1 on Axton Street in North Springfield, the loudest hourly noise level approached 69 dba (Leq) for the hour starting at 3 p.m. The loudest hourly noise levels approached 67 dba (Leq) for the hours starting at 1 p.m. and 2 p.m. at Site LT2 on Snow Meadow Lane in McLean. Existing Sound Barriers. Several existing noise barriers within the project area would be removed due to the widening of the highway. The noise reductions provided by existing sound barriers were included in the estimates of existing loudest-hour noise levels. It has been VDOT s practice to replace any existing noise barriers that are removed as the result of a widening project. Figure 3-11 shows the locations of existing barriers throughout the project area. 3.8 VISUAL AND AESTHETIC CONDITIONS The visual characteristics of the Beltway are typical of interstate highways surrounding major metropolitan areas, except that trees, shrubs, and herbaceous plants growing on some unused portions of VDOT s right-of-way often provide a buffer for adjacent development (see Figure 3-12). The most dominant features are the roadway itself, nearby vegetation, and roadway-related appurtenances, such as interchanges, overpasses, retaining or noise walls, and signs. Several parks and private lands that abut the Beltway encompass higher-quality forests and natural areas. From the driver s perspective, the Beltway is an interstate facility, generally 8 lanes in width separated by concrete barriers. Most of the roadway is located below the grade of adjoining development, with most interchanges crossing over the Beltway. The Beltway is primarily bordered on both sides by trees, grassy knolls, and other vegetation. This vegetation includes lowquality forest growth, dense scrub, and invasive species that often occupy open or disturbed ground adjacent to highways and other developed areas. In most cases, these trees are planted on and around a berm, which provides a buffer between the Beltway and nearby communities. This vegetation is broken intermittently by noise barriers, overpasses, and interchanges. Noise barriers (of varying design) are also visible along portions of the Beltway. They are more prevalent in areas near interchanges where homes and other buildings are located closer to the roadway than on most mainline sections. In many cases, they have been placed away from the edge of the pavement, and are obscured by shrubs and trees planted between the wall and the roadway. 3-52
183 Affected Environment Capital Beltway Study 495 Begin Project Approximate Scale (Miles) LOCATIONS OF EXISTING NOISE BARRIERS I-95/I-395/I-495 Interchange to Little River Turnpike BLTWY074 Figure 3-11a (1 of 4) CAPITAL BELTWAY STUDY 3-53
184 Capital Beltway Study Chapter Approximate Scale (Miles) LOCATIONS OF EXISTING NOISE BARRIERS Little River Turnpike to I-66 BLTWY075 Figure 3-11b (2 of 4) CAPITAL BELTWAY STUDY 3-54
185 Affected Environment Capital Beltway Study Approximate Scale (Miles) LOCATIONS OF EXISTING NOISE BARRIERS I-66 to Dulles Access/Toll Road BLTWY076 Figure 3-11c (3 of 4) CAPITAL BELTWAY STUDY 3-55
186 Capital Beltway Study Chapter 3 End Project Approximate Scale (Miles) LOCATIONS OF EXISTING NOISE BARRIERS Dulles Access/Toll Road to American Legion Memorial Bridge BLTWY077 Figure 3-11d (4 of 4) CAPITAL BELTWAY STUDY 3-56


187 Affected Environment Capital Beltway Study Typical Beltway section characterized by overhead signs, low-level overpasses, and tree buffer. Standard noise barriers south of the Braddock Road interchange. Electrical transmission lines adjacent the Beltway north of Gallows Road. Multi-story buildings at Tysons Corner. BLTWY107 VISUAL SETTING Figure 3-12 CAPITAL BELTWAY STUDY 3-57
188 Capital Beltway Study Chapter 3 Along other sections of the Beltway, wooden fences screen the roadway or interchange from adjacent neighborhoods. Also visible are power and telephone transmission lines, electrical transformers and substations, radio towers, and communication towers. There are no particularly striking natural features that provide scenic views along the Beltway. In Tysons Corner, several buildings, particularly Tycon Tower, near the Leesburg Pike (Route 7) interchange and the recently completed Gannett/USA Today building at the Dulles Access/Toll Road interchange, serve as gateways into Tysons Corner and are prominent in the driver s viewshed. From a relational aesthetics perspective (that of non-drivers with a view of the road), the topography, noise walls and vegetation obscure most highway facilities from view. While adjacent neighborhoods are generally buffered from direct views of the highway, there are locations where the differences in elevation between the roadway and nearby development prevent complete obstruction (particularly during the winter). People using the several parks that abut the Beltway may also see views of the Beltway. However, in most cases, park facilities (playgrounds, ball fields, trails, etc.) are located away from the Beltway and are generally screened with vegetation and/or noise walls. In the case of the W&OD Railroad Regional Park, users cross the Beltway immediately north of the I-66 interchange and are given a bird s eye view of the highway. 3.9 NATURAL ENVIRONMENT Geology, Soils, and Groundwater The project area lies within the inner Piedmont physiographic province, which is characterized by gently rolling topography and deeply weathered crystalline rocks that range in age from Precambrian to Paleozoic. Average elevations range from 250 feet above mean sea level (msl) to 350 feet above msl, except near the American Legion Bridge, where elevations rapidly decline along steep slopes to an elevation of about 50 feet above msl near the edge of the Potomac River. The highest elevations (450 to 500 feet above msl) occur near Tysons Corner and Dunn Loring. In the vicinity of the Beltway, the ground surface is underlain primarily by metamorphosed sedimentary rock (metasandstones and schist) and transported igneous rock. Soils in stream valleys consist of alluvial sands and gravels formed by fluvial erosion and episodic deposition from overbank flooding. The recent alluvial deposits consist of micaceous silt and sands as well as quartz and crystalline pebbles, cobbles, and boulders. In the southern end of the project area, terrace deposits are present above the modern floodplains and include well-bedded, gently sloping graded deposits of gravel, sand, silt, and clay. Because of urbanization, no farms and no prime or unique farmland soils under the purview of the Farmland Protection Policy Act of 1981 are found in the project area. The Fairfax County soils maps indicate three soil types within the project area that have potential engineering constraints: marine clay (Patapsco clay) and soils from the Orange and Iredell series. Geotechnical analyses can be performed to avoid or manage any potential problems encountered with these soil types. Rocks and soils associated with radon gas emissions have been studied in detail within Fairfax County, but most areas in Northern Virginia with a high likelihood for these formations lie west of the project area. According to the Fairfax County Water Authority (FCWA), the Occoquan Reservoir and Potomac River account for approximately 99 percent of the county's water supply (Fairfax County, 1995). 3-58
189 Affected Environment Capital Beltway Study The FCWA projects that surface water withdrawals from these sources will continue to increase through 2005, with groundwater assuming less of a role in the future water supply for the county. Most businesses and residences in the vicinity of the Beltway are served by public water supply systems that use surface water from the Potomac River. However, some homeowners rely on wells for their water, especially north of I-66, where the project area is underlain by a lower Paleozoic/Precambrian schist aquifer. This aquifer provides yields that are adequate for residential use and the quality of the water is considered to be excellent. Lands south of I-66 are underlain by bedrock aquifers that consist of Paleozoic/Precambrian metamorphic and igneous rocks. Wells in the bedrock aquifers provide very low yields, less than 50 gallons per minute. None of the aquifers located in the vicinity of the Beltway have been designated sole-source aquifers by EPA Surface Waters The project area is located entirely within the Potomac River watershed. Several perennial watercourses traverse the project area, including Backlick Run, Accotink Creek, Flag Run, Scotts Run, Holmes Run, Coon Branch, and the Potomac River, as shown in Figure Contributing sub-basins include Cameron Run, Accotink Creek, Pimmit Run, Dead Run, and Scotts Run (Fairfax County, 1994). All of these waters have existing sediment, water quality, and water quantity problems (Hoffman, 1998). Surface water quality varies with land cover. At the southern end of the project area, the Holmes Run portion of the Cameron Run watershed is urbanized, with impervious surfaces occupying nearly 30 percent of the area in the vicinity of the Beltway. Water quality and site conditions are comparably poor. The Accotink Creek watershed is developed throughout, with highly urbanized areas in its upper portion. Downstream of the Beltway, Accotink Creek has degraded site conditions, including poor biotic integrity, habitat, and fish taxa richness. Impervious surfaces occupy nearly 30 percent of the area, and eroded stream banks and unstable habitat are characteristic of the upper watershed. Watersheds in the northern end are less developed. Nearly 50 percent of the Scotts Run and Dead Run watersheds are forested, but the headwaters of both streams begin in or near Tysons Corner. Impervious surfaces in the Scotts Run watershed occupy as much as 40 percent of the land area, and they occupy more than 20 percent in the Dead Run watershed. Both streams have poor biotic integrity, low fish taxa richness, and poor to very poor ratings for overall site conditions (Fairfax County, 2001). Low-intensity residential land use occupies almost half of the Pimmit Run watershed, contributing to the more than 25 percent impervious surfaces in the watershed. Site conditions and biotic integrity in the watershed are poor, also due to the development between Tysons Corner and Falls Church. The degradation of water quality in these watersheds is attributed not only to the level of development, but also to the historic approach to stormwater management that encouraged runoff to enter streams as quickly as possible (Fairfax County, 2001). VDEQ has designated surface waters in the project area as Class III waters: non-tidal waters of the Coastal and Piedmont Zones. Table 3-16 summarizes Virginia water quality standards for these surface waters. Certification of compliance with state water quality standards is required for discharges to surface waters regulated under Section 401 of the Clean Water Act. VDEQ retains Section 401 certification authority for all surface waters in the state. Water quality in Accotink Creek is monitored at a station near Braddock Road (see Figure 3-13). The station is operated as part of both the National Water Quality Assessment. 3-59


190 Capital Beltway Study Chapter 3 Legend: = Surface Waters = Wetlands = 100-Year Floodplain = Water Quality Monitoring Station 495 CAMERON RUN WATERSHED ACCOTINK CREEK WATERSHED Begin Project Approximate Scale (Miles) WATER RESOURCES I-95/I-395/I-495 Interchange to Little River Turnpike BLTWY089 Figure 3-13a (1 of 4) CAPITAL BELTWAY STUDY 3-60

 WATER RESOURCES Little River Turnpike to I-66")
191 Affected Environment Capital Beltway Study ACCOTINK CREEK WATERSHED CAMERON RUN WATERSHED Legend: = Surface Waters = Wetlands = 100-Year Floodplain = Water Quality Monitoring Station Approximate Scale (Miles) WATER RESOURCES Little River Turnpike to I-66 BLTWY090 Figure 3-13b (2 of 4) CAPITAL BELTWAY STUDY 3-61

 WATER RESOURCES I-66 to Dulles Access/Toll Road")
192 Capital Beltway Study Chapter 3 SCOTTS SCOTTS RUN RUN WATERSHED WATERSHED DIFFICULT RUN WATERSHED 495 SCOTTS RUN WATERSHED PIMMIT RUN WATERSHED Legend: = Surface Waters = Wetlands = 100-Year Floodplain = Water Quality Monitoring Station DIFFICULT RUN WATERSHED ACCOTINK CREEK WATERSHED PIMMIT RUN WATERSHED CAMERON RUN WATERSHED ACCOTINK CREEK WATERSHED CAMERON RUN WATERSHED Approximate Scale (Miles) WATER RESOURCES I-66 to Dulles Access/Toll Road BLTWY091 Figure 3-13c (3 of 4) CAPITAL BELTWAY STUDY 3-62
193 Affected Environment Capital Beltway Study End Project Legend: = Surface Waters = Wetlands = 100-Year Floodplain = Water Quality Monitoring Station SCOTTS RUN WATERSHED DEAD RUN WATERSHED BULL NECK RUN WATERSHED SCOTTS RUN WATERSHED 495 DEAD RUN WATERSHED PIMMIT RUN WATERSHED Approximate Scale (Miles) SCOTTS RUN WATERSHED PIMMIT RUN WATERSHED BLTWY092 WATER RESOURCES Dulles Access/Toll Road to American Legion Memorial Bridge Figure 3-13d (4 of 4) CAPITAL BELTWAY STUDY 3-63
194 Capital Beltway Study Chapter 3 TABLE 3-16 VIRGINIA WATER QUALITY STANDARDS FOR CLASS III NON-TIDAL WATERS Criteria Dissolved Oxygen (mg/l) Range Temperature Fecal Coliform Minimum Daily Average 30-Day 1 Max. 2 Standard o C 200 1,000 ph Maximum 1. Geometric mean of 200 fecal coliform bacteria per 100 ml of water for two or more samples over a 30-day period. 2. 1,000 fecal coliform bacteria per 100 ml at any time. Source: Virginia Water Quality Standards (9 VAC ) Program for the United States Geological Survey (USGS) and the Ambient Water Quality Monitoring Program for VDEQ. Normal flows range from less than 10 cubic feet per second (cfs) in late summer to storm flows of 50 cfs, and, occasionally, to more than 1,200 cfs. Available data from monthly samples collected at this station between April 1993 and June 1998 show no violations of the state water quality standards for dissolved oxygen, ph, or temperature. However, sections of Accotink Creek (miles 4.5 and 10.18) are now considered impaired waters due to general standards for benthic and fecal coliform contamination (Friends of the Rivers of Virginia, 2001). This includes the region around the I-95 and I-495 crossings of Accotink Creek. The Fairfax County Health Department (FCHD) also monitors water quality in the project area, including monitoring stations in Accotink Creek, Holmes Run, Scotts Run, Pimmit Run, and Dead Run (see Figure 3-13). Samples of fecal coliform bacteria collected in streams throughout the county revealed that 13 percent of the streams were in the "good water quality" range, based on the standard of having a geometric mean of less than 200 fecal coliform bacteria per 100 ml of water for two or more samples over a 30-day period. Similarly, 14 percent of samples from the Scotts Run monitoring station were in the "good water quality" range. Only 5 percent of samples from the Dead Run and Accotink Creek monitoring stations were within the standard. The Pimmit Run and Cameron Run watersheds had slightly better water quality for fecal coliform, with 10 and 15 percent of samples in the acceptable range, respectively. Overall, these results indicate that water quality is fair for fecal coliform (FCHD, 2000). However, water quality for the chemical and physical parameters of the streams was good. For instance, average dissolved oxygen concentrations for all samples in the vicinity of the Beltway were well above the minimum standard of 4.0 mg/l. Average ph readings at these monitoring stations were above the 6.0 ph minimum, ranging from 7.2 to 7.7 (FCHD, 2000) Wetlands The U.S. Army Corps of Engineers (COE) administers regulations for activities affecting waters of the U.S. and navigable waters pursuant to Section 404 of the Clean Water Act of 1977, as amended, and Section 10 of the Rivers and Harbors Act of Waters of the U.S. include special aquatic sites, such as sanctuaries and refuges, wetlands, mud flats, vegetated shallows, coral reefs, and riffle and pool complexes, as defined by EPA's
195 Affected Environment Capital Beltway Study (b)(1) guidelines. There are no navigable waters in the project area that are subject to jurisdiction under the Rivers and Harbors Act. All wetlands within 165 feet (50 meters) of the edge of existing pavement were identified. Preliminary information was gathered from National Wetland Inventory Maps, USDA/NRCS soil maps and reports, 1990 Fairfax County Soil Science Office mapping, COE Jurisdictional Determinations issued for Accotink Stream Valley Park, aerial photography, and planimetric and topographic maps. Subsequently, field delineations were conducted based on a synthesis of this information. Field investigations were conducted between September and November 1997, May and August 1999, and September and October The 1987 COE Wetlands Delineation Manual and other applicable federal guidance (1992 and 1999) were applied in making wetland determinations and identifying jurisdictional and non-jurisdictional areas. The COE issued a written Jurisdictional Determination verifying all wetlands as accurate in March 2001, and on May 2, Verified wetlands located within the project area are shown in Figure 3-13 and are summarized by type and area in Table The Natural Resources Technical Report provides detailed supplemental data relative to the location and nature of these wetlands. Table 3-17 SUMMARY OF WETLANDS WITHIN 165 FEET (50 METERS) OF THE BELTWAY Cowardin Class * Description Area (acres) Area (hectares) PEM1A Palustrine, Emergent, Persistent, Temporarily Flooded PEM1C Palustrine, Emergent, Persistent, Seasonally Flooded PFO1A Palustrine, Forested, Broad-leaved Deciduous, Temporarily Flooded PFO1C Palustrine, Forested, Broad-leaved Deciduous, Seasonally Flooded PSS1A Palustrine, Scrub-Shrub, Broad-leaved Deciduous, Temporarily Flooded PSS1C Palustrine, Scrub-Shrub, Broad-leaved Deciduous, Seasonally Flooded Various Isolated, Non-jurisdictional Wetlands Total Wetland Area * Cowardin Class refers to the common method of describing wetland types, according to Cowardin et al The functions and values for wetlands along the Beltway were identified according to best professional experience and judgment, with the aid of specific supporting methodology and other considerations relative to each function and value. Function-value evaluation forms were used to record information about the general physical wetland setting (size, wetland type, location in the watershed, and ecological/physical characteristics). Descriptive comments were added for more specific qualitative characterization of each wetland relative to its various functions. These forms are provided in the Natural Resources Technical Report. In general, wetlands along the Beltway provide floodflow attenuation, sediment and shoreline stabilization, nutrient removal, and wildlife habitat. Larger wetlands tend to retain stormwater, dissipate erosive energy, protect waterway banks, and treat and process pollutants and excessive nutrients generated from highway and developed area runoff. Project-area wetlands also serve as important habitats for wildlife living within an urban landscape. 3-65
196 Capital Beltway Study Chapter Floodplains Executive Order requires avoidance of long- and short-term effects associated with the modification of and development in floodplains whenever there is a practicable alternative. Practicable alternatives could include bridging floodplains versus the placement of fills, shifting alignments to minimize impacts, or other measures that reduce or minimize significant encroachments where such encroachments occur. The Federal Emergency Management Agency (FEMA) delineates 100-year (Zone A) and 500- year (Zone B) floodplains on flood boundary maps as part of the National Flood Insurance Program. The 100-year floodplain refers to the area along or adjacent to a stream or body of water that is capable of storing or conveying floodwaters during a 100-year frequency storm. Figure 3-13 illustrates the extent of designated 100-year floodplains in the project area Special Jurisdictions Chesapeake Bay Protection Areas. The Chesapeake Bay Preservation Act of 1988 authorized tidewater localities to develop and adopt local programs designed to protect water quality in the Chesapeake Bay and its tributaries. Fairfax County has established Resource Protection Areas (RPAs) and Resource Management Areas (RMAs) to deal with development activities in environmentally sensitive areas of the Chesapeake Bay watershed. RPAs are lands at or near the shoreline that have intrinsic water quality value for ecological and biological processes, or that are sensitive to significant water quality degradation impacts. The RPA designation includes tidal wetlands, tidal shores, non-tidal wetlands that are connected by surface flow and contiguous to tidal wetlands or tributary streams, and a minimum 100-foot (30-meter) buffer landward along both sides of any tributary stream. RMAs designated by Fairfax County include floodplains, highly erodible soils, steep slopes, highly permeable soils, and non-tidal wetlands not designated in RPA zones. Public roads and associated structures are exempt from Chesapeake Bay Preservation Act regulations as long as encroachment in the RPA is minimized and approved erosion and sediment control and stormwater management plans are implemented. Coastal Zones. The Coastal Zone Management Act of 1972, as amended, enabled the Commonwealth of Virginia to develop programs that implement the policies of the Act. The Virginia Coastal Resources Management Program (CRMP), which was established to preserve, protect, develop, and restore coastal resources, applies to all of Fairfax County. The CRMP uses existing legislation and regulations to handle land use issues in the coastal zone. Federal agencies and applicants for federal approvals and funding must consider and comply with the Virginia CRMP. This project must comply with the following core programs of the CRMP: Wetlands Management, Fisheries Management, Non-Point Source Water Pollution Control, Point Source Water Pollution Control, and Air Pollution Control. Compliance will be achieved through agency consultation during applicable permit processes Wildlife and Habitats Wildlife in the region generally includes common species that are best able to adapt to suburban and urban areas and occupy a wide range of habitats. A relatively low number of species use the aquatic and terrestrial habitats in the vicinity of the Beltway due to their small size, disturbed 3-66
197 Affected Environment Capital Beltway Study nature, urbanized surroundings, and distance from larger undeveloped habitats. Samples of wildlife populations reveal low population densities, primarily owing to the patchiness and disturbed nature of habitats and the lack of contiguous habitat patches. For example, the Virginia Department of Forestry has documented the low quality of forest resources in the project area. An exception to the low-quality habitats near the Beltway is along its northern portion, north of the Dulles Access/Toll Road. This area encompasses a relatively undeveloped portion of land along the Potomac River that is characterized by north-facing cliffs, bluffs, ravines, and a narrow and sheltered floodplain. The Virginia Division of Natural Heritage (VDNH) has documented 25 Natural Heritage Resources (NHRs) in this predominantly forested location. NHRs are defined as rare plant and animal species, rare and exemplary natural communities, and significant geologic features. VDNH has established protection priorities for these resources. A complete listing, along with protection rankings, is provided in the Natural Resources Technical Report. Aquatic Ecology. Aquatic habitats in the vicinity of the Beltway consist of natural and manmade non-tidal palustrine systems, riparian corridors, ditches, and ponds. Dominant overstory species typically include a mixture of bottomland communities such as willow oak (Quercus phellos), pin oak (Quercus palustris), red maple (Acer rubrum), tulip poplar (Liriodendron tulipifera), box elder (Acer negundo), elm (Ulmus americana), sweetgum (Liquidambar styraciflua), and black gum (Nyssa sylvatica). Understory sapling and shrub species include arrowwood (Viburnum dentatum), sweet pepperbush (Clethra alnifolia), highbush blueberry (Vaccinium corymbosum), ironwood (Carpinus caroliniana), elderberry (Sambucus canadensis), spicebush (Lindera benzoin), and black willow (Salix nigra). Wet areas support distinctive herbaceous plants such as skunk cabbage (Symplocarpus foetidus), cardinal flower (Lobelia cardinalis), calico aster (Aster lateriflorus), rattlebox (Ludwigia alternifolia), cattail (Typha latifolia), and wood reed grass (Cinna arundinacea). Wildlife resources in riparian and palustrine systems use the dense cover provided by bottomland forest, alluvial thickets, pools, and stream banks. Species that are more dependent on the proximity to water have higher population densities as a result of contiguous tracts of forested areas along streams. Regional wetlands provide habitats for many birds, including waterfowl, migratory songbirds, and a few shorebirds. Some species may populate larger, more stable wetlands year round, while most use them seasonally for breeding, feeding, resting, or overwintering. Nesting wetland birds include red-winged blackbirds, green and blue herons, bitterns, mallards, gulls, Canada geese, black and wood ducks, and rails. More stable wetland communities located along waterways contain mature living and standing dead trees suitable for cavity-nesting bird species. Several cavity-nesting species were observed in the project area. Other birds utilizing non-tidal wetlands in the project area include towhees, chickadees, titmice, warblers, tanagers, vireos, flycatchers, kingfishers, and sparrows. Raptors, including hawks, owls, and occasional ospreys or bald eagles, have been observed feeding within the project area where food sources are adequate. Mammalian species that are commonly associated with urban aquatic settings in the project area include white-tailed deer, raccoon, opossum, skunk, eastern cottontail, muskrat, and gray squirrel. All water resources in the project area have been influenced by human activities, such as road construction, drainage system installation, utility line construction, housing/commercial 3-67
198 Capital Beltway Study Chapter 3 development, and stormwater management/erosion control construction. Increased impervious surfaces in these highly urbanized watersheds produce erosive peak runoff conditions. As a result, larger perennial water systems, including Backlick Run, Accotink Creek, Holmes Run, and Scotts Run, have been incised and eroded from the force of surface runoff. The lack of modern best management practices and stormwater controls within these watersheds also contributes to the degradation of aquatic habitats and water quality. Stream bottoms and other wet areas that have not been severely affected by erosion and sedimentation or deforestation can support benthic organisms such as insect larvae, snails, clams, worms, and crayfish. While these organisms are important sources of food for other wildlife, they are not likely to have large, stable populations in the vicinity of the Beltway due to urbanization effects. Terrestrial Ecology. Terrestrial habitats include a mosaic of natural and human-altered communities including forests, open fields, overgrown meadows and waysides, and landscaped and disturbed areas. Upland forest communities near the Beltway are characterized by mixed-aged second growth mixed hardwoods. Dominant species are red maple, tulip poplar, black cherry (Prunus serotina), northern red oak (Quercus rubra), black gum, white oak (Quercus alba), black oak (Quercus velutina), white ash (Fraxinus americana), beech (Fagus grandifolia), sweetgum, black locust (Robinia pseudoacacia), flowering dogwood (Cornus florida), bitternut hickory (Carya cordiformis), white pine (Pinus strobus), and Virginia pine (Pinus virginiana). The largest tracts of undeveloped habitat are located along stream corridors within Fairfax County and federal parks in the county, including Wakefield Park, Accotink Stream Valley Park, Idylwood Park, Scotts Run Stream Valley Park, Dranesville District Park, and the George Washington Memorial Parkway. These forests contain important food-products (acorns, fruit, nuts) that help support local populations of deer, small mammals, and game birds, including wild turkey. Such terrestrial communities provide habitat for a wider variety of mammals, birds, reptiles, and amphibians than the smaller palustrine and riparian communities along the Beltway. However, land near the Beltway is extensively developed, which means that small and moderate-size forested parcels are scattered throughout. This habitat fragmentation is the result of existing transportation facilities and surrounding residential and commercial development. Species use is based on habitat suitability characteristics, special habitat requirements, historical range, territory/home range size, reproductive habits, and foraging habits. Terraced forest communities are present along stream corridors and are characterized by a soil moisture level typical of irregularly flooded bottomland habitats. Well-drained alluvial communities occur in the floodplains of Backlick Run, Accotink Creek, Scotts Run, and the Potomac River. Frequent natural disturbances in these transitional communities tend to result in greater species richness and more vegetation stratification than in contiguous closed-canopy forested wetland communities. These communities also contain mature living and standing dead trees suitable for cavity-nesting bird species. Birds identified in the field included herons, ducks, Canada geese, hawks, owls, and various common songbirds. Common mammals observed include white-tailed deer, raccoon, opossum, skunk, bats, chipmunk, eastern cottontail, groundhog, gray squirrel, and fox. The Natural Resources Technical Report contains lists of vegetation, fish, amphibian, reptile, and mammalian species that have been observed or could be present in the project area. 3-68
199 Affected Environment Capital Beltway Study Invasive Species. The fragmentation and disturbance of habitats within the project area increases their vulnerability to invasive species. According to Executive Order 13112, an "invasive species" is a plant, animal, or other organism (1) that is non-native (or alien) to the ecosystem under consideration and (2) whose introduction causes or is likely to cause economic or environmental harm or harm to human health. FHWA is committed to preventing the introduction of and controlling the spread of invasive plant species on highway rights-of-way (FHWA Memorandum, 1999). Due to the complexity of this effort, federally funded highway projects are directed to participate in joint efforts with agencies at all levels. The Invasive Alien Plant Species Cooperative Project, a product of the partnership between the Virginia Department of Conservation and Recreation (DCR) and the Virginia Native Plant Society, was established to combat invasive alien plant species problems in the state's natural communities. DCR has published an advisory list of plant species that are known to exhibit invasive behavior in some situations. Species have been ranked as having high, medium, or low invasiveness based on factors such as cumulative impact on natural areas, potential to disperse and invade natural landscapes, distribution and abundance, difficulty of management, and impacts on other species. More than 75 percent (86 species) of the plant species included on the list of Invasive Alien Plant Species of Virginia compiled by DCR have been observed or could occur within the project area. Most of these species are herbaceous plants, many are shrubs or vines, and only three are trees. Table 3-18 lists invasive plant species that have been observed in the project area, and includes the relative invasiveness of each, as determined by DCR. The presence of these species within the project area is indicative of a regional spread of invasive plants, particularly in disturbed, urban areas. While VDOT is not responsible for the encroachment of these plants into the Beltway right-of-way, the agency is responsible for discouraging their introduction and spread, particularly following new construction projects. Table 3-18 INVASIVE PLANT SPECIES OBSERVED OR WITH THE POTENTIAL TO OCCUR WITHIN THE PROJECT AREA Common Name Scientific Name Invasiveness Tree-of-heaven Ailanthus altissima High White mulberry Morus alba Low Chinese wisteria Wisteria sinensis Medium Japanese honeysuckle Lonicera japonica High Amur honeysuckle Lonicera tatarica Medium Bush honeysuckle Lonicera maackii Medium Oriental bittersweet Celastrus orbiculatus High Porcelain-berry Ampelopsis brevipedunculata High Chinese privet Ligustrum sinense High Multiflora rose Rosa multiflora High Russian olive Elaeagnus angustifolia Low Canada thistle Cirsium arvense High Chinese lespedeza Lespedeza cuneata High Common reed Phragmites australis High Garlic mustard Alliaria petiolata High Japanese knotweed Polygonum cuspidatum High Mile-a-minute Polygonum perfoliatum High Purple loosestrife Lythrum salicaria High 3-69
200 Capital Beltway Study Chapter Threatened and Endangered Species Consultation with federal and state agencies pursuant to Section 7 of the Endangered Species Act of 1973, as amended, has been completed with respect to the presence of rare, threatened, and endangered plant and animal species within the project area. Agencies consulted included the following: U.S. Fish and Wildlife Service National Marine Fisheries Service Virginia Department of Conservation and Recreation, Division of Natural Heritage Virginia Department of Game and Inland Fisheries Virginia Department of Agriculture and Consumer Services Federally Listed Species. According to the U.S. Fish and Wildlife Service, there are no known occurrences of threatened or endangered species or their critical habitat in the project area (USFWS, 1998). No threatened or endangered species were observed during field investigations conducted in 1997 and Copies of federal agency consultation letters concurring with this assessment are provided in the Natural Resources Technical Report. State-Listed Species. According to DCR, VDNH, and the Virginia Department of Agriculture and Consumer Services (VDACS), there are no known occurrences of statelisted threatened or endangered species or their habitat in the project area (Berlinghoff, 1998; Courter, 1998). The Virginia Department of Game and Inland Fisheries (VDGIF) has not provided any comments at this time. No legally protected species were observed during field investigations conducted in 1997 and Copies of state agency consultation letters concurring with this assessment are provided in the Natural Resources Technical Report CULTURAL RESOURCES Pursuant to Section 106 of the National Historic Preservation Act, historic properties that are included in, or eligible for inclusion in, the National Register of Historic Places (NRHP), and that also are within the area of potential effect (APE) have been identified and evaluated. This was accomplished by conducting field surveys of archaeological sites and architectural resources, and consulting with the State Historic Preservation Officer (SHPO). In Virginia, the Director of the Department of Historic Resources serves as the SHPO. The archaeological APE was defined as the footprint of the widest possible alternative under consideration (12-lane Express/Local with HOV configuration), which has a maximum cross section of 236 feet (72 meters). This archaeological APE represents approximately 997 acres, although approximately 75 percent of this area was previously disturbed by original Beltway construction. As a result, an area measuring approximately 247 acres was surveyed for archaeological resources. The architectural APE was defined as extending 500 feet from the right-of-way centerline and represents approximately 1,
201 Affected Environment Capital Beltway Study acres. Approximately 25 percent of this area was previously disturbed by original Beltway construction. The actual area surveyed for architectural resources is estimated to consist of 1,179 acres. The surveys were conducted in accordance with Guidelines for Archaeological Investigations in Virginia (Virginia Department of Historic Resources) and federal guidelines contained in Secretary of the Interior's Standards and Guidelines for Archaeological and Historic Preservation (U.S. Department of Interior, 1983). Details of the survey methodologies are described in the technical report, A Cultural Resources Survey of Improvements to the Capital Beltway (Route 495) in Fairfax County, Virginia (Gray & Pape, Inc., 2001) Archaeological Resources No NRHP-eligible archaeological sites were identified within the APE Architectural Resources There are two NRHP-eligible resources within the APE: the Holmes Run Acres Historic District (VDHR # ) and the Washington and Old Dominion (W&OD) Railroad Historic District (VDHR # ) Holmes Run Acres Historic District (VDHR # ). Located northeast of the Gallows Road interchange, Holmes Run Acres was developed beginning in 1950 as a creative alternative to tract housing. The houses were of a modular plan and used modular components, a new method of construction in post-world War II America. The houses sit on quarter-acre lots and were built of wood and brick with brick fireplace walls, exposed beams, and extensive use of glass. The architects sited the houses to take full advantage of natural views. Holmes Run Acres has been recommended eligible for the NRHP as an historic district under Criterion C for architecture and community planning. W&OD Railroad Historic District (VDHR # ). The route for the W&OD Railroad crosses the Beltway just north of the I-66 interchange. The W&OD Railroad began in 1853 as the Alexandria, Loudoun, and Hampshire Railroad. The route started in Alexandria and traversed rural Virginia, ending in Bluemont at the foot of the Blue Ridge Mountains. Although the railroad no longer exists, the W&OD Railroad Regional Park now occupies the roadbed with a multi-use (bicycle/pedestrian/equestrian) trail. The District has been nominated to the NRHP under Criterion A for its contributions to the broad patterns of northern Virginia history in the areas of commerce and transportation from the mid-19 th century through the mid-20 th century. 3-71
202 Capital Beltway Study Chapter
203 4.1 INTRODUCTION ENVIRONMENTAL CONSEQUENCES The following sections discuss the direct, indirect (or secondary), and cumulative effects of the project alternatives. Direct effects occur at the same time and place as project implementation. Direct effects include displacements of features or resources within the construction "footprint" of the proposed project (e.g., displacements of homes, businesses, and wetlands) as well as off-site effects resulting from the project (e.g., changes in noise levels, air quality, visual intrusions, and water quality). Indirect effects do not occur at the same time and place as project implementation, but remain reasonably foreseeable. Indirect effects include induced growth and changes in land use patterns and density, and related effects on air and water and other natural systems, including ecosystems. Quantifying indirect effects is often difficult due to the inability to foresee relationships between the project and future development, as well as the interplay of factors besides transportation (e.g., overall economic conditions, availability of other infrastructure such as water and sewer systems, growth policies and plans of local governments, and inclinations of individual landowners). Cumulative effects are incremental consequences of a proposed action that, when added to the consequences of past and reasonably foreseeable actions, affect the same resources. Other actions in the project area include other highway projects and residential, commercial, and institutional development. 4.2 LAND USE 4 A summary of the land use effects of the Preferred Alternative and No-Build Alternative is presented in Table 4-1. The effects of the other alternatives considered in the preparation of the Draft Environmental Impact Statement (EIS) and Final EIS are also shown for comparison purposes. The Preferred Alternative was developed in part to address the comments made by the public and local government that the impacts to local communities from the Candidate Build Alternatives studied in the Draft EIS were too high Direct Land Use Conversions The Preferred Alternative will require the acquisition of lands adjacent to the Beltway and the conversion of existing uses to highway use. Table 4-1 shows the acreages of direct land use 4-1
204 Capital Beltway Study Chapter 4 conversion for the Preferred Alternative. As shown, the amount of land that will be converted to highway right-of-way would be greatly reduced as compared to what was required by the Candidate Build Alternatives studied in the Draft EIS. Displacements of homes and businesses resulting from these land use conversions are discussed in Section Table 4-1 SUMMARY OF LAND USE RELATED EFFECTS Final EIS Alternatives Revised Alternative Candidate Build Alternatives Draft EIS 1 Effect Direct Land Use Conversion (acres) Compatible with Existing Land Use Consistency with Local Comprehensive Plans Consistency with Long-Range Transportation Plan (at the time of EIS approval) Compatibility with Other Planned Transportation Projects in Northern Virginia No-Build Preferred Alternative 12-Lane HOT 10-Lane HOV Concurrent HOV Express/ Local with HOV Barrier- Separated HOV Yes Yes Yes Yes Yes Yes No Yes Yes Yes Yes Yes No Yes No Yes No No Yes Yes Yes Yes Yes Yes Notes: 1. The total impact numbers for the Candidate Build Alternatives studied in the Draft EIS are provided as ranges because of the multiple interchange options available at Gallows Road, Interstate 66, and the Dulles Access/Toll Road Consistency with Plans and Policies Improvements to the Beltway are an integral part of, and are therefore consistent with, Fairfax County's 1995 Comprehensive Plan. One of the goals of the Comprehensive Plan is to provide adequate land use by type to support the population and employment forecasts. A complementary goal is to provide a transportation system that allows for efficient movement of people and goods, and that connects the various land uses in a way that promotes continued economic prosperity and quality of life. The Preferred Alternative is consistent with these goals and with the county's plans and policies for achieving them. County officials have expressed continuing support for the implementation of Beltway improvements. Technical staff from the County s Department of Transportation have been instrumental in assisting the Study Team develop and refine the build alternatives to ensure consistency with county plans. Improvements to the Beltway are also included in the fiscally constrained Long Range Transportation Plan for the National Capital Region (CLRP). The most recent regional plan incorporates all the transportation projects that the Virginia Department of Transportation 4-2
205 Environmental Consequences Capital Beltway Study (VDOT) and local jurisdictions plan to complete by the year 2030 including the Preferred Alternative to add High Occupancy Toll (HOT) lanes to the Capital Beltway Planned and Unplanned Growth Unplanned growth can result in haphazard land uses that may become incompatible. Planned land use allows necessary room for growth without conflict. Appropriately planned land use will provide sufficient employment within a short commute of major portions of the population. Fairfax County's Comprehensive Plan has anticipated development growth by providing for it in the future land use and zoning plans. These land use and zoning plans include the Beltway as a principal element of community and planning area boundaries for the county. Improvements to the Beltway are included in the Comprehensive Plan and are therefore part of the planned growth of Fairfax County Potential for Induced Development The relationship between roadway improvements and induced development has created a lot of debate and a variety of opinions regarding sprawl. While it is clear that highways may directly induce development under certain circumstances, this cause and effect relationship doesn t always transpire when a roadway improvement is made. While it is easy to assert that transportation improvements will have this effect, it is infinitely more difficult to predict with confidence when, where, and how much, especially in a dynamic urban/suburban metropolis such as the Washington, D.C. region, where factors other than transportation influence residential and business location decisions. This issue is discussed in greater depth in Section 4.16 Secondary and Cumulative Effects Potential for Joint Development Several other major transportation projects are currently under consideration in Northern Virginia. Two involve possible joint use of the Capital Beltway corridor: the Virginia Department of Rail and Public Transportation s (DRPT) planned extension of Metrorail to Dulles Airport and eastern Loudoun County, and their proposal for Beltway rail. Close coordination has been maintained between VDOT s Study Team and the sponsors of the other two projects. The proposed Metrorail extension would cross the Capital Beltway at the Chain Bridge Road interchange in Tysons Corner. Collocation studies and joint plans have been developed to ensure that neither project would preclude the other. Plans for the Chain Bridge Road interchange, shown in Chapter 2 would accommodate the planned Metrorail alignment. The Capital Beltway Rail Feasibility Study was the result of recommendations from VDOT s 1997 MIS Results Report. Conducted by DRPT, the study confirmed the feasibility of rail along the Beltway corridor. The study also concluded that the rail should not be placed within the Beltway right-of-way, but along a parallel corridor. Beltway plans have been developed so as not to preclude potential crossings of the highway by the rail alignment. 4-3
206 Capital Beltway Study Chapter SOCIOECONOMICS A summary of the socioeconomic effects of the Preferred Alternative and No-Build Alternative is presented in Table 4-2. The effects of the other alternatives considered in the preparation of the Draft EIS and Final EIS are also shown for comparison purposes. Table 4-2 SUMMARY OF SOCIOECONOMIC EFFECTS Effect Number of Residential Relocations Number of Commercial Relocations Changes in Neighborhood and Community Cohesion Effects on Community Facilities Effects on Environmental Justice Populations Changes in Travel Patterns and Accessibility Final EIS Alternatives No-Build Preferred Alternative 12-Lane HOT Revised Alternative 10-Lane HOV Concurrent HOV Candidate Build Alternatives Draft EIS 1 Express/ Local with HOV Barrier- Separated HOV None None None None None None Effects to Merrifield Village, Shrevewood, and Dunn Loring Woods Stenwood Elementary School playground, Iliff Rehabilitation Center parking lot Effects to North Springfield, Merrifield Village, Shrevewood, and Dunn Loring Woods N. Springfield Swim Club tennis courts, N. Springfield Elem. School parking lot, Stenwood Elem. School playground, Iliff Rehabilitation Center parking lot Effects to Merrifield Village, Shrevewood, and Dunn Loring Woods Stenwood Elementary School playground, Iliff Rehabilitation Center parking lot None None None None None None Negative Better Mobility, Travel Time Savings Better Mobility, Travel Time Savings Better Mobility, Travel Time Savings Better Mobility, Travel Time Savings Better Mobility, Travel Time Savings Effects on Public Safety Negative Positive Positive Positive Positive Positive Tax Revenue Loss due to Right-of-way Acquisition 2 0 $9,202 $2,870 Number of Construction-Related Jobs Created $1.8-$2.5 million $2.2-$3.1 million $2.2-$3.0 million 0 20,173 17,644 50,513 62,064 53,880 Note: 1. The total impact numbers for the Candidate Build Alternatives studied in the Draft EIS are provided as ranges because of the multiple interchange options available at Gallows Road, Interstate 66, and the Dulles Access/Toll Road. 2. Based on Year 2002 costs. 4-4
207 Environmental Consequences Capital Beltway Study Relocations Displacements of homes, businesses, and nonprofit organizations were estimated by VDOT and are reported above in Table 4-2. Residential. The Preferred Alternative would result in a dramatic reduction in the number of residential relocations compared to the Candidate Build Alternatives studied in the Draft EIS. The Preferred Alternative was developed in part to address the concerns of the general public and local governments regarding the high number of relocations. The displacees are assumed to represent a cross section of the diversity of minorities in Northern Virginia. Based on data from the Fairfax County Department of Systems Management for Human Resources, it was estimated that the average number of family members is three, and that annual incomes range from $40,000 to $200,000. It is likely that the displacees are owner-occupants, and the remainder are tenant-occupants. Because no individual contacts were made, it is not known if any of the displacees would have special relocation needs, such as provisions for the disabled. Based on review of real estate advertisements, observation of for-sale signs, and the ongoing construction of new homes in the area, replacement housing is readily available. No problems are anticipated in finding suitable replacement housing for the displacees. VDOT has the ability and, if necessary, is willing to provide housing of last resort, including the purchase of land or dwellings; repair of existing dwellings to meet decent, safe, and sanitary conditions; relocation or remodeling of dwellings purchased by VDOT; or construction of new dwellings. All families and individuals displaced by the project will be relocated to suitable replacement housing. All replacement housing will be fair housing available to all persons without regard to race, color, religion, sex, or national origin and will be within the financial means of the displacees. Each person will be given sufficient time to negotiate for and obtain possession of replacement housing. No residential occupants will be required to move from property needed for the project until comparable decent, safe, and sanitary replacement dwellings have been made available to them. Commercial. The Preferred Alternative would not result in displacement of commercial properties, a significant improvement over the Candidate Build Alternatives studied in the Draft EIS. Non-Profit Organizations. The Preferred Alternative would not displace any non-profit organizations, schools, or churches. Upon completion of a more in-depth design for the project, VDOT will develop a detailed relocation plan to ensure that orderly relocation of all displacees can be accomplished in a satisfactory manner. The acquisition of right-of-way and the relocation of displacees will be in accordance with the Uniform Relocation Assistance and Real Property Acquisition Policies Act of 1970, as amended. Assurance is given that relocation resources will be available to all residential, business, and nonprofit displacees without discrimination Changes to Neighborhoods and Community Cohesion Effects on community cohesion can include the taking of land and homes, physical or psychological barriers dividing a community, or disruption of access within a community. The Preferred Alternative would not disrupt access to or from adjacent neighborhoods. All existing overpasses and 4-5
208 Capital Beltway Study Chapter 4 underpasses will be maintained or replaced, and no non-motorist facilities such as pedestrian or bicycle paths will be lost. To the degree that improvements to the Capital Beltway attracts trips away from local roads, quality of life in communities will improve due to a decrease in cut-through traffic. The Preferred Alternative would result in three residential displacements from the Poplar Hills neighborhood in Annandale, a very small percentage of the homes in that area Changes in Travel Patterns and Accessibility The Preferred Alternative would not adversely affect traffic patterns or accessibility to nearby developments, except for limited periods of temporary detours during construction. The road network would remain unchanged. Improvements to the Beltway would improve mobility within the study area and the eastern portion of Fairfax County. Travel time savings associated with an improved Beltway would likely attract trips off of local roads onto the Beltway, thereby removing unwanted traffic within neighborhoods. The pedestrian bridge spanning the Beltway north of Braddock Road will be extended in order to span the additional lanes associated with the Preferred Alternative. New approaches and abutments for the bridge will be built to extend the length of the existing bridge. All work will be within the existing right-of-way. Access to the bridge will be closed during the short construction periods and pedestrians and cyclist will be directed to cross at either the Braddock Road or Route 236 Interchanges.. In the vicinity of I-66, accessibility between the Shrevewood neighborhood and the neighborhoods to the north and west would be improved by the construction of a new bridge for the Washington and Old Dominion (W&OD) trail over I-66. Currently, pedestrians and cyclists must cross I-66 on local streets using narrow sidewalks. Construction of the new bridge was negotiated with the Northern Virginia Regional Park Authority as part of the Section 4(f) mitigation plan discussed in Chapter Effects on Community Facilities No community facilities will be affected by the Preferred Alternative. The impacts to the community facilities posed by the Candidate Build Alternatives studied in the Draft EIS were eliminated during the design of the Preferred Alternative Effects on Social Groups and Environmental Justice As described in Section 3.3.3, several populations under the aegis of the Presidential Executive Order on environmental justice (EJ) were identified in the study area. The following factors are used in determining that project effects on these populations would not be disproportionately high and adverse: (1) whether the effects would be predominantly borne by a minority or low-income population, or (2) whether the effects to be suffered by the minority population or low-income population would be appreciably more severe or greater in magnitude than the adverse effects that would be suffered by the non-minority population or non-low income population. The categories of adverse effects include relocations of families and businesses, changes to neighborhoods and community cohesion, natural resource utilization, air quality, hazardous materials, noise, and traffic and transportation. Although the Preferred Alternative would displace three homes, none of those homes are located in neighborhoods in block groups identified as EJ populations. No business 4-6
209 Environmental Consequences Capital Beltway Study displacements would occur. The project would not affect natural resources that EJ populations rely on for subsistence. The projected concentrations of carbon monoxide (CO) in the immediate vicinity of the project would not exceed National Ambient Air Quality Standards (NAAQS) at any of the receptor locations for any of the alternatives (see Section 4.6). Section 4.7 and the Noise Technical Report detail the results of the noise analysis completed for the Capital Beltway Study. The results show that noise levels at many sites, not just those within EJ block groups, will exceed the FHWA criteria at which noise abatement measures must be considered. Where feasible and reasonable, noise abatement measures will be provided. Easing congestion on the Beltway can reduce cut-through traffic on local roadways and neighborhood streets by making the Beltway a more attractive travel option. Under the No-Build Alternative, cut-through traffic is expected to increase in the future. The most common routes used to avoid the Beltway involve using Backlick Road and Annandale Road on the east, or Prosperity Avenue on the west, to connect to Gallows Road, which provides access to Merrifield and Tysons Corner. These routes run through or adjacent to seven of the identified minority or low-income block groups. The Preferred Alternative will decrease cut-through traffic on these streets and will help to reduce the negative impact this traffic has on the potentially affected EJ populations. More information on cut-through traffic is available in the Traffic Technical Report. The public involvement program, which is discussed in greater detail in Section 7.2, has provided numerous opportunities for participation by EJ populations in the study process. Outreach efforts included a project hotline (phone and ); a website with detailed information about the study process, progress, and alternatives under consideration; and a mailing list, consisting of over 3,500 individuals that was used to distribute newsletters and meeting announcements. Two sets of workshops, consisting of three meetings each, were held in November 1998 and June These meetings were advertised in several local papers, notices were sent to individuals on the project mailing list, and over 75,000 postcards were mailed to local residents. The meetings, which presented project process and alternatives development information, were attended by over 1,100 people and gathered comments from more than 600 citizens. Location public hearings were held after the Draft EIS was published in 2002 and additional public workshops were held in June 2004 after the Candidate Build Alternatives were modified to address public and local government concerns. More than 925 people attended the public hearings and approximately 400 attended the workshops. The hearings and workshops were advertised in a manner similar to the workshops held in 1998 and In addition to the formal public meetings, VDOT representatives met with over 40 special interest groups, civic and homeowner associations, community organizations, and individual property owners Effects on Public Safety The Preferred Alternative would have positive effects on highway and traffic safety. Higher capacity on the Beltway would result in improved response time for emergency service providers. Section 2.5 discusses the travel time savings for the Preferred Alternative. The Candidate Build Alternatives studied in the Draft EIS and No-Build Alternative are included for comparison purposes Economics The acquisition of private residential and commercial properties would result in loss of property tax revenue for Fairfax County. The Preferred Alternative would result in $9,
210 Capital Beltway Study Chapter 4 in annual tax revenue losses. These losses would be offset to some degree by the economic benefits of reductions in congestion and travel time. The project would provide a positive economic impact to the project area through the increase in employment and purchases of building materials during construction of a build alternative. Based on an FHWA procedure for estimating construction-related employment, each one million dollars of construction expenses would create an average of 9.75 temporary, on-site construction jobs and 12.7 temporary, off-site jobs for the duration of the project. Off-site employment would include support services to construction services (e.g., construction supplies, and food and beverage service). This procedure assumes that local workers would provide the needed labor for the project. Based on the construction cost estimates, Table 4-3 provides estimates of the temporary employment creation due to construction requirements. Table 4-3 ESTIMATED CONSTRUCTION EMPLOYMENT Effect Final EIS Alternatives No-Build Preferred Alternative 12-Lane HOT Revised Alternative 10-Lane HOV Concurrent HOV Candidate Build Alternatives Draft EIS 1 Express/ Local with HOV Barrier- Separated HOV Total cost (in $0 $891 $783 $2,250 - $2,340 $2,720 -$2,830 $2,400 - $2,480 millions) 2 On-site Jobs 0 8,761 7,663 21,938 26,520 23,400 Off-site Jobs 0 11,412 9,981 28,575 34,544 30,480 Total Jobs 0 20,173 17,644 50,513 62,064 53,880 Notes: 1. The total impact numbers for the Candidate Build Alternatives studied in the Draft EIS are provided as ranges because of the multiple interchange options available at Gallows Road, Interstate 66, and the Dulles Access/Toll Road. 2. The estimated construction cost is based on preliminary design information and costs developed using Year 2002 dollars. 4.4 PARKS AND RECREATION AREAS A summary of the effects to parks and recreation areas from the Preferred Alternative and No- Build Alternative is presented in Table 4-4. The effects of the other alternatives considered in the preparation of the Draft EIS and Final EIS are also shown for comparison purposes. Parks and recreational areas located along the Beltway are potentially subject to direct and indirect impacts as well as proximity impacts from the proposed action. Public parks are afforded a high level of protection from direct use impacts (or land takings) under Section 4(f) of the Department of Transportation Act. Chapter 8 of this Final EIS addresses in detail each of the five public parks that may be directly impacted by the proposed alternatives. Those parks include, Wakefield Park, Fitzhugh Park, Accotink Stream Valley Park, Jefferson District Park, and the W&OD Railroad Regional Park. The parks, recreational areas, and trails described in Section 3.4 were assessed for potential indirect impacts as well. These indirect effects could include increased noise levels in activity areas, as well as changes in access to parks. Effects of increased noise levels on parks and recreation areas are presented in detail in Section 4.7. Elevated noise levels will occur in activity areas in the following parks and 4-8
211 Environmental Consequences Capital Beltway Study Table 4-4 SUMMARY OF EFFECTS TO PARKS AND RECREATION AREAS Effect Amount of Parkland Required (acres) Number of Parks Directly Impacted Number of Parks and Recreation Areas with Activity Areas Exposed to Noise Impacts 1 Number of Existing or Proposed Trails Affected Final EIS Alternatives No- Build Preferred Alternative 12-Lane HOT Revised Alternative 10-Lane HOV Concurrent HOV Candidate Build Alternatives Draft EIS Express/ Local with HOV Barrier- Separated HOV Notes: 1. Noise impacts in activity areas are defined as exposure to noise levels greater than 66 dba. recreation areas under the No-Build Alternative as well as the Preferred Alternative: Americana Park, Fitzhugh Park, Wakefield Park, Idylwood Park, W&OD Railroad Regional Park, Stenwood Elementary School, and Marshall High School. The Candidate Build Alternatives studied in the Draft EIS resulted in noise impacts in activity areas at the following additional parks and recreation areas: Springfield Swim Club and Lisle Park. None of these proximity noise impacts would be substantial enough to impair the use of these resources. In addition, noise barriers to protect residential receptors are proposed in these locations to lower the increased noise levels. In most cases, the proposed noise barriers were found to meet VDOT s criteria for cost-effectiveness. In some cases, however, the reasonableness and cost-effectiveness of the proposed barrier system for protecting the parks depends upon the noise sensitivity of the park properties, and will be evaluated on a case-by-case basis during the project s final design. More detailed information on the specific noise barriers is provided in Section and the Noise Technical Report. During construction of the Preferred Alternative, a new bridge for the W&OD trail would be built. Staged construction of the bridge would ensure that pedestrian and bicycle crossings are maintained at all times. In addition, the replacement bridge will be designed to meet the Northern Virginia Regional Park Authority s current standards for bridges. None of the other existing or proposed trails described in Section 3.4 would be directly affected by the Preferred Alternative. Trail users on the W&OD trail would experience increased noise levels as they cross the Beltway on the trail. However, these levels are not anticipated to impair the use of the trail or be substantially different from what trail users experience today. The location of future trails, planning access to those trails from surrounding developments, and assessments of how those trails would improve bicycle and pedestrian access and mobility falls under the jurisdiction of Fairfax County. The provision of protected bikeways 4-9
212 Capital Beltway Study Chapter 4 and pedestrian paths will be addressed during the final design phase of the project. With respect to crossings of the Beltway, Fairfax County s position is that access will be provided at each location, and crossings that currently exist (including all existing free and low traffic crossings) will be maintained during and after construction. The Preferred Alternative would improve access to the local parks and recreation areas. Improved Beltway operations would encourage more distant visitors to frequent the local park facilities and interchange improvements provide improved direct access to several facilities. Although the Preferred Alternative will displace local residents who may frequent the local parks, none of the displacements is expected to have a significant effect on park operations. 4.5 HAZARDOUS MATERIALS The presence of soil and groundwater contamination, or the existence of hazardous materials within existing or proposed right-of-way, can have an adverse impact on the cost and schedule to complete a transportation project. Contaminated soil unearthed during construction could require special treatment and disposal and would not be usable for backfilling excavations. Contaminated groundwater drawn into a dewatering system could require special treatment and permitting prior to disposal. In addition, it could be necessary to notify contractors about contaminated sites if worker exposure to hazardous conditions is possible. The locations of potential hazardous materials sites throughout the study area were identified early in the project process in an effort to avoid impacts. This early identification of potential contamination provides valuable information for alternatives evaluation, design, right-of-way acquisition, and construction phasing. A summary of the effects from hazardous materials predicted to result from the Preferred Alternative and No-Build Alternative is presented in Table 4-5. The effects of the other alternatives considered in the preparation of the Draft EIS and Final EIS are also shown for comparison purposes. The Preferred Alternative will not require the acquisition of any of the known sites listed in Section 3.4 of this Final EIS. Other sites of potential concern may be identified during final design and/or construction of the Preferred Alternative. Table 4-5 IMPACTS TO POTENTIAL HAZARDOUS MATERIAL SITES Effect Right-of-Way Requirement (acres) Final EIS Alternatives No-Build Preferred Alternative 12-Lane HOT Revised Alternative 10-Lane HOV Concurrent HOV Candidate Build Alternatives Draft EIS 1 Express/ Local with HOV Barrier- Separated HOV Total Sites of Potential Concern Note: 1. The total impact numbers for the Candidate Build Alternatives studied in the Draft EIS are provided as ranges because of the multiple interchange options available at Gallows Road, Interstate 66, and the Dulles Access/Toll Road. 4-10
213 Environmental Consequences Capital Beltway Study 4.6 AIR QUALITY Conformity Determination The transportation improvements identified in the current CLRP and Transportation Improvement Program (TIP) must conform to Clean Air Act requirements and the region s State Implementation Plan (SIP). If the region s CLRP and TIP do not conform to the SIP, then federal highway funds may be withheld. Ground-level ozone and particulate matter less than 2.5 microns in size (PM2.5) are the two pollutants for which the Washington, DC- MD-VA region is currently classified as non-attainment. However, as discussed in Section 3.6, none of the monitoring data from Virginia show violation of the NAAQS for PM2.5. The Preferred Alternative (the addition of two lanes in each direction on the Capital Beltway for HOT and HOV use) has been included in the current CLRP (FY 2005) and TIP (FY ) and the Capital Region's Transportation Planning Board (the MPO for the Washington, D.C. Metropolitan Area) conducted a conformity assessment for the 8-hour ozone standard. TPB's conformity determination was reviewed by the EPA in accordance with the procedures and criteria of the Transportation Conformity Rule. Based on their review, EPA determined that TPB's 8-hour ozone conformity assessment meets the requirements of the Clean Air Act and the applicable regulations promulgated under 40 CFR Part 93. On December 21, 2005, FHWA and FTA jointly found the 2005 CLRP and FY TIP for the Washington, D.C. Metropolitan Area to be in conformance with the Transportation Conformity Rule for the 8-hour ozone standard. The TPB also recently completed a conformity assessment of the 2005 CLRP and FY for fine particles (PM2.5 direct and precursor NOx emissions). Their assessment demonstrates that the estimated levels of fine particles for the 2010, 2020, and 2030 analysis years of the CLRP and TIP will be well below the 2002 base year levels of PM2.5 and NOx emissions. EPA has determined that TPB s PM2.5 conformity assessment meets the requirements of the Clean Air Act and the applicable regulations promulgated under 40 CFR Part 93. On February 21, 2006, FHWA and FTA jointly found the 2005 CLRP and FY TIP for the Washington, D.C. Metropolitan Area to be in conformance with the Transportation Conformity Rule for the PM2.5 standard. On March 10, 2006, EPA published the Final Rule on PM2.5 and PM10 Hot-Spot Analyses in Project-level Transportation Conformity Determinations for the New PM2.5 and Existing PM10 National Ambient Air Quality Standards in the Federal Register. The new rule requires a hot-spot analysis and project level conformity determination for projects in PM2.5 nonattainment areas that are "of air quality concern," effective April 5, Qualitative hot-spot analyses are required for these projects until such time as EPA releases its future quantitative modeling guidance and announces that quantitative PM2.5 hot-spot analyses are required under 40 CFR (b)(4). On March 29, 2006, EPA and the Federal Highway Administration issued joint guidance for conducting qualitative hot-spot analyses to meet the requirements established in the March10th final Transportation Conformity Rule. Accordingly, a draft hot-spot qualitative analysis and project level conformity determination has been prepared for the Capital Beltway Improvement Project and is included in Appendix E. Based on a review of monitoring data and the regional PM2.5 conformity analysis, FHWA has concluded that the Capital Beltway Improvement Project will not cause or contribute to a new violation of the PM2.5 NAAQS, or increase the frequency or severity of a violation. 4-11
214 Capital Beltway Study Chapter 4 The proposed improvements are not expected to interfere with attainment or maintenance of the NAAQS. Additional details on the air quality analysis are provided in the Air Quality Technical Report Mobile Source Emissions Analysis Atmospheric concentrations of carbon monoxide (CO), the predominant pollutant emitted from gasoline-powered motor vehicles, were determined for the closest worst-case roadside sites, which are shown in Figure 4-1. VACAL5NA, a simplified microcomputer procedure developed from FHWA's MOBILE/CALINE model was used to estimate the CO concentrations (in units of parts per million, or ppm). Worst case assumptions and inputs were used in the analysis, including peak-hour traffic volumes, an ambient temperature of 30 degrees Fahrenheit, a wind speed of 1m/s, an atmospheric stability rating of "D," and wind directions nearly parallel to the roadway. Tables 4-6a and 4-6b summarize analysis results for the base (existing year) conditions, the No-Build Alternative and the Preferred Alternative. For the ten analysis sites, the tables present the peak one-hour and eight-hour CO concentrations for the base year, interim year (2010), and design year (2020). All estimates are in parts per million (ppm). The results include background concentrations of 6 ppm and 3 ppm for the one-hour and eight-hour concentrations, respectively. The estimated CO concentrations shown in Table 4-6a and 4-6b, including background, are well below the NAAQS of 35 ppm for one-hour concentrations and 9 ppm for eighthour concentrations Air Toxics As described in Section 3.6.3, motor vehicles emit several pollutants that the EPA classifies as probable human carcinogens. Some toxic compounds are present in gasoline and are emitted to the air when gasoline evaporates or passes through the engine unburned. Other toxic compounds are formed as a by-product of incomplete combustion or through secondary reactions in the atmosphere. The emissions that come from mobile sources (e.g., cars, trucks, buses) are highly dependent on the fuel that powers them. Therefore, the EPA implemented regulations for mobile sources that are aimed at controlling the emissions of air toxics through changes to fuel compositions and improving vehicle technology and performance. Examples of such changes include: reformulated gasoline and anti-dumping standards; national low emission vehicle (NLEV) program; Tier 2 motor vehicle emissions and gasoline sulfur control requirements; inspection and maintenance programs, on-board diagnostics, and heavy-duty engine and vehicle standards; and on-highway diesel fuel sulfur control requirements. In developing the March 29, 2001 final rule, Control of Emissions of Hazardous Air Pollutants from Mobile Sources, EPA found that refineries were producing gasolines that were cleaner than required by prior gasoline toxic emissions standards (i.e., they were overcomplying ). EPA issued new gasoline toxic emissions standards designed to perpetuate this overcompliance. Now, the annual average toxics performance level of gasoline produced or imported beginning in 2002 must be at least as clean as the average performance level of the gasoline produced during the baseline period
215 Environmental Consequences Capital Beltway Study Begin Project Approximate Scale (Miles) AIR QUALITY ANALYSIS RECEPTOR SITES I-95/I-395/I-495 Interchange to I-66 BLTWY086 Figure 4-1a (1 of 2) CAPITAL BELTWAY STUDY 4-13
216 Capital Beltway Study Chapter 4 End Project Approximate Scale (Miles) AIR QUALITY ANALYSIS RECEPTOR SITES I-66 to American Legion Memorial Bridge BLTWY087 Figure 4-1b (2 of 2) CAPITAL BELTWAY STUDY 4-14
217 Environmental Consequences Capital Beltway Study Table 4-6a PROJECT CARBON MONOXIDE CONCENTRATIONS (PARTS PER MILLION) INTERIM YEAR (2010) 1 Site 1 Receptor North Springfield Elementary School Final EIS Alternatives Preferred Alternative Time 12-Lane Period Existing No-Build HOT Revised Alternative 10-Lane HOV Candidate Build Alternatives Draft EIS 2 Concurrent HOV Express/ Local with HOV Barrier- Separated HOV 1-Hour Hour Fitzhugh Park Luttrell Road Residence Stenwood Elementary School Roswell Court Residence George C. Marshall High School Regency Condominium Lear Road Residence Beaufort Park Tennis Court Potomac Heritage Trail 1-Hour Hour Hour Hour Hour Hour Hour Hour Hour Hour Hour Hour Hour Hour Hour Hour Hour Hour Notes: 1. See Figure 4-1 for site location 2. The total impact numbers for the Candidate Build Alternatives studied in the Draft EIS are provided as ranges because of the multiple interchange options available at Gallows Road, Interstate 66, and the Dulles Access/Toll Road. 4-15
218 Capital Beltway Study Chapter 4 Table 4-6b PROJECT CARBON MONOXIDE CONCENTRATIONS (PARTS PER MILLION) DESIGN YEAR (2020) 1 Site 1 Receptor North Springfield Elementary School Final EIS Alternatives Preferred Alternative Time 12-Lane Period Existing No-Build HOT Revised Alternative 10-Lane HOV Candidate Build Alternatives Draft EIS 2 Concurrent HOV Express/ Local with HOV Barrier- Separated HOV 1-Hour Hour Fitzhugh Park Luttrell Road Residence Stenwood Elementary School Roswell Court Residence George C. Marshall High School Regency Condominium Lear Road Residence Beaufort Park Tennis Court Potomac Heritage Trail 1-Hour Hour Hour Hour Hour Hour Hour Hour Hour Hour Hour Hour Hour Hour Hour Hour Hour Hour Notes: 1. See Figure 4-1 for site location 2. The total impact numbers for the Candidate Build Alternatives studied in the Draft EIS are provided as ranges because of the multiple interchange options available at Gallows Road, Interstate 66, and the Dulles Access/Toll Road. 4-16
219 Environmental Consequences Capital Beltway Study Since the draft Environmental Impact Statement was approved for public availability in 2002, FHWA, through consultation with the EPA, has issued interim guidance on addressing mobile source air toxics in NEPA documents. This guidance, released on February 3, 2006, establishes a three-tiered approach to addressing mobile source air toxics in NEPA documents depending upon the scope of the project and its stage of development. In accordance with this guidance, this EIS includes a basic qualitative analysis of the likely mobile source air toxic emission impacts of the alternatives compared to the No-Build scenario. However, available technical tools do not enable us to predict the projectspecific health impacts of the emissions associated with each alternative in this EIS. Although EPA has established a list of mobile source air toxics, it has not established that emissions of these compounds present health risks, nor has it established standards or measures of concentrations of these compounds such that one could conclude that a particular project will have an adverse health effect on the public. Due to these limitations, the following discussion is included in the EIS while acknowledging CEQ s regulations (40 CFR (b)) regarding incomplete or unavailable information. There are six air toxics that are of primary concern when it comes to mobile source air toxic emissions, and they are commonly referred to as the six priority mobile source air toxics. These six priority mobile source air toxics include acetaldehyde, acrolein, benzene, 1,3-butadiene, diesel particulate matter, and formaldehyde. Effectively evaluating the environmental and health impacts from the six priority mobile source air toxics on a highway project such that the information could be used to make an informed decision would involve several key elements, including emissions modeling, dispersion modeling in order to estimate ambient concentrations resulting from the estimated emissions, exposure modeling in order to estimate human exposure to the estimated concentrations, and then final determination of health impacts based on the estimated exposure. Each of these steps is encumbered by technical shortcomings or uncertain science that prevents a more complete determination of the mobile source air toxic health impacts of this project and in turn, prevents FHWA from considering this information with any degree of confidence when making a decision on the project. Emissions. The EPA tools to estimate mobile source air toxic emissions from motor vehicles are not sensitive to key variables determining emissions of mobile source air toxics in the context of highway projects. While MOBILE 6.2 is used to predict emissions at a regional level, it has limited applicability at the project level. MOBILE 6.2 is a trip-based model--emission factors are projected based on a typical trip of 7.5 miles, and on average speeds for this typical trip. This means that MOBILE 6.2 does not have the ability to predict emission factors for a specific vehicle operating condition at a specific location at a specific time. For particulate matter, the model results are not sensitive to average trip speed, although the other mobile source air toxic emission rates do change with changes in trip speed. Also, the emissions rates used in MOBILE 6.2 for both particulate matter and mobile source air toxics are based on a limited number of tests of mostly older-technology vehicles. Lastly, in its discussions of particulate matter under the conformity rule, EPA has identified problems with MOBILE6.2 as an obstacle to quantitative analysis. Consequently, these deficiencies compromise the capability of MOBILE 6.2 to estimate mobile source air toxic emissions. 4-17
220 Capital Beltway Study Chapter 4 Dispersion. The tools to predict how mobile source air toxics disperse are also limited. The EPA s current regulatory models, CALINE3 and CAL3QHC, were developed and validated more than a decade ago for the purpose of predicting episodic concentrations of carbon monoxide to determine compliance with the NAAQS. The performance of dispersion models is more accurate for predicting maximum concentrations that can occur at some time at some location within a geographic area. This limitation makes it difficult to predict accurate exposure patterns at specific times at specific highway project locations across an urban area to assess potential health risk. The NCHRP is conducting research on best practices in applying models and other technical methods in the analysis of mobile source air toxics. This work also will focus on identifying appropriate and more effective methods of documenting and communicating mobile source air toxic impacts in the NEPA process and to the general public. Along with these general limitations of dispersion models, FHWA is also faced with a lack of monitoring data in most areas for use in establishing project-specific mobile source air toxic background concentrations. Exposure Levels and Health Effects. Finally and probably most important, even if emission levels and concentrations of mobile source air toxics could be accurately predicted, shortcomings in current techniques for exposure assessment and risk analysis preclude us from reaching meaningful conclusions about project-specific health impacts. Exposure assessments are difficult because it is difficult to accurately calculate annual concentrations of mobile source air toxics near roadways, and to determine the portion of a year that people are actually exposed to those concentrations at a specific location. These difficulties are magnified for 70-year cancer assessments, particularly because unsupportable assumptions would have to be made regarding changes in travel patterns and vehicle technology (which affects emissions rates) over a 70-year period. There are also considerable uncertainties associated with the existing estimates of toxicity of the various mobile source air toxics, because of factors such as low-dose extrapolation and translation of occupational exposure data to the general population. Because of these shortcomings, any calculated difference in health impacts between alternatives is likely to be much smaller than the uncertainties associated with calculating the impacts. Consequently, the results of such assessments would not be useful to decision makers, who would need to weigh this information against other project impacts that are better suited for quantitative analysis. Research into the health impacts of mobile source air toxics is ongoing. For different emission types, there are a variety of studies that show that some either are statistically associated with adverse health outcomes through epidemiological studies (frequently based on emissions levels found in occupational settings) or that animals demonstrate adverse health outcomes when exposed to large doses. Exposure to toxics has been a focus of a number of EPA efforts. Most notably, the agency conducted the National Air Toxics Assessment (NATA) in 1999 to evaluate modeled estimates of human exposure applicable to the county level. While not intended for use as a measure of or benchmark for local exposure, the modeled estimates in the NATA database best illustrate the levels of various toxics when aggregated to a national or State level. 4-18
221 Environmental Consequences Capital Beltway Study The EPA is in the process of assessing the risks of various kinds of exposures to these pollutants. The EPA Integrated Risk Information System (IRIS) is a database of human health effects that may result from exposure to various substances found in the environment. The IRIS database is located at The following toxicity information for the six priority mobile source air toxics was taken from the IRIS database Weight of Evidence Characterization summaries. This information is taken verbatim from EPA's IRIS database and represents the Agency's most current evaluations of the potential hazards and toxicology of these chemicals or mixtures. Benzene is characterized as a known human carcinogen. The potential carcinogenicity of acrolein cannot be determined because the existing data are inadequate for an assessment of human carcinogenic potential for either the oral or inhalation route of exposure. Formaldehyde is a probable human carcinogen, based on limited evidence in humans, and sufficient evidence in animals. 1,3-butadiene is characterized as carcinogenic to humans by inhalation. Acetaldehyde is a probable human carcinogen based on increased incidence of nasal tumors in male and female rats and laryngeal tumors in male and female hamsters after inhalation exposure. Diesel exhaust (DE) is likely to be carcinogenic to humans by inhalation from environmental exposures. Diesel exhaust as reviewed in this document is the combination of diesel particulate matter and diesel exhaust organic gases. Diesel exhaust also represents chronic respiratory effects, possibly the primary noncancer hazard from mobile source air toxics. Prolonged exposures may impair pulmonary function and could produce symptoms, such as cough, phlegm, and chronic bronchitis. Exposure relationships have not been developed from these studies. There have been other studies that address mobile source air toxic health impacts in proximity to roadways. The Health Effects Institute, a non-profit organization funded by EPA, FHWA, and industry, has undertaken a major series of studies to research nearroadway mobile source air toxics hot spots, the health implications of the entire mix of mobile source pollutants, and other topics. The final summary of this series is not expected for several years and as such, will not be available for use on this project. Some recent studies have reported that proximity to roadways is related to adverse health outcomes -- particularly respiratory problems. Much of this research is not specific to mobile source air toxics, instead surveying the full spectrum of both criteria and other pollutants. The FHWA cannot evaluate the validity of these studies, but more importantly, they do not provide information that would be useful to alleviate the uncertainties listed above and enable us to perform a more comprehensive evaluation of the health impacts specific to this project. Because of the uncertainties outlined above, a quantitative assessment of the effects of air toxic emissions impacts on human health has not been made for the project. While available tools 4-19
222 Capital Beltway Study Chapter 4 do allow us to reasonably predict relative emissions changes between alternatives for large projects, the amount of mobile source air toxic emissions from each of the project alternatives and mobile source air toxic concentrations or exposures created by each of the project alternatives cannot be predicted with enough accuracy to be useful in estimating health impacts. Therefore, the relevance of the unavailable or incomplete information is that it is not possible to make a determination with any certainty whether any of the alternatives would have "significant adverse impacts on the human environment. In lieu of a quantitative assessment, a qualitative assessment of mobile source air toxic emissions relative to the various alternatives has been prepared. While FHWA acknowledges that the project alternatives may result in increased exposure to mobile source air toxic emissions in certain locations, the concentrations and duration of exposures are uncertain, and because of this uncertainty, the health effects from these emissions cannot be estimated. This qualitative mobile source air toxic analysis focuses on the differences between the two build alternatives for the Capital Beltway and the impact that these differences may have on mobile source air toxic levels in the vicinity of the Capital Beltway. The Final EIS addresses two alternatives, a 10-lane and a 12-lane alternative, which have been reduced substantially in scope in response to comments from the public and Fairfax County following the Location Public Hearings. With the exception of the number of lanes, both of these alternatives are very similar. Both involve widening the existing Capital Beltway for 14 miles in the median, are located on the same alignment, and have the same termini (Interstate I-495 between the Springfield Interchange and the American Legion Bridge). Because of these similarities, the factors that may effect mobile source air toxic emissions and allow one to differentiate between alternatives will be operational characteristics such as vehicle miles traveled (VMT), average daily traffic (ADT) and the level of service which is a reflection of the congestion that each alternative will experience. Table 2-7, which shows the range of daily (peak) demand volumes (vehicles in one direction) in 2020, demonstrates that the daily demand volume for the 10-lane and 12-lane alternatives in the Final EIS will only be 6% and 8% higher, respectively, when compared to the No-Build Alternative while the difference in daily demand volume between the build alternatives themselves will be less than 2%. The increase in daily demand volume over the No-Build Alternative can be expected since the project would increase capacity on the Beltway and attract traffic from the adjacent and parallel arterial routes. This is also desirable since one of the components of the purpose and need for this project is to reduce congestion and increase throughput not only on the Beltway but the adjacent and parallel arterial routes as well, which are currently experiencing congestion due to cut-through traffic trying to avoid congestion on the Beltway. Therefore, to understand the total impact that the build alternatives may have on traffic and air toxics, one has to consider the adjacent road network as well as the mainline. In this case, the 12-lane alternative is the most effective at removing vehicles from the adjacent road network when compared to the 10-lane alternative. Likewise, the preferred alternative would intuitively be more effective than alternatives that would convert a general-purpose lane for use as a HOV or HOT lane. General speaking, alternatives that provide more capacity on the Beltway will be more effective at reducing congestion and increasing throughput on the Capital Beltway as well as the adjacent road network. 4-20
223 Environmental Consequences Capital Beltway Study When it comes to vehicle throughput, the mainline throughput of the 12-lane alternative is the greatest, accommodating over 20% more when compared to the No-Build Alternative. The 10-lane alternative will have a 13% increase in throughput when compared to the No-Build Alternative. At the on-ramps as well, the 12-lane alternative will have higher throughput since the additional capacity on the mainline will allow vehicles to gain faster entry onto the Beltway and minimize the backups that will form on the ramps and the queues that will form on adjacent streets. The capacity of both the 10-lane and 12-lane alternatives can handle the forecast demand on a daily basis with congestion limited to peak periods of between two and four hours each for the AM and PM peak periods. In contrast, the No-Build Alternative is unable to handle the forecast demand with congestion being experienced throughout the day. Approximately 10,000 vehicles that desire to use the Beltway under the no-build scenario would be forced to find other routes, increasing the amount of cut-through traffic on adjacent streets. This congestion, in turn, will be reflected in the peak hour travel speeds on the Beltway. According to Figure 2-7, both the 10-lane and 12-lane alternatives will allow for better travel speeds during peak periods than the No-Build Alternative; there are limited differences in travel speeds between the build alternatives themselves. In developing the Draft EIS, it was determined that 14 general-purpose lanes would be needed on the Beltway to reduce congestion (defined as non-free flow travel) and achieve an acceptable level of service throughout the day. However, this would have resulted in unacceptable impacts to the natural and human environment in the corridor. Therefore, it was decided that in order to achieve a tradeoff between impacts and benefits, the maximum number of lanes that would be considered for the build alternatives would be 12. Consequently, all of the alternatives that have been considered throughout the course of the EIS, including the two alternatives in the Final EIS, will experience several hours of congestion (see Figure 2-5). Compared to the No-Build Alternative, the 10-lane and 12- lane alternatives will have 3 and 5 hours of severe and moderate congestion less than the No-Build Alternative, respectively. Both the 10-lane and 12-lane alternatives will increase VMT on the Beltway compared to the No-Build Alternative. For example, there will be an 8% and 18% increase in AM peak hour VMT compared to the No-Build Alternative if the 10-lane and 12-lane alternatives are implemented, respectively. Likewise, there will be a 17% and 22% increase in PM peak hour VMT compared to the No-Build Alternative if the 10-lane and 12-lane alternatives are implemented, respectively. In comparing the 10 lane and the 12-lane alternatives, the VMT will be 11% higher for the 12-lane alternative compared to the 10-lane alternative for AM peak hour VMT and 6% higher for PM peak hour VMT. Although the additional lanes proposed under each of the build alternatives result in an increase in VMT, this increase would be offset by the reduction in VMT on adjacent roadways (see section 2.4.3). In determining the relevance of these operational characteristics with respect to mobile source air toxics, one must consider a few basic conclusions that a sensitivity analysis of EPA s Mobile6.2 model allows one to make. For example, the highest mobile source air toxic emission factors are associated with lower speeds while the emission factors associated with higher speeds decrease substantially, in comparison, before leveling out at 55 to 65 mph. Closely related to vehicle speed is the type of facility involved. All things being equal, higher 4-21
224 Capital Beltway Study Chapter 4 emission factors are associated with local streets while lower emission factors are associated with arterial facilities and the lowest emission factors are associated with freeway facilities. The higher the vehicle miles traveled on a freeway, the lower the mobile source air toxic emission factors on a per vehicle mile traveled basis. When VMT is compared between a local road and an arterial facility, mobile source air toxic emission factors from local roads are significantly higher than those from an arterial facility. Finally, the further one goes into the future, the greater the reduction in mobile source air toxic levels that will be realized due to various control programs and improvements in technology. This is reflected in the fact that the highest emission factors in EPA s Mobile6.2 model are associated with the current year while the lowest emission factors are associated with years extending into the future. Applying these concepts to the Beltway improvements, alternatives that are more effective at reducing congestion and reducing the time that vehicles sit in traffic at lower speeds will produce lower levels of mobile source air toxic emissions than those alternatives that don t. Freeway alternatives that reduce congestion better than other freeway alternatives will produce less mobile source air toxic emissions. Likewise, those alternatives that are more effective at reducing congestion on local streets and the adjacent arterial network by redirecting that traffic to the freeway will produce lower levels of mobile source air toxic emissions. Finally, a forecasted increase in VMT in the design year does not translate to an overall increase in mobile source air toxic levels in the project corridor because it is expected that substantial reductions in air toxics will be achieved over time even with increases in VMT. This is reinforced by EPA s final rule on mobile source air toxics, which concluded that on-highway emissions of benzene, formaldehyde, 1,3-butadiene, and acetaldehyde will be reduced by 67 to 76 percent and on-highway emissions of diesel particulate matter will be reduced by 90 percent between 1990 and 2020 due to existing and proposed control programs. Because EPA has regulated heavy-duty truck emission standards, emissions for heavy-duty on-road trucks are expected to be reduced dramatically between 1998 and 2010 with allowable particulate matter being reduced 98 percent and allowable nitrogen oxide emissions being reduced 97 percent. Applying these trends to the Washington, D.C. region, one could reasonably conclude that if no improvements were made to the capital Beltway and congestion was allowed to worsen while VMT increased at the rate forecasted, it is expected that the region would still realize reductions in air toxics over time. While the potential exists for there to be localized areas where ambient concentrations of mobile source air toxics could be higher under certain conditions under the build alternatives when compared to the No-Build Alternative, this potential is considered low since the majority of the improvements will occur within the median. While the addition of two lanes in the median to the outer loop, for example, will have the effect of moving traffic closer to the receptors located adjacent to the inner loop, it will also have the converse effect of moving that same traffic further away from the receptors located along the outer loop. Therefore, the resulting effect is one where the potential for increases in mobile source air toxics is offset by potential reductions. The potential for localized impacts has also been made low by the decision to significantly reduce the scope of the project and limit the majority of construction to the existing right-of-way limits. As a result, the relocation impacts associated with the alternatives in the Draft EIS have been reduced from a maximum of 326 homes and businesses to a maximum of 3 homes and businesses for the alternatives in the Final EIS. Likewise, the amount of right-of-way needed has been reduced from a maximum 168 acres to a maximum of 10 acres. 4-22
225 Environmental Consequences Capital Beltway Study In conclusion and summary, the mobile source air toxic issue is a continuing area of research and a developing issue which at present, is not fully understood to the point that it would allow one to quantify the health effects that the proposed project would have on the surrounding environment. As documented above, the technical capability of quantifying such effects with any degree of confidence are years off. Consequently, the mobile source air toxic issue will not inform the decision makers for this project as it relates to the significance of this issue. Likewise, there are limited differences between the build alternatives included in the Final EIS based on the operational characteristics addressed above. Since mobile source air toxic emissions are sensitive to these operational issues, this limited difference and its impact on air toxics is not expected to have any influence on the selection of an alternative by FHWA. Despite the increase in VMT associated with the preferred alternative, the preferred alternative provides greater benefits in reducing congestion, increasing travel speeds during peak periods, and removing traffic from local streets. When these benefits are taken into account with the reductions in air toxics that are expected over time due to EPA s vehicle and fuel regulations coupled with fleet turnover, the potential of the project to increase mobile source air toxic emissions is low. 4.7 NOISE Methodology Noise Prediction Model. Noise predictions for each alternative were performed with FHWA's Traffic Noise Model (TNM). The TNM incorporates algorithms for sound emissions and propagation that are based on well-established theory and accepted international standards. The acoustical algorithms contained in the TNM have been validated by carefully conducted noise measurement programs. The TNM version 1.0b was released in September 1999 for use on federal-aid highway noise projects nationwide. In September 2000, the TNM was updated (version 1.1) with useroriented enhancements. In February 2003, version 2.1 was released, with additional user enhancements and improved run time. While the three programs differ somewhat in appearance and functionality, their acoustical algorithms are the same. Because the analysis of the alternatives took place over a three-year period, all three versions of the model were used during this study. TNM versions 1.0b and 1.1 were used to calculate noise levels for the Candidate Build Alternatives studied in the Draft EIS, as well as for nearly all noises levels for the No-Build Alternative and existing conditions. TNM version 2.1 was used for the revised alternatives, including the Preferred Alternative, and for several locations for the No- Build Alternative and existing conditions that were added to the analysis. Another noise prediction model, FHWA s TNM lookup program (TNMLOOK), was used to help identify the loudest hour of the day. TNMLOOK provides a quick screening tool for evaluating simple highway geometrics by accessing a database of pre-calculated TNM results for an infinitely long, straight highway with sound propagation over flat ground, and by using various combinations of vehicle types and hard-or soft-sound propagation. Throughout the study area, traffic noise levels during the loudest hour of the day were determined for the existing (1998) conditions and the design-year (2020) no-build and build conditions. 4-23
226 Capital Beltway Study Chapter 4 The traffic data and engineering drawings developed for the EIS were used as input to the TNM. In general, sound propagation over acoustically soft ground (such as lawn) was assumed throughout the study area, except where sound propagation occurred over acoustically hard ground such as asphalt or water. The modeling also accounted for shielding due to terrain features, the edge of road, and rows of houses and other large structures. Existing noise barriers were identified during a field survey of the study area and were modeled for existing conditions and the future No-Build Alternative. However, existing noise barriers were not modeled for the Preferred Alternative considered in this Final EIS because they would be removed in all cases. It is important to note that it has been VDOT s practice to replace existing barriers that are removed as a result of a widening project. The impact numbers presented below reflect the removal but not the replacement of the barriers. Section includes a description of the noise abatement measures proposed as part of the Preferred Alternative. The analysis presented below provides detailed noise impact and mitigation information for the Preferred Alternative. Similar information is available for the Candidate Build Alternatives studied in the Draft EIS in the Noise Technical Report. The technical report also includes the complete noise analysis conducted for the Revised Alternative that was developed after the Draft EIS was published and before the Preferred Alternative was selected. Noise Model Validation. Traffic counts and vehicle classifications obtained during the noise measurements described in Chapter 3 were used to verify model predictions. The model results were compared to measured noise levels at 26 sites to provide a basis for incorporating appropriate noise propagation effects, such as terrain and rows of buildings, into the model predictions for each site. On average, the difference between computed and measured noise levels was approximately 3 dba (with a standard deviation of about 4 dba), representing a conservative over-prediction of traffic noise levels along the study corridor. Traffic Data for Noise Prediction. Traffic data for the highway noise computations included hourly volumes and speeds, broken down by automobiles and medium and heavy trucks, for existing conditions, future no-build conditions, and the Preferred Alternative. As required by FHWA and VDOT, the noise analysis was performed for the loudest hour of the day, which depends on the combination of vehicle volumes and speeds and the percentage of heavy trucks in the vehicle mix. The loudest hour of the day was found to vary from one end of the study area to the other. As a result, the study area was broken into five sections, with different loudest hours for each section Computed Existing and Future Noise Levels Figure 4-2 shows the locations for which noise levels were determined. Many additional locations were added to the 45 measurement sites for purposes of noise prediction to provide a comprehensive basis for the comparison of noise impact among each of the design-year build alternatives. A selection of additional Prediction Only sites are shown along with the measurement sites; the measurement sites are shown with an M prefix, and the prediction-only sites are shown with a P prefix. Table 4-7 shows the computed noise levels, which are A-weighted equivalent sound levels, or Leq, in dba (Section 3.7 provides a discussion of this descriptor). The sites represent areas where 4-24
227 Environmental Consequences Capital Beltway Study P57 M8 P55 P56A&B Legend: = Prediction-only = Measurement & Prediction P54A&B P52 M7 P53A&B M6 M5 P49 P50 P P47 M1 M4B P48 M3 P46 M2 P45 P43 P44 P42 P41 P40 Begin Project Approximate Scale (Miles) NOISE MEASUREMENT AND PREDICTION SITES I-95/I-395/I-495 Interchange to Little River Turnpike BLTWY078 Figure 4-2a (1 of 4) CAPITAL BELTWAY STUDY 4-25
228 Capital Beltway Study Chapter 4 P72 P71 P73 M17B M16 P69 M14B M15 P67 P68 P66 P64 P65 P63 M12B M P62 M11 M10B P61 M P59 P60 P58 Legend: = Prediction-only = Measurement & Prediction Approximate Scale (Miles) NOISE MEASUREMENT AND PREDICTION SITES Little River Turnpike to I-66 BLTWY079 Figure 4-2b (2 of 4) CAPITAL BELTWAY STUDY 4-26
229 Environmental Consequences Capital Beltway Study P90 P89A&B M26 Legend: = Prediction-only = Measurement & Prediction 495 M25 P88 P87 P86 P85 P84 M24 P83 M23 M22 M21 P77 M18 P74 M19B M19 P82 M20 P78 P80 P76 M35 P75 M39 P81 P79 M36 M17 P Approximate Scale (Miles) NOISE MEASUREMENT AND PREDICTION SITES I-66 to Dulles Access/Toll Road BLTWY080 Figure 4-2c (3 of 4) CAPITAL BELTWAY STUDY 4-27
230 Capital Beltway Study Chapter 4 Legend: = Prediction-only = Measurement & Prediction M34 End Project P100 M33 P98 M32 P99 P101 M31 P96 P97 P102 M P95 P91 P92 P94 M28 M27 P93 M Approximate Scale (Miles) NOISE MEASUREMENT AND PREDICTION SITES Dulles Access/Toll Road to American Legion Memorial Bridge BLTWY081 Figure 4-2d (4 of 4) CAPITAL BELTWAY STUDY 4-28
231 Environmental Consequences Capital Beltway Study Table 4-7 COMPUTED EXISTING AND FUTURE NOISE LEVELS Loudest-Hour L eq (dba) Distance to Edge of Nearest Project Road in meters 3 Site No. Description Land Use 1 Exterior or Interior Ground or Upper floor 2 Preferred Alt. Rev. 10-Lane HOV Existing No-Build Concurrent HOV Express/Local Barr.-Sep. HOV Preferred Alt. Rev. 10-Lane HOV Exist./No-Build Concurrent HOV Express/Local Barr.-Sep. HOV I-95/I-395/I-495 Interchange to Little River Turnpike M1 Flag Run Dr. cul-de-sac SF Exterior Ground M Axton St. SF Exterior Ground M Axton St. SF Exterior Ground M4B 5313 Ravensworth Dr. SF Exterior Ground M5 Fitzhugh Pk PK Exterior Ground M6 Wakefield Pk PK Exterior Ground M7 Americana/Oriskany Dr. MF Exterior Ground M8 Americana Pk. Baseball PK Exterior Ground P40 Skyles Way MF Exterior Ground NA NA NA NA P41 Kerr Dr. SF Exterior Ground NA NA NA NA P42 Springfield Swim Club Pool PK Exterior Ground NA NA NA NA P43 Long Pine Dr. SF Exterior Ground NA NA NA NA P44 Ivor St. SF Exterior Ground NA NA NA NA P45 N Springfield Elem. SCH Exterior Ground Interior Ground P46 Axton St. SF Exterior Ground P47 Lake Accotink Park PK Exterior Ground P48 Flag Run Park PK Exterior Ground P49 Adair Ln. SF Exterior Ground NA NA NA NA P50 Bristow Dr. SF Exterior Ground NA NA NA NA P51 Ravensworth Baptist Ch. W Exterior Ground NA NA NA NA Interior Ground NA NA NA NA P52 Wakefield Pk Tennis Ct PK Exterior Ground P53A Herkimer St. Apt. MF Exterior Ground P53B Herkimer St. Apt. MF Exterior Upper P54A Dassett Ct. Apt. MF Exterior Ground P54B Dassett Ct. Apt. MF Exterior Upper P55 Americana Park North PK Exterior Ground P56A Americana / Heritage Dr MF Exterior Ground NA NA NA NA P56B Americana / Heritage Dr MF Exterior Upper NA NA NA NA P57 Pineridge Dr. SF Exterior Ground
232 Capital Beltway Study Chapter 4 Table 4-7 COMPUTED EXISTING AND FUTURE NOISE LEVELS Loudest-Hour L eq (dba) Distance to Edge of Nearest Project Road in meters 3 Site No. Description Land Use 1 Exterior or Interior Ground or Upper floor 2 Preferred Alt. Rev. 10-Lane HOV Existing No-Build Concurrent HOV Express/Local Barr.-Sep. HOV Preferred Alt. Rev. 10-Lane HOV Exist./No-Build Concurrent HOV Express/Local Barr.-Sep. HOV Little River Turnpike to I-66 M9 Pence Ct. SF Exterior Ground M10B 3454 Luttrell Rd. SF Exterior Ground M Sycamore Dr. SF Exterior Ground M12B Yorktown Sq. Apts MF Exterior Ground M14B Roswell Dr. SF Exterior Ground M15 Shelby Ln. SF Exterior Ground M36 Center St. SF Exterior Ground NA NA NA NA M38 Yorktown Sq. Apts MF Exterior Ground P58 Estabrook Dr. SF Exterior Ground NA NA NA NA P59 Millcreek Dr. SF Exterior Ground NA NA NA NA P60 Annandale B-ball Ct. PK Exterior Ground P61 Accotink Valley Pk. PK Exterior Ground P62 Holly Rd. SF Exterior Ground NA NA NA NA P63 Yancey Dr. MF Exterior Ground P64 Word of Grace Fellowship W Exterior Ground Church Interior Ground P65 Jefferson District Park PK Exterior Ground P66 Heatherton Ln MF Exterior Ground P67 Pioneer Ln. SF Exterior Ground P68 Stone Hollow Dr. MF Exterior Ground P69 Pleasantdale Rd. MF Exterior Ground P70 Roswell Ct. SF Exterior Ground P75 Fallsmere Ct. SF Exterior Ground P79 Lexington Rd. SF Exterior Ground NA NA NA NA P81 Claremont Dr. SF Exterior Ground NA NA NA NA I-66 to Dulles Access/Toll Road M16 Wesleyan St. SF Exterior Ground M Cottage St. SF Exterior Ground NA NA 4 M17B Stenwood Elementary SCH Exterior Ground Interior Ground M18 Sandburg St. MF Exterior Ground NA 4 NA NA 4 NA
233 Environmental Consequences Capital Beltway Study Table 4-7 COMPUTED EXISTING AND FUTURE NOISE LEVELS Loudest-Hour L eq (dba) Distance to Edge of Nearest Project Road in meters 3 Site No. Description Land Use 1 Exterior or Interior Ground or Upper floor 2 Preferred Alt. Rev. 10-Lane HOV Existing No-Build Concurrent HOV Express/Local Barr.-Sep. HOV Preferred Alt. Rev. 10-Lane HOV Exist./No-Build Concurrent HOV Express/Local Barr.-Sep. HOV M19 End of Railroad St. SF Exterior Ground M19B Church at Dunn Loring W Exterior Ground Interior Ground M Helena Dr. SF Exterior Ground M21 Renaissance Apts. MF Exterior Ground M22 Renaissance Tennis Cts PK Exterior Ground M23 Marshall High School SCH Exterior Ground Interior Ground M24 End of Sandburg St. SF Exterior Ground M Old Meadow Rd. MF Exterior Upper M26 Scott s Crossing MF Exterior Ground M35 Idylwood Pk Ath. Field PK Exterior Ground M Leighton Dr. West SF Exterior Ground NA NA NA NA P71 Bowling Green Dr. SF Exterior Ground P72 Bowling Green Ct. SF Exterior Ground P73 Berea Ct. SF Exterior Ground P74 Sandburg Ct. SF Exterior Ground P76 Center St. SF Exterior Ground NA NA NA NA P77 Lellah Ct. SF Exterior Ground P78 Hurst St. SF Exterior Ground NA NA NA NA P80 Helena Dr. SF Exterior Ground NA NA NA NA P82 Providence St. SF Exterior Ground P83 Sandburg/Kelleher Rd. SF Exterior Ground P84 Madron Ln. MF Exterior Ground P85 Tyson Oaks Cir. MF Exterior Ground P86 Lisle Ave./Magarity Rd. SF Exterior Ground NA NA NA NA P87 Enola St. MF Exterior Ground P88 Wilson Ln. MF Exterior Ground P89A Old Springhouse Rd. MF Exterior Ground P89B Old Springhouse Rd. MF Exterior Upper P90 Spring Gate Dr. MF Exterior Ground
234 Capital Beltway Study Chapter 4 Table 4-7 COMPUTED EXISTING AND FUTURE NOISE LEVELS Loudest-Hour L eq (dba) Distance to Edge of Nearest Project Road in meters 3 Site No. Description Land Use 1 Exterior or Interior Ground or Upper floor 2 Preferred Alt. Rev. 10-Lane HOV Existing No-Build Concurrent HOV Express/Local Barr.-Sep. HOV Preferred Alt. Rev. 10-Lane HOV Exist./No-Build Concurrent HOV Express/Local Barr.-Sep. HOV Dulles Access/Toll Road to American Legion Bridge M Falstaff Rd. SF Exterior Ground M Timberly Ct. SF Exterior Ground M29 Box Elder Ct. SF Exterior Ground M Delf Dr. SF Exterior Ground M31 Helga Pl. / Peter Pl. SF Exterior Ground M32 Benjamin / Balls Hill Rd. SF Exterior Ground M Lawton St. SF Exterior Ground NA NA NA NA M Live Oak Dr. SF Exterior Ground NA NA NA NA P91 Gower Ct. SF Exterior Ground P92 Romeo Ct. SF Exterior Ground P93 Church of LDS W Exterior Ground Interior Ground P94 Huntmaster Ln. SF Exterior Ground P95 Dominion Ct. SF Exterior Ground P96 Spencer Rd. SF Exterior Ground P97 Salt Meadow Ln. SF Exterior Ground P98 Linganore Dr. SF Exterior Ground P99 Holyrood Dr. SF Exterior Ground P100 Live Oak Dr. SF Exterior Ground NA NA NA NA P101 McLean Bible W Exterior Ground Interior Ground P102 McLean Presbyterian W Exterior Ground Interior Ground Notes: 1. Types of land use: SF = Single-family residence; MF = Multi-family residence; SCH = School; W = Place of worship; and PK = Parks and recreation 2. Traffic noise levels were computed at the balcony locations of large, multi-story multi-family buildings; Ground indicates a noise level prediction at a ground floor exterior location, while Upper indicates a noise level prediction at a balcony location. In general, projected noise levels are greater at the balcony locations due to the loss of excess attenuation provided by ( acoustically ) soft ground. 3. In some cases, the nearest Project road may not be a mainline section of the Beltway, but a ramp or a local cross street. To convert from meters to feet, multiply by The indicated receptor(s) would be acquired by the Project, and so would be not applicable (N/A) for certain build alternatives. 4-32
235 Environmental Consequences Capital Beltway Study outdoor activity occurs. For multi-story apartment buildings that have balconies, traffic noise levels were computed and noise impact was assessed at balcony locations as well as at ground floor locations. In addition to residences, noise-sensitive land uses include churches, schools, and parks and recreational areas. If there were no exterior activities associated with such land uses, noise impact was evaluated with respect to the FHWA Noise Abatement Criteria (NAC) for interior activities, Category E. Following FHWA guidelines, interior noise levels are computed by subtracting the noise reduction factor of the building structure from the predicted exterior noise level. Based on typical wood frame construction with closed windows, an exterior-tointerior noise reduction of 25 dba was assumed for churches and schools. The Preferred Alternative is somewhat smaller in scale than the Candidate Build Alternatives studied in the Draft EIS. Project improvements do not extend as far along the Beltway at the northern and southern termini or away from the Beltway on intersecting roadways as do the improvements associated with the other alternatives. As a result, many of the measurement and prediction sites needed for the Draft EIS are outside of the study areas of the Preferred Alternative. The letters NA are given in Table 4-7 for the sound levels and distances at sites that are not adjacent to roadway improvements for the Preferred Alternative. Computed Noise Levels: Existing and Future No-Build. In some areas, design-year noise levels for the No-Build Alternative are expected to increase over existing noise levels by 1 to 4 db during the loudest hour of the day. In other areas, future no-build noise levels would remain the same or decrease by up to 3 db. On average, design-year no-build noise levels are expected to increase by approximately 1 db. This increase would be caused by an increase in projected traffic volumes and the mix of heavy trucks during the loudest hour. Computed Noise Levels: 2020 Build Alternatives. In some areas, future build noise levels are expected to increase by up to 19 decibels over existing noise levels during the loudest hour of the day, while in other areas, levels are expected to decrease. The average increase over existing noise levels is expected to be approximately 4 decibels, averaged over all sites and all build alternatives. The largest increases over existing noise levels would occur at sites that are currently located behind existing noise barriers; these sites would experience an average increase of 10 decibels when the existing noise barriers are removed. Some locations would experience a decrease from existing levels, primarily where the near travel lanes would be elevated on fill, thereby shielding the noise from the far lanes. In the paragraphs that follow, the average increase over existing noise levels is reported for all applicable sites (both with and without existing barriers) by section of the project. From the I-95/I-395/I-495 Interchange to Little River Turnpike, future noise levels are expected to increase by 3 decibels (on average) over existing noise levels with the Preferred Alternative. This average is based on about one-third fewer sites than documented in the Draft EIS because the southern terminus of the project for the Preferred Alternative is near Heming Avenue, north of the I-95/I-395/I-495 Interchange. Future build noise levels would range from 63 to 76 dba with the Preferred Alternative. From Little River Turnpike to I-66, future noise levels generated by traffic on the Preferred Alternative would be similar to all alternatives studied. The average increase of build noise 4-33
236 Capital Beltway Study Chapter 4 levels over existing levels would be approximately 3 decibels. Future build noise levels are expected to range from 61 to 78 dba with the Preferred Alternative. From I-66 to the Dulles Access/Toll Road, the future noise levels generated by traffic on the Preferred Alternative would be similar to all alternatives studied. The increase of build noise levels over existing levels would average approximately 3 decibels. Future build noise levels would range from 61 to 79 dba with the Preferred Alternative. From the Dulles Access/Toll Road to the American Legion Memorial Bridge, future traffic noise levels would increase to 62 to 75 dba with the Preferred Alternative Impact Assessment Under FHWA and VDOT guidelines and criteria, a noise impact occurs when projected noise levels approach or exceed FHWA's noise abatement criteria or substantially exceed existing noise levels. Residences. The number of residences exposed to noise impact would be greater with the Preferred Alternative than under existing conditions or the future No-Build Alternative. As shown in Table 4-8, noise impacts have been substantially reduced in the Preferred Alternative compared to the Candidate Build Alternatives studied in the Draft EIS. Table 4-8 TOTAL AND NET RESIDENTIAL NOISE IMPACTS BY ALTERNATIVE Number of Dwelling Units with Noise Impact Build (2020) Existing (1998) No- Build (2020) Preferred Alt. 12-Lane HOT Section I-95/I-395/I-495 Interchange (T) to Little River Turnpike (N) Little River Turnpike to I (T) 930 (N) I-66 to Dulles Access/Toll Road 1,235 1,227 1,359 (T) 1,330 (N) Revised Alt. 10-Lane HOV (T) (N) 833 (T) 810 (N) 1,369 (T) 1,340 (N) Concurrent HOV 1,743 (T) 1,482 (N) 898 (T) 866 (N) 1,375 (T) 1,346 (N) Express / Local 1,260 (T) 999 (N) 1,101 (T) 1,069 (N) 1,439 (T) 1,410 (N) Barrier- Separated HOV 1,647 (T) 1,386 (N) 839 (T) 807 (N) 1,280 (T) 1,251 (N) Dulles Access/Toll Road to American Legion Memorial Bridge (T) (N) (T) (N) 222 (T) 185 (N) 276 (T) 239 (N) 265 (T) 228 (N) TOTAL 2,502 3,054 3,233 1,2 3,069 1,2 4,238 4,076 4,031 NET 2,502 3,054 3,113 1,2 2,949 1,2 3,879 3,717 3,672 Note: The Total (T) number of impacts reflects the removal but not the replacement of existing noise barriers. Because it has been VDOT s practice to replace existing barriers that are removed as the result of a widening project, replacement of existing barriers is expected. The Net (N) number of impacts does not include those residences that are protected by existing noise barriers for designyear no-build conditions, and thus reflects the net effect of the project. 1 Counts for this alternative exclude the section of the Beltway between Backlick Road and the I-95/I-395/I-495 Interchange; no roadway improvements are planned for this area. 2 Counts for this alternative exclude the area from the Live Oak Drive overpass to American Legion Bridge. Table 4-8 provides a comparison of the total and net residential impacts by section of the corridor for existing conditions, the No-Build Alternative, the Candidate Build Alternatives studied in the Draft EIS, the revised 10-Lane (Concurrent) HOV Alternative, and the Preferred Alternative. The total impact reflects the removal but not the replacement of 4-34
237 Environmental Consequences Capital Beltway Study existing noise barriers. Because it has been VDOT s practice to replace existing barriers that are removed as the result of a widening project, replacement of existing barriers is expected. The net impact excludes those residences that are protected by existing noise barriers for design-year no-build conditions, and thus reflects the net effect of the project. The majority of impacted residences would be exposed to design-year (2020) traffic noise levels that approach or exceed 67 dba Leq (equal or exceed 66 dba Leq) during the loudest hour of the day; a small portion of the noise impact is due to substantial increases in existing noise of 10 decibels or more. For residences, noise impact was assessed at areas where outdoor activity occurs. While these exterior areas are commonly the yards, decks, or patios of single-family homes and townhouses, in the case of large multi-story apartment buildings, these exterior areas are balconies. For each of the large multi-story apartment buildings in the study area, noise impact was assessed at balcony locations. Throughout the study area, a number of noise-sensitive land uses would be exposed to project noise levels that would be 10 db or more above existing levels. Substantial increases of project noise over existing noise is due to several factors, including: the increase in projected (total) traffic volumes for each of the build alternatives; the loss of the acoustical shielding provided by rows of buildings that would be acquired by the Project; and the increase in projected heavy truck volumes along certain sections of the improved Beltway. A total of 2,502 dwelling units would be exposed to impact noise levels under existing (1998) conditions, while a total of 3,054 dwelling units would be impacted under the future No-Build Alternative. This increase in the number of impacted dwelling units is primarily due to the projected increase in heavy truck volumes that are expected to occur during the loudest hour of the day with the future No-Build Alternative (see Section 3.7). For each of the build alternatives, the number of residences exposed to future noise levels that equal or exceed 66 dba Leq is expected to increase compared to the number of homes exposed to these levels under existing conditions. Table 4-8 shows that significantly less noise impact would occur with the Preferred Alternative compared to the Candidate Build Alternatives studied in the Draft EIS. This difference is primarily because the improvements proposed under the Preferred Alternative are less extensive than those proposed for the Candidate Build Alternatives studied in the Draft EIS. The section where this effect is most pronounced is at the southern terminus. Smaller differences in noise impact due to the extent of the project improvements are observed at the northern terminus, where the improvements proposed as part of the Preferred Alternative end at the Live Oak Drive overpass, instead of extending to the American Legion Bridge. Existing and no-build impacts are tabulated for the full study corridor. Table 4-9 provides a breakdown of the Net residential noise impact by section of corridor and by type of impact for the Preferred Alternative. In this table, the number of dwelling units exposed to noise impact for existing conditions and the future No-Build Alternative 4-35
238 Capital Beltway Study Chapter 4 represent the number of homes where traffic noise levels equal or exceed 66 dba Leq. Impact for existing conditions and the No-Build Alternative are repeated in each of the following tables to make comparison more convenient. Table 4-9 BREAKDOWN OF NET RESIDENTIAL NOISE IMPACT FOR THE PREFERRED ALTERNATIVE Net Number of Dwelling Units with Noise Impact Build (2020) Section I-95/I-395/I-495 Interchange to Braddock Road Braddock Road to Little River Turnpike Little River Turnpike to Gallows Road Gallows Road to Arlington Boulevard Existing (1998) No-Build (2020) Approach or Exceed NAC Only Substantial Increase Only Both Approach or Exceed and Substantial Increase Arlington Boulevard to I I-66 to Leesburg Pike Leesburg Pike to Route Route 123 to Dulles Access/Toll Road Dulles Access/Toll Road to Georgetown Pike Georgetown Pike to American Legion Memorial Bridge Subtotals 2,502 3,054 2, Grand Totals 2,502 3,054 3,113 Note: The Net number of impacts does not include those residences that are protected by existing noise barriers for design-year no-build conditions, and thus reflects the net effect of the project. The replacement of existing barriers that are removed as a result of the Project is expected. 1 Counts for this alternative exclude the section of the Beltway between Heming Ave and the I-95/I-395/I-495 Interchange; no roadway improvements are planned for this area. 2 Counts for this alternative exclude the area from the Live Oak Drive overpass to American Legion Bridge. The net number of dwelling units exposed to noise impact was tabulated for three separate categories, or types of noise impact. The first type of noise impact occurs wherever project noise levels would equal or exceed 66 dba Leq, but the increase above existing levels would be less than 10 db (as shown in the fourth column of Table 4-9). The second type of noise impact occurs wherever the project alternative would cause a substantial increase in the existing noise level (10 db or more), but the design-year noise level would be less than 66 dba Leq (as shown in the fifth column). Finally, the third type of impact occurs where both conditions exist, i.e., where project noise levels would equal or exceed 66 dba Leq and the project alternative would cause a substantial increase over existing levels (as shown in the sixth column). For each section of the project corridor, the net noise impact is the sum of the number of dwelling units across the three types of impact. With the Preferred Alternative (Table 4-9), the net noise impact would total 3,113 dwelling units. Of these dwelling units, 2,991 would be exposed to build noise levels that equal or 4-36
239 Environmental Consequences Capital Beltway Study exceed 66 dba Leq, but would be less than 10 db above existing levels. In comparison, only 5 residences would experience project noise levels that would be 10 db or more above existing levels, but less than 66 dba Leq, and 117 homes would experience both increases in project noise levels of 10 db or more and project noise levels that equal or exceed 66 dba Leq. Non-residential Noise-sensitive Land Uses. The potential noise impacts due to the proposed improvements were also assessed at non-residential noise-sensitive land uses including places of worship, schools, and parks and recreation areas. Places of Worship Ravensworth Baptist Church is located east of the Beltway along Ravensworth Road, and is represented by Site P51 in Table 4-7 and Figure 4-2. The Ravensworth Baptist Church is outside of the project study area because no project improvements are planned in the vicinity. The Word of Grace Fellowship Church on Hartland Road (Site P64 in Table 4-7 and Figure 4-2) would be exposed to future exterior noise levels of up to 77 dba with the Preferred Alternative. Because the church does not have any designated outdoor activity areas and is air-conditioned, noise impacts were assessed with respect to the interior NAC of 52 dba. Based on an exterior-to-interior noise reduction of 25 dba, noise impact would occur at the church under the Preferred Alternative. The existing interior noise level is 51 dba, and the future no-build level would be up to 53 dba; both represent impact noise levels. The Church at Dunn Loring is located west of the Beltway on Morgan Lane, and is represented by Site M19B in Table 4-7 and Figure 4-2. Future exterior noise levels at the church would be up to 79 dba with the Preferred Alternative. Because the church does not have any designated outdoor activity areas and is air-conditioned, noise impacts were assessed with respect to the interior NAC of 52 dba. Based on an exterior-to-interior noise reduction of 25 dba, future noise impact is expected with the Preferred Alternative. Existing and no-build levels are 51 dba, representing impact sound levels. The Church of Latter Day Saints on Scotts Run Road east of the Beltway (Site P93 in Table 4-7 and Figure 4-2) would be exposed to future traffic (exterior) noise levels of 66 dba under the Preferred Alternative. Because the church does not have any designated outdoor activity areas facing the Beltway and is air-conditioned, noise impacts were assessed with respect to the interior NAC of 52 dba. Future interior noise levels are not expected to exceed 44 dba during the loudest hour of the day; therefore, noise impact is not expected to occur at this church. Existing and no-build noise levels are similar. The McLean Presbyterian Church (Site P102 in Table 4-7 and Figure 4-2) would experience future exterior noise levels of 73 dba with the Preferred Alternative. The playground on the north side of the building would be impacted under the Preferred Alternative. Noise impacts at the church also were assessed with respect to the interior NAC of 52 dba. Interior noise impacts are not expected to occur at the church under the Preferred Alternative which would have an interior noise level would be 48 dba. Existing and no-build interior levels are 48 dba and 46 dba, respectively. The McLean Bible Church (Site P101 in Table 4-7 and Figure 4-2) is located in a neighborhood that has an existing noise barrier that would be removed as a result of the project. Even if the existing barrier were removed but not replaced, interior noise impact would not occur at this church under the Preferred Alternative. Because it has been 4-37
240 Capital Beltway Study Chapter 4 VDOT s practice to replace such barriers in similar situations, replacement of the noise barrier for the Balmacra/River Oaks (east) community is expected. Schools Exterior activity areas at the North Springfield Elementary School (Site P45 in Table 4-7 and Figure 4-2) include a playground and courts on the north side of the west wing of the school building. The west wing of the school building shields these outside activity areas from Beltway traffic noise. Consequently, noise impacts at the North Springfield Elementary School were assessed with respect to the FHWA NAC for Activity Category E, which is based on an interior noise level of 52 dba. Because the school is air-conditioned, a closed-window outdoor-to-indoor noise reduction of 25 dba was assumed. Future interior noise levels are not expected to exceed 50 dba during the loudest hour of the day with the Preferred Alternative; therefore, noise impact at the school is not expected. The Stenwood Elementary School (Site M17B in Table 4-7 and Figure 4-2) is located in the Dunn Loring Woods neighborhood, which has an existing noise barrier. If the existing barrier were removed but not replaced, noise impact would occur in the exterior activity areas at the school. Because it has been VDOT s practice to replace such barriers in similar situations, replacement of the noise barrier for Dunn Loring Woods is expected, which would mitigate the noise impact at the school. The athletic fields at Marshall High School (Site M23 in Table 4-7 and Figure 4-2) would be exposed to future noise levels of 69 dba with the Preferred Alternative. Therefore, these outdoor activity areas would be exposed to noise impacts with the Preferred Alternative. However, interior noise levels are not expected to exceed 45 dba; therefore, project noise would not impact interior activities at the school. Parks and Recreation Areas Table 4-10 provides a summary of the parks and recreation areas affected by project noise. This table provides the average distance at which project noise levels would approach or exceed the FHWA NAC for Activity Category B (exterior) as measured from the edge of the nearest project road, and a summary of the projected noise impact. The distances shown in Table 4-10 reflect the removal but not the replacement of existing barriers. Because it has been VDOT s practice to replace barriers that are removed as the result of a widening project, replacement of existing barriers is expected. The result would be the elimination of noise impacts in those parks and recreation areas that are behind existing barriers. The FHWA NAC are based upon noise levels associated with human speech interference. The FHWA NAC represent a compromise between noise levels that are desirable and those that are achievable. For these reasons, although project noise levels may approach or exceed the FHWA NAC in certain portions of a park or recreation area, unless those portions of the noise-sensitive areas receive frequent human use, noise impact would not occur. That is, for a park or recreation area (or some portion of such a land use) to be exposed to noise impact, it must experience frequent human use. Therefore, Table 4-10 lists noise impacts for park and recreation activity areas where project noise levels approach or exceed the NAC, and not for areas with infrequent use Noise Abatement FHWA has identified certain noise abatement measures that may be incorporated in projects to reduce traffic noise impact. Abatement measures that have been considered for this 4-38
241 Environmental Consequences Capital Beltway Study project include traffic management, alteration of horizontal and vertical alignment, and construction of noise barriers. Traffic management measures that have been considered for noise abatement include reduced speeds and truck restrictions for the design-year build alternatives. Reduced speeds are not an effective noise mitigation measure because a substantial decrease in speed is necessary to provide a meaningful noise reduction. A 10 mph (16 kph) reduction in speed will result in only a 2-dBA decrease in noise level. Truck restrictions would not be considered a feasible noise abatement measure because the very purpose of the existing interstate facility is to move large volumes of traffic including trucks. Table 4-10 PARKS AND RECREATION AREAS: AVERAGE DISTANCE AT WHICH PROJECT NOISE LEVELS APPROACH OR EXCEED FHWA NAC AND IMPACT SUMMARY Park Name Average Distance at which Project Noise Levels Equal or Exceed 66 dba (in meters) 1 Preferred Alt. Rev. 10-Lane HOV Existing Future No- Build Concurrent HOV Express/ Local Barrier- Separated HOV Preferred Alt. Activity Areas Exposed to Noise Impact? (Yes or No) I-95/I-395/I-495 Interchange to Little River Turnpike Springfield Swim Club NA 2 NA NA 2 NA 2 No Yes Yes Yes Yes Americana Park Yes Yes Yes Yes Yes Yes Yes Fitzhugh Park Yes Yes Yes Yes Yes Yes Yes Flag Run Park No No No No No No No Lake Accotink Park No No No No No No No Wakefield Park Yes Yes Yes Yes Yes Yes Yes Wakefield Park Tennis Courts Yes Yes Yes Yes Yes Yes Yes Little River Turnpike to I-66 Accotink Stream Valley Park No No No No No No No Annandale Community No No No No No No No Jefferson District Park No No No No No No No I-66 to Dulles Access/Toll Road Idylwood Park Yes Yes Yes Yes Yes Yes Yes Lisle Park NA 2 NA NA 2 NA 2 Yes Yes Yes Yes Yes Washington and Old Dominion Railroad Regional Park Yes Yes Yes Yes Yes Yes Yes Dulles Access/Toll Road to American Legion Memorial Bridge McLean Hamlet Park NA 2 NA NA 2 NA 2 No No No No No Scott's Run Nature Preserve No No No No No No No Scott's Run Stream Valley Park No No No No No No No Timberly Park No No No No No No No 1. Distance is given in meters as measured from edge of Project road, and reflects the removal but not the replacement of existing barriers; to convert from meters to feet multiply by Park is outside of the study area for this alternative; no project roadway improvements are proposed in the immediate vicinity. Rev. 10-Lane HOV Existing Future No- Build Concurrent HOV Express/ Local Barrier- Separated HOV The alteration of horizontal alignment is limited by the extensive existing development along the project corridors. Meaningful noise reduction at noise-sensitive locations would require 4-39
242 Capital Beltway Study Chapter 4 large alignment shifts, which would necessitate huge additional property takings and could expose additional sites to project noise. The alteration of vertical alignment is not feasible because depressing the roadway would require taking of additional property for the sloped embankments, or excessive costs for the construction of sound-absorptive retaining walls. Noise Barriers. The only remaining abatement alternative investigated was the construction of noise barriers. The feasibility and reasonableness of noise barriers was studied at all locations where build alternatives would cause noise impacts within 1,000 feet (300 meters) of the road. At distances greater than 1,000 feet, the noise prediction model is not considered especially reliable, and the influence of the Beltway on ambient noise levels would be substantially diminished. Where the construction of noise barriers was found to be feasible, barrier noise reduction was estimated based on roadway, barrier, and receiver geometry, as described below. Table 4-11 summarizes the noise barriers evaluated and the number of dwelling units protected by the barriers for the Preferred Alternative. A dwelling unit is protected if it is exposed to future noise impact (without a barrier) and would receive at least 5 decibels of noise reduction from a barrier. By comparison, a dwelling unit is benefited if it is not exposed to future noise impact, but still receives at least 5 decibels of noise reduction from a barrier designed to protect other homes. The reasonableness of noise barriers for non-residential noise-sensitive land uses (including churches, schools, and parks and recreation areas) is determined during final design on a case-by-case basis with respect to the type and duration of activity, size of the affected area, severity of impact, total cost, and the amount of noise reduction. Table 4-11 SUMMARY OF EVALUATED NOISE BARRIERS BY ALTERNATIVE Build Alternative Preferred Alt. 12-Lane HOT Revised 10- Lane HOV Concurrent HOV Express- Local Barrier- Separated HOV Total Homes Impacted 3,233 3,069 4,238 4,076 4,031 Total Homes Protected 2,943 2,902 3,900 3,616 3,875 Total Homes Protected (including Benefited) Total Homes Protected by Cost-Effective Barriers Total Homes Protected (including Benefited) by Cost-Effective Barriers Total Cost of all Barriers (including Barriers with 3 rd Party Funding) Total Cost of all Barriers that meet VDOT's cost-effectiveness criteria 4,198 4,237 5,213 5,289 5,219 2,888 2,839 3,823 3,537 3,793 4,122 4,166 5,123 5,199 5,129 $31,650,000 $32,240,000 $43,010,000 $43,160,000 $42,440,000 $25,470,000 $26,180,000 $35,680,000 $35,830,000 $35,110,000 Feasibility and Reasonableness. Total barrier costs were calculated assuming a unit cost of $16 per square foot ($172 per square meter), per the VDOT guidelines in force when the Draft EIS was issued. Where noise barriers would be physically feasible and could provide at least 5 decibels of noise reduction, barrier reasonableness was then based on VDOT s cost-effectiveness criterion: a maximum of $30,000 per protected or benefited dwelling 4-40
243 Environmental Consequences Capital Beltway Study unit. It is expected that the traffic projections will be revisited during final design which could affect the conclusions regarding noise barriers. Third Party Funding of Noise Barriers. Upon completion of the final noise barrier design, should a barrier cost exceed the criterion of $30,000 per protected or benefited home, additional funding must be secured before the barrier will receive further consideration. Third-party funding must come from any source other than VDOT or FHWA and must be committed in writing to VDOT within 90 days following public notification. Without the written commitments by the specified deadline, a third-party-funded barrier will not receive further consideration. Existing Noise Barriers. Several existing noise barriers in the study area would have to be removed to widen the Beltway with the Preferred Alternative. Any existing barriers that would be removed would then be replaced by barriers built as part of the project. It has been VDOT s practice to replace any barriers removed because of widening projects. To compute the cost-effectiveness for the replacement barriers, existing-barrier costs were subtracted from replacement-barrier costs then divided by the number of residences (dwelling units) protected/benefited. In Table 4-12 and corresponding discussion, this cost per home is labeled Net. In all cost-effectiveness computations, barrier costs assume unit costs of $172 per square meter ($16 per square foot), per VDOT guidelines. Figure 3-11 shows the locations of existing noise barriers in the study area (see Chapter 3). Barrier Descriptions. The following sections provide detailed descriptions about each of the potential noise barriers for the Preferred Alternative. Figure 4-3 shows the locations of all feasible noise barriers for the Preferred Alternative. Some of the barriers are broken into separate segments to accommodate cross streets. Table 4-12 describes each potential noise barrier, including total length, range of heights, the number of protected homes, the number of benefited homes, types of noise-sensitive land use protected and/or benefited, the estimated cost, and the cost per home. Where both Total and Net costs and protection are shown, the difference is the cost and protection of an existing barrier that would be removed by the project. The Noise Technical Report provides further detail about each of the potential barriers for all of the build alternatives. Noise Barrier 5B. This barrier, which would replace an existing barrier, extends from the southwest quadrant of the Braddock Road/I-495 interchange to the southern terminus of the project near Backlick Road. The project southern terminus is near Heming Avenue. With the Preferred Alternative, a barrier 768 meters (2,519 feet) long and ranging in height from 2 to 7 meters (7 to 23 feet) would protect a total of 19 homes, benefit 8 additional homes, and protect portions of Lake Accotink Park. The total barrier cost would be $590,000, and the net cost per home would be $18,800. This barrier is cost effective without including the benefit provided to portions of the park. Noise Barrier 5C. This barrier would replace the existing barrier that extends from the project s southern terminus to the southeast quadrant of the Braddock Road/I-495 interchange. With the Preferred Alternative, Barrier 5C would have a length of 1,675 meters (5,494 feet), range in height from 2 to 7 meters (7 to 23 feet) and have a total cost of approximately $1.1 million. The barrier would protect a total of 55 homes (including those homes protected by the existing barrier) as well as the North Springfield Elementary School and portions of Flag Run Park. The barrier would benefit 36 additional homes, and have a net cost per home of $10,130. This barrier would meet VDOT s cost-effectiveness criterion. 4-41
244 Capital Beltway Study Chapter 4 7A 7B Note: General locations of noise barriers shown on existing base map. 6A 6B 495 5C 5B Begin Project Approximate Scale (Miles) LOCATIONS OF POTENTIAL NOISE BARRIER AREAS I-95/I-395/I-495 Interchange to Little River Turnpike BLTWY082 Figure 4-3a (1 of 4) CAPITAL BELTWAY STUDY 4-42
245 Environmental Consequences Capital Beltway Study 10C 10D 9A 9B 9E 9C 495 8A 7A 7B Approximate Scale (Miles) 6A 6B Note: General locations of noise barriers shown on existing base map. BLTWY083 LOCATIONS OF POTENTIAL NOISE BARRIER AREAS Little River Turnpike to I-66 Figure 4-3b (2 of 4) CAPITAL BELTWAY STUDY 4-43
246 Capital Beltway Study Chapter A Note: General locations of noise barriers shown on existing base map. 11A 10A 10K 10B 10J 10G 10C 10D 9E 9A Approximate Scale (Miles) 9B 9C BLTWY084 LOCATIONS OF POTENTIAL NOISE BARRIER AREAS I-66 to Dulles Access/Toll Road Figure 4-3c (3 of 4) CAPITAL BELTWAY STUDY 4-44
247 Environmental Consequences Capital Beltway Study Note: General locations of noise barriers shown on existing base map. End Project 14C 13A 13E 13B 13D 13C A Approximate Scale (Miles) 11A BLTWY085 LOCATIONS OF POTENTIAL NOISE BARRIER AREAS Dulles Access/Toll Road to American Legion Memorial Bridge Figure 4-3d (4 of 4) CAPITAL BELTWAY STUDY 4-45
248 Capital Beltway Study Chapter 4 Table 4-12 DESCRIPTIONS OF NOISE BARRIERS EVALUATED FOR THE PREFERRED ALTERNATIVE Barrier No. Length (meters) (note 1) Range of Heights (meters) (note 1) Cost (note 2) Noise-sensitive Land Use (note 3) Protected (note 4) 5B to 7 $590,000 (Total) 19 res. (Total), park 5C 1,675 2 to 7 $1,080,000 (Total) 55 res. (Total), park, school Benefited (note 5) Cost per Home (note 6) 8 res. $21,850 (Total) $150,000 (Net) 0 res. (Net) $18,800 (Net) 36 res. $11,870 (Total) $790,000 (Net) 42 res. (Net) $10,130 (Net) 6A 3,233 3 to 9 $2,870,000 Park 3 res. N/A 6B 3,492 2 to 9 $3,420,000 (Total) 663 res. (Total), park 120 res. $4,370 (Total) $3,210,000 (Net) 653 res. (Net) $4,150 (Net) 7A 2,181 5 to 8 $2,420,000 (Total) 73 res. (Total), park 24 res. (Total) $24,900 (Total) $1,990,000 (Net) 55 res. (Net) $25,200 (Net) 7B 2,335 2 to 7 $2,320, res. 85 res., rec. area $9,960 8A to 11 $1,030,000 (Total) 5 res. (Total) 50 res. $18,700 (Total) $480,000 (Net) 0 res. (Net) $9,600 (Net) 9A $370, res. --- $3,200 9B to 5 $790, res., ch. 79 res. $2,300 9C to 6 $690, res. 18 res. $3,600 9E 1,660 3 to 8 $1,530,000 (Total) 98 res. (Total) 75 res., park $8,800 (Total) $910,000 (Net) 98 res. (Net) $5,300 (Net) 10A 1,063 3 to 5 $710,000 (Total) 68 res. (Total) 85 res. $4,600 (Total) $580,000 (Net) 58 res. (Net) $4,100 (Net) 10B to 5 $280, res., ch. --- $14,000 10C 1,562 3 to 5 $1,090,000 (Total) 48 res. (Total) --- $22,700 (Total) $420,000 (Net) 29 res. (Net) $14,500 (Net) 10D 1,367 3 to 6 $1,150, res., sch. 31 res. $8,000 10G to 8 $640, res. --- $26,700 10J to 7 $330, res. --- $17,000 10K 1,082 4 to 8 $1,240, res., sch. 146 res. $3,800 11A 1,215 9 $1,880, res., park 379 res. $2,600 12A to 12 $1,040, res. 47 res. $2,400 13A 1,007 3 to 5 $610, res. 5 res., park $32,000 13B 1,143 5 to 8 $1,250, res. 13 res., park $33,800 13C 1,596 4 to 9 $1,710,000 (Total) 33 res. (Total) 43 res., park $22,500 (Total) $990,000 (Net) 25 res. (Net) $14,600 (Net) 13D 1,132 4 to 9 $1,200, res., ch. --- $109,
249 Environmental Consequences Capital Beltway Study Table 4-12 DESCRIPTIONS OF NOISE BARRIERS EVALUATED FOR THE PREFERRED ALTERNATIVE Barrier No. Length (meters) (note 1) Range of Heights (meters) (note 1) Cost (note 2) Noise-sensitive Land Use (note 3) Protected (note 4) Benefited (note 5) Cost per Home (note 6) 13E 1,226 3 to 8 $1,170, res., ch. 8 res. $27,200 14C $250,000 6 res. park $41,700 Notes: 1.) To convert from meters to feet, multiply by ) Costs are based on a statewide average unit cost of $172 per square meter ($16 per square foot) intended only for costeffectiveness calculations, and should not be used as an engineers estimate for construction costs. (Total) = the total cost of a replacement noise barrier (where a noise barrier now exists but must be replaced). (Net) = the cost of the replacement barrier minus the cost of the existing barrier that would be replaced. 3.) Land Use : res. = residence (single-family, townhouse, or individual unit in multi-family building); park = parks and recreational land use; sch. = school; ch. = church/place of worship. 4.) A noise-sensitive land use is protected if (1) it receives at least 5 db of noise reduction and (2) it is exposed to future noise impact. Total = total number of dwelling units protected by the replacement barrier (including those homes protected by the existing barrier); Net = the total number of dwelling units protected by the replacement barrier minus the number of dwelling units protected by the existing barrier. 5.) A noise-sensitive land use is benefited if (1) it receives at least 5 db of noise reduction but is not exposed to future noise impact. 6.) Cost divided by the sum of all protected and all benefited dwelling units that is, by all dwelling units that receive at least 5 db of noise reduction, whether impacted or not. The cost per home is not applicable for barriers that are designed to protect parks and other non-residential noise-sensitive land use; the reasonableness of such barriers is determined on a case-by-case basis taking into account the total cost of the barrier, the severity of impact, the amount of noise reduction, the type and duration of activity, and the size of the affected area. Noise Barrier 6A. This barrier is designed primarily for the protection of Wakefield Park and Americana Park, and extends along the length of I-495 southbound between Little River Turnpike and Braddock Road. To benefit residential properties along the southwestern quadrant of the Little River Turnpike interchange, the barrier could extend to the west along Little River Turnpike. Although access issues would likely prohibit barriers from being built along Little River Turnpike, barrier designs were evaluated for this area. For the Preferred Alternative, Barrier 6A would be 3,233 meters (10,604 feet) long, range in height from 3 to 9 meters (10 to 30 feet), and cost about $2.9 million. The reasonableness and cost-effectiveness of this barrier depends upon the noise sensitivity of the park properties, and would be evaluated on a case-by-case basis. Noise Barrier 6B. This barrier would replace two existing barriers and protect residences and Fitzhugh Park, extending from the northeast quadrant of the Braddock Road interchange to the southeast quadrant of the Little River Turnpike interchange. For the Preferred Alternative, Barrier 6B would be 3,492 meters (11,454 feet) long, range in height from 2 to 9 meters (7 to 30 feet), and have a total cost of about $3.4 million. Under the Preferred Alternative, 663 homes would be protected, 120 would be benefited, and the barrier s net cost per home would be $4,150. Fitzhugh Park also would be protected with the barrier. Noise Barrier 6B is cost-effective without including the benefit provided to Fitzhugh Park. Noise Barrier 7A. This barrier would replace an existing barrier and protect residences and the Accotink Stream Valley Park, extending from the Gallows Road interchange to the Little River Turnpike interchange along the west side of I-495. The total cost of the barrier that would replace the existing barriers would be approximately $2.4 million. For the Preferred Alternative, the barrier would be 2,181 meters (7,154 feet) long and range in height from
250 Capital Beltway Study Chapter 4 to 8 meters (16 to 26 feet). Barrier 7A would protect 73 homes and portions of the park, and benefit 24 additional homes. The barrier s net cost per home would be $25,200. Barrier 7A meets VDOT s cost-effectiveness criterion for both alternatives, without including the benefit provided to Accotink Stream Valley Park. Noise Barrier 7B. This barrier would protect a residential area, and extend along the east side of I-495 from the Little River Turnpike interchange to the Gallows Road interchange. For the Preferred Alternative, Barrier 7B would be 2,335 meters (7,659 feet) long, range in height from 2 to 7 meters (7 to 23 feet), and have a total cost of about $2.3 million. The barrier would protect 148 homes, and benefit another 85 homes and the Annandale basketball court. The cost per home is $9,960, meeting VDOT s cost-effectiveness criterion. Noise Barrier 8A. This barrier would replace the existing barrier that extends from the northeast quadrant of the Gallows Road interchange to midway between the Gallows Road and Route 50 interchanges. Barrier 8A would be 690 meters (2,263 feet) long, range in height from 7 to 11 meters (23 to 36 feet), and have a Total cost of about $1.0 million. Five homes are protected and 50 benefited with this barrier, and the net cost per home is approximately $10,000. Barrier 8A would meet VDOT s cost-effectiveness criterion. Noise Barrier 9A. This barrier would protect the townhouses adjacent to Dellway Lane and Knollside Lane, west of the I-66 / I-495 interchange, near the project terminus on I-66 west. For the Preferred Alternative, this barrier would have a length of 712 meters (2335 feet), and a uniform height of 3 meters (10 feet). The total cost of this barrier is $370,000. The barrier would protect 116 homes impacted under the Preferred Alternative, at a cost of $3,200 per home. Barrier 9A meets VDOT s cost-effectiveness criterion. Noise Barrier 9B. This potential barrier is designed to protect the Merrifield Village Apartments adjacent to Hartland Road and Pleasantdale Road, and the Word of Grace Fellowship Church on Hartland Road. The barrier for the Preferred Alternative would be 945 meters (3106 feet) in length, and would have a height range of 4 to 5 meters (13 to 16 feet). This barrier would protect all 265 homes and the church, and benefit an additional 79 homes. This barrier design would cost $790,000, or $2,300 per home, meeting the VDOT cost-effectiveness criterion. Noise Barrier 9C. This barrier is designed to protect the Yorktown Square Condominiums along Charing Cross Road and Kings Chapel Road. For the Preferred Alternative, Barrier 9C would be 850 meters (2790 feet) long, and have a height range of 3 to 6 meters (10 to 20 feet). The barrier would protect all 174 homes, and benefit an additional 18 homes. The barrier would cost $690,000, or $3,600 per home, thereby meeting VDOT s costeffectiveness criterion. Noise Barrier 9E. This barrier is designed to protect single-family homes in the southeast quadrant of the I-66 interchange and would replace an existing barrier. With the Preferred Alternative, more first-row impacts are expected than for the Candidate Build Alternatives studied in the Draft EIS, because the existing first row of homes in this area has a higher building density, and would not be excluded as takes for the Preferred Alternative, as they previously were. 4-48
251 Environmental Consequences Capital Beltway Study For the Preferred Alternative the barrier would be 1,660 meters (5,445 feet) long, range in height from 3 to 8 meters (10 to 26 feet) and would have a total cost of just over $1.5 million. This barrier would protect the 98 homes impacted with this alternative, and benefit an additional 75 homes and Jefferson District Park. The net cost of this barrier would be $5,300 per home, meeting VDOT s cost-effectiveness criterion. Noise Barrier 10A. Barrier 10A would extend from the southwest quadrant of the Rt.7/I-495 interchange to the Oak Street overpass replacing an existing barrier. For the Preferred Alternative, Barrier 10A would have a length of 1063 meters (3490 feet), and a height range of 3 to 5 meters (10 to 16 feet). The barrier would protect all 68 impacted homes, and benefit another 85 homes. The barrier would cost $710,000 and have a net cost of $4,100 per home, thus meeting VDOT s cost-effectiveness criterion. Noise Barrier 10B. This barrier was evaluated for the residential properties between the Oak Street overpass and the Idylwood Lane overpass on the west side of I-495. Noise impact is also predicted for the Church at Dunn Loring. For the Preferred Alternative, a barrier could protect all 20 impacted residences and the church. The barrier would have a length of 349 meters (1150 feet), and a height range of 3 to 5 meters (10 to 16 feet). The barrier would have a total cost of $280,000, or $14,000 per home, thereby meeting VDOT s cost-effectiveness criterion. Noise Barrier 10C. This barrier would extend from Idylwood Road to Gallows Road on the west side of I-495, and is designed to protect the Washington & Old Dominion trail, the Iliff Nursing & Rehabilitation Center, and single family homes adjacent to Woodcroft Court, Sandburg Street, and Stenhouse Place. The barrier would replace the existing barrier, which runs from Gallows Road to the vicinity of Sandburg Court. With the Preferred Alternative, Barrier 10C would have a length of 1,562 meters (5,120 feet), and a height range of 3 to 5 meters (10 to 16 feet). The barrier would protect 48 homes for both of these alternatives. The barrier would have a total cost of about $1 million, with a net cost of $14,500 per home. The barrier meets VDOT s cost-effectiveness criterion. In addition to the residential protection provided, the barrier would protect the Iliff Nursing and Rehabilitation Center, the W&O Dominion Trail, and the parkland adjacent to it. Noise Barrier 10D. This barrier would extend from Gallows Road to the project s western terminus along I-66. For the Preferred Alternative, the barrier would range from 3 to 6 meters (10 to 20 feet) in height, and have a length of 1,367 meters (4,490 feet). The barrier would protect 113 homes and Stenwood Elementary School, and benefit another 31 homes, at a total cost of about $1.2 million, or $8,000 per home. Noise Barrier 10D would meet VDOT s cost-effectiveness criterion. Noise Barrier 10G. This barrier would protect homes along Nottingham Drive, and, in three of the alternatives, Idylwood Park. The barrier would extend along the northeast quadrant of the I-66/I-495 interchange from Virginia Lane to Idylwood Road. The barrier for the Preferred Alternative would be 685 meters (2,247 feet) in length, and would range in height from 3 to 8 meters (10 to 26 feet). The barrier would protect 24 homes impacted 4-49
252 Capital Beltway Study Chapter 4 and cost $640,000, or $26,700 per home. Barrier 10G would meet the VDOT costeffectiveness criterion. However, the barrier could not be extended to protect the park as well, and remain costeffective. The reasonableness and cost-effectiveness of extending this barrier to protect the park depends upon the noise sensitivity of the park, and would be evaluated on a case-bycase basis. Noise Barrier 10J. This barrier would extend from Idylwood Road to Oak Street, and would protect homes in this area along Helena Drive, Providence Street, and Division Avenue. Barrier 10J would range in height from 5 to 7 meters (16 to 23 feet) and would have a length of 311 meters (1,020 feet). A total of 20 homes would be protected, at a total barrier cost of $330,000, or $17,000 per home. This barrier meets VDOT s costeffectiveness criterion. Noise Barrier 10K. This barrier would be designed to protect the athletic fields at George C. Marshall High School and the Renaissance Apartments. Barrier 10K would be 1,082 meters (3,550 feet) in length, and would have a height range of 4 to 8 meters (13 to 26 feet). The barrier would protect all 179 homes and the school impacted under this alternative and benefit an additional 146 homes. This barrier design would cost over $1.2 million, and $3,900 per home. This barrier would meet VDOT s cost-effectiveness criterion. Noise Barrier 11A. This barrier is designed to protect the homes east of I-495 between the I- 495 interchanges with Route 7 and Route 123, including the Regency at McLean high-rise apartments, and homes along Wilson Drive, Enola Street, and Scotts Run. The barrier for the Preferred Alternative would be 1,215 meters (3,990 feet) in length, and would be 9 meters (30 feet) tall. The barrier would protect 353 homes and the park impacted under this alternative. The barrier would benefit an additional 379 homes and cost about $1.8 million, or under $3,000 per home. Noise Barrier 11A would meet VDOT s cost-effectiveness criterion. Noise Barrier 12A. This barrier would extend along the slip ramp from I-495 northbound to the Dulles Toll Road eastbound, and is designed to protect the Gates of McLean apartments located in the southeast quadrant of the Dulles Toll Road interchange. For the Preferred Alternative, the barrier would range in height from 5 to 12 meters (16 to 39 feet), and have a length of 719 meters (2360 feet). The barrier would protect 379 homes, benefit 47 homes, and cost about $1.0 million, or $2,400 per home. Barrier 12A meets VDOT s cost-effectiveness criterion. Noise Barrier 13A. This barrier was evaluated to protect single-family homes adjacent to Helga Place, Peter Place, and Spencer Road. Barrier 13A would range in height from 3 to 5 meters (10 to 16 feet), and would have a length of 1,007 meters (3,300 feet). The barrier would protect 14 homes and benefit another 5 homes. Barrier 13A would have a total cost of about $610,000, or $32,000 per home, which exceeds VDOT s cost-effectiveness criterion. A cost-effective barrier could not be designed for this community. Scott s Run Stream Valley Park was excluded from the cost-effectiveness calculation even though portions of the park would receive at least 5 db of noise reduction from the barrier. 4-50
253 Environmental Consequences Capital Beltway Study This barrier s ability to provide cost-effective benefit depends upon the noise-sensitivity of the park, which is evaluated on a case-by-case basis. Noise Barrier 13B. This barrier would extend from Old Dominion Drive to Road on the west side of I-495, and would protect homes in Timberly. For the Preferred Alternative, the barrier would range in height from 5 to 8 meters (16 to 26 feet), and would have a length of 1,143 meters (3,750 feet). The barrier would protect 24 homes impacted under this alternative, and benefit 13 additional homes. The barrier would cost about $1.3 million, or $33,800 per home. This barrier would not meet VDOT s cost-effectiveness criterion. A cost-effective barrier could not be designed for this residential community. Timberly Park was excluded from the cost-effectiveness calculation even though portions of the park would receive at least 5 db of noise reduction from the barrier. This barrier s ability to provide cost-effective benefit depends upon the noise-sensitivity of the park, which is evaluated on a case-by-case basis. Noise Barrier 13C. This barrier, which extends from Lewinsville Road to the project s western terminus along the Dulles Toll Road, would replace an existing barrier. The replacement barrier is designed to protect the homes in McLean Hamlet and Falstaff Road in the northwest quadrant of the Dulles/I-495 interchange. The new barrier would range in height from 4 to 9 meters (13 to 30 feet), and would have a length of 1,596 meters (5,240 feet). The total cost of the barrier is about $1.7 million. For the Preferred Alternative, the barrier would protect 33 homes and benefit another 43 homes, at a net cost of $14,600 per home. Noise Barrier 13C would meet VDOT s costeffectiveness criterion, not including the benefit provided to the park. Noise Barrier 13D. This barrier is designed to protect homes along Dulany Drive and Scott s Run Road. Most of the homes in this area are more than 150 meters (500 feet) away from the project roadway. Impact is expected to occur at 13 homes, but the barrier required to protect them would have a total cost of $1.2 million. At a cost of about $100,000 per home, this barrier does not meet VDOT s cost-effectiveness criterion. Noise Barrier 13E. This barrier is designed to protect the homes in the West Langley community and the McLean Presbyterian Church. Barrier 13E would have a length of 1,226 meters (4,020 feet) and range in height from 3 to 8 meters (10 to 26 feet). The total barrier cost is about $1.2 million. The barrier would protect 35 impacted homes and benefit another 8 homes at a cost of about $27,400 per home. This barrier meets VDOT s cost-effectiveness criterion for the Preferred Alternative, not including the protection provided for the church. Noise Barrier 14C. This barrier is designed to protect homes in Linganore. The barrier would have a height of 3 meters (10 feet) and a length of 488 meters (1,600 feet). The barrier would protect six homes, but at a cost of $42,000 per home, the barrier would not meet VDOT s cost effectiveness criterion. A cost-effective barrier could not be designed for this community. The Scott s Run Nature Preserve was not considered in the cost-effectiveness calculation, although the barrier would provide at least 5 db of noise reduction in certain portions of the park. The reasonableness of Noise Barrier 14C depends upon the noise-sensitivity of the nature preserve, which is evaluated on a case-by-case basis. 4-51
254 Capital Beltway Study Chapter 4 Infeasible Barriers. Noise barriers were found to be infeasible in the following locations for the Preferred Alternative: Apartments along the southeastern quadrant of the Route 7 interchange adjacent to Marshall High School would be impacted, but access issues prohibit the building of a barrier along Route 7 to protect these homes for any of the alternatives. Some single-family homes in the northeastern quadrant of the Route 7 interchange would be impacted, but access issues prohibit the building of a barrier along Route 7 to protect these homes for any of the alternatives. Some of the Yancey Drive townhouses adjacent to Lee Highway would be impacted, because not enough noise reduction could be achieved, even with a very tall barrier. 4.8 VISUAL QUALITY AND AESTHETICS The proposed project would change both the view of the road and the view from the road. The principal changes in the visual environment that would occur as a result of building the project include the following: Clearing of existing vegetation to make way for the road improvements and accompanying grading, drainage, and signing structures. In several sections this vegetation provides a buffer between the highway and residential and recreational areas. Changes to landforms as a result of grading for cut and fill slopes. Installation of sound barrier walls. Changes in size and elevation of interchange ramps and overpasses, making them more prominent. Changes in lighting that alter the visual prominence of the roadway corridor at night or cause greater "light leakage" into adjacent neighborhoods. The primary visual effect of the Preferred Alternative would result from clearing existing vegetation buffers between the Beltway and neighborhoods. Where possible, and where sufficient right-of-way remains, landscaping would be provided, or natural vegetation would be allowed to reestablish itself, to replace the vegetative screen. At locations where noise barriers would be installed, the barriers would screen adjacent neighborhoods from the roadway. The affected neighborhoods will be afforded opportunities to provide input on the design and appearance of the barriers. These barriers typically are constructed of concrete. However, there is a great deal of flexibility in providing surface treatments and landscaping to provide more aesthetically pleasing barriers. Such treatments also can be provided along the road side of the barriers to reduce the canyon effect of driving between barriers on both sides of the road. 4-52
255 Environmental Consequences Capital Beltway Study The new interchanges are likely to be slightly more prominent, and visible from greater distances, than the existing interchanges. This is unavoidable in order to provide safer and more efficient traffic movements at these locations. However, these interchanges would not necessarily be incompatible with the surrounding urbanized conditions. Adequate lighting will be essential to enhance safety in this congested corridor, particularly at interchange locations where traffic would be constantly entering and exiting. The details of such lighting would be developed during final design. It is not possible at this time to identify the specific locations and styles of lights to be used. However, the provision of such lighting would not be incompatible with the surrounding urbanized conditions and would be expected by drivers in this heavily traveled corridor. 4.9 GEOLOGY, SOILS, AND GROUNDWATER The Virginia Department of Mines, Minerals, and Energy has indicated that they do not have concerns regarding the presence of significant mineral resources or geological formations that may be affected by construction activities in the study area. Fairfax County soils maps indicate three soil types known to pose engineering constraints. As these soils (Orange and Iredell series and Marine Clay) are readily identifiable, VDOT will implement geotechnical analyses to avoid or manage any problems encountered with these soil types. As there are no prime or unique farmlands, the Farmland Protection Policy Act does not apply. Most of the project area is served by public water supply systems drawing from the Potomac River. Thus domestic drinking water resources used by most of the public would not be affected. However, a limited area north of I-66 may utilize water wells established in shallow aquifers within the project area. According to the Fairfax County Department of Health, homes in the vicinity of the Route 236 (Little River Turnpike) interchange and from the Route 193 (Georgetown Pike) interchange to the American Legion Bridge may have individual onsite sewage disposal systems (septic systems) and individual well water supplies. The potential for septic systems or individual wells to be displaced or otherwise impacted is routinely investigated as part of final design and construction. Therefore, the effects on local resources, if any, are expected to be minimal. The increased impervious surface resulting from the Preferred Alternative may result in localized lowering of groundwater levels, as a result of reduced infiltration. The amount of infiltration of precipitation into the ground may be marginally reduced as a result of new construction. In this case, the project is an expansion of an existing highway where such impacts, if any, would have already occurred with the original construction of the Beltway and little additional effect is expected SURFACE WATERS AND WETLANDS A summary of the effects to surface waters and wetlands predicted to result from the Preferred Alternative and No-Build Alternative is presented in Table The effects of the other alternatives considered in the preparation of the Draft EIS and Final EIS are also shown for comparison purposes. Detailed discussions for each of these other alternatives are found in Section 4.10 of the Draft EIS and the Natural Resources Technical Report. 4-53
256 Capital Beltway Study Chapter 4 Table 4-13 SUMMARY OF IMPACTS TO SURFACE WATERS AND WETLANDS Effect Number of Watersheds Affected Total Stream Impacts Total Wetland Impacts Final EIS Alternatives No-Build Revised Alternative Preferred Alternative 12-Lane HOT 10-Lane HOV Concurrent HOV Candidate Build Alternatives Draft EIS 1, 2 Express/ Local with HOV Barrier- Separated HOV ,452 4,235 8,262 8,031 8, Note: 1. Units used for impacts are feet for streams and acres for wetlands and wetlands compensation requirements. 2. Impacts for the Preferred Alternative were calculated based on the cut/fill limits rather than the right-of-way limits to provide a more accurate impact assessment. More conservative Right-of-way limits were used to calculate impacts for the Candidate Build Alternatives in the Draft EIS. For comparison purposes, 4.42 acres of wetland would be predicted to be impacted if the right-of-way limits were used for the Preferred Alternative Surface Waters Installation of new drainage structures, or extensions of existing structures would displace sections of streams, as tabulated in Table Such displacements would result in losses of aquatic habitat (see later discussion on wildlife and habitat). Temporary siltation of streams would occur during construction, but aggressive implementation and monitoring of erosion and sediment control plans would be included in the project to minimize such effects. Table 4-14 STREAM IMPACTS BY WATERSHED Preferred Alternative Watershed Primary Streams Impacted Feet Meters Accotink Creek Accotink Creek and tributaries 2, Cameron Run Holmes Run and tributaries 1, Pimmit Run Pimmit Run tributaries 0 0 Scotts Run Scotts Run and tributaries 1, Total Impacts 4,452 1,357 An increase in the amount of impervious pavement surfaces, increases in traffic volumes, and consequent increases in pollutants washed from the road surface into receiving streams could result in effects to water quality. Pollutants would include grease, oil, metals, nutrients, nitrogen, deicing salts, roadside vegetation management chemicals, and suspended solids. It is expected, however, that quality and quantity treatment of runoff associated with the Preferred Alternative will result in an overall improvement in quantity management and more effective pollutant removal capabilities beyond what is presently occurring in the local watershed. Because none of the receiving streams are elements of any public water supply, the potential for human health effects from roadway runoff is minimal. 4-54
257 Environmental Consequences Capital Beltway Study Existing water quality in most of the project area has been negatively affected by past discharges to receiving waters. Much of the proposed impacts to surface waters occur from currently untreated road runoff. With the required construction of both temporary and permanent stormwater controls in accordance with current best management practices (BMPs), it is likely that water quality would actually improve over existing conditions. This is primarily due to the fact that much of the Beltway infrastructure was in place prior to enactment of the Chesapeake Bay Preservation Act in Implementation of currently required quantitative and qualitative treatment techniques prescribed by the VDOT Drainage Manual and VDOT Erosion and Sedimentation Control and Stormwater Management (ESC & SWM) Manual will ensure that implementation of the Preferred Alternative will meet the requirements established by both state and Federal water pollution prevention regulations. Temporary and permanent stormwater management measures, include detention basins, vegetative controls, and other measures to reduce or detain discharge volumes and remove pollutants. These techniques are designed and analyzed for effectiveness during the development of final roadway design plans. Compensation for stream impacts may be provided as part of the permit conditions for authorizations issued by the U.S. Army Corps of Engineers (COE) and the DEQ. Because these agencies determine the compensation requirements for stream impacts on a case-bycase basis, the quantitative requirements for this project will be negotiated with them as part of the permit application process. This process may include input from other environmental advisory agencies. The requirements and special conditions of any required permits for work in and around surface waters would be incorporated into construction contract documents. The construction contractor would be required to comply with the conditions and pollution control measures specified in VDOT s Road and Bridge Specifications Wetlands Wetlands adjacent to the Beltway would be displaced by the Preferred Alternative. These displacements would total 3.03 acres (1.23 ha) or about 14 percent of the total wetlands present in the Beltway right-of-way. Several different types of wetlands would be involved, as tabulated in Table Palustrine forested wetlands comprise approximately 85 percent of the total area of wetlands along the Beltway, and accordingly would be the wetland type most heavily impacted by the Preferred Alternative. Impacts to forested wetlands would account for 75 percent of the total wetlands impacted. The majority of impacts occur in jurisdictional wetlands, which are regulated by both the COE and DEQ. Isolated wetlands that were determined to be non-jurisdictional by the COE are regulated by the DEQ. The areas of isolated wetlands impacted by the proposed Beltway improvements are calculated separately and included in Table The majority of direct wetland impacts would occur at only two locations. Both of these wetland areas are PFO1 systems that occupy 1.9 acres and 4.0 acres of land adjacent to Beltway, respectively. The larger impact area is located along the Inner Loop, just north of its intersection with Shreve Road and Lee Highway in the headwaters of Holmes Run, in the Cameron Run watershed. The smaller impact area is located along the Inner Loop, just north of the Lewinsville Road overpass, lying parallel and contiguous to Scotts Run. Approximately 2.18 acres of these wetlands would be impacted under the Preferred Alternative. Together, the impacts to these two wetlands account for 72 percent of the total wetland impacts. 4-55
258 Capital Beltway Study Chapter 4 Table 4-15 SUMMARY OF WETLAND IMPACTS BY TYPE Total Existing Area 2 Area Impacted Preferred Alternative Cowardin Classification 1 Acres Hectares Acres Hectares PEM1A PEM1C PFO1A PFO1C PSS1A PSS1C Total Jurisdictional Wetlands Isolated PEM1C Isolated PFO1A Isolated PFO1C Total Isolated (Non-Jurisdictional) Wetlands Total Wetlands The Cowardin classifications are: palustrine emergent (PEM) systems with persistent vegetation (1); palustrine forested (PFO) and palustrine scrub-shrub (PSS) systems with broad-leaved deciduous vegetation (1); and temporary (A) or seasonal (C) flooding regimes. 2 Represents all wetlands within 165 feet (50 meters) of the Beltway. The effect of wetland losses varies not only among wetland type, but also among watersheds. Table 4-16 summarizes the impacts on wetlands within particular watersheds. The full impact to wetlands and associated stream systems and watersheds cannot be assessed merely in terms of the area of wetlands displaced by new construction, because all wetlands are not equal in their quality or the ecological and social benefits they provide. Table 4-17 summarizes the relative losses of wetland functions or values by comparing the sum area of wetlands within the existing Beltway right-of-way that possess certain functions or values to the sum area of impacts to wetlands possessing those functions or values. Most wetlands provide more than one function or value, so the areas presented in this table sum to more than the total area of wetlands present along the Beltway. Overall, approximately 71 percent of the total area occupied by wetlands provides a sediment and/or toxicant retention function, and 16.6 percent of the wetlands that provide that function would be displaced. In comparison, less than 3 percent of the area occupied by wetlands provides sediment stabilization, and 15.5 percent of those wetlands would be displaced by the Preferred Alternative. Table 4-16 SUMMARY OF WETLAND IMPACTS BY WATERSHED Existing Wetland Area 1 Wetland Area Impacted Preferred Alternative WATERSHED Acres Hectares Acres Hectares Percent Accotink Creek Cameron Run Dead Run Pimmit Run Scotts Run Total Impacts Represents all wetlands within 165 feet (50 meters) of the Beltway. 4-56
259 Environmental Consequences Capital Beltway Study Table 4-17 WETLAND FUNCTIONS AND VALUES BY AREA AND PERCENT IMPACTED Principal Function or Value Area Possessing Function or Value (acres) Area Possessing Function or Value Impacted (acres) 1 Sediment/Toxicant Retention Rank by Area Percent Impacted Preferred Alternative 2 Floodflow Alteration Nutrient Reduction Wildlife Habitat Production Export Groundwater Recharge/Discharge Sediment Stabilization Both of the two largest wetland impact areas provide sediment/toxicant retention and floodflow alteration capacity. The impacts to these two wetland areas account for the loss of approximately 8 percent of the existing wetland capacity for both floodflow alteration and sediment/toxicant retention. The large wetland area in Holmes Run has a surface hydrology that is largely supported by untreated road runoff and aided by entrapment within higher surrounding topography. The area associated with Scotts Run also provides relatively higher quality wildlife habitat for an area adjacent to the existing lanes of the Beltway. However, the impacts to this wetland under the Preferred Alternative would be unavoidable. While the floodflow alteration and sediment/toxicant retention functions could be replaced by a stormwater management facility, quality wildlife habitat similar to that lost could not likely be replaced at that location. In addition to implementing stormwater management facilities, compensatory mitigation for unavoidable wetland impacts will be provided as needed. Minimization and Mitigation of Impacts. The potential impacts resulting from the Preferred Alternative have been reduced during the planning and design process. Table 4-18 provides a comparison of early impact calculations and current calculations. Because previous estimates of impacts were calculated by wetland area and not by Cowardin classification, this comparison is based on overall wetland impacts. Calculations include estimates for jurisdictional wetland impacts as well as isolated wetland impacts. Table 4-18 WETLAND IMPACT REDUCTIONS DURING ALTERNATIVES DEVELOPMENT Reduction in Impacts from Area Impacted First Estimate Alternative Acres Hectares Acres Hectares First estimate (1997) N/A N/A Second estimate (1999) Concurrent HOV Express/Local with HOV Barrier Separated HOV Revised 10-Lane HOV Preferred Alternative
260 Capital Beltway Study Chapter 4 Compensatory mitigation will be required for unavoidable wetland impacts. Table 4-19 summarizes the estimated compensatory mitigation acreages for each wetland type, including jurisdictional wetlands and isolated wetlands. Mitigation will be required by the COE and DEQ for impacts to jurisdictional wetlands and will be required for impacts to isolated wetlands by the DEQ. Compensation mitigation may be required for stream impacts, depending on the extent and nature of impacts, unavoidable stream relocations will incorporate natural stream designs that replicate stream length, meanders, and riparian features. The clearing of stream banks and riparian zones will be minimized to the extent practicable. Final wetland and stream compensation requirements would be developed following the formal Interagency Coordination Meeting (IACM) process. The location of any proposed wetland or stream compensation would be contingent upon the approval of the permitting agencies, location of the impacts, and availability of adequate compensation sites that would replace lost functions and values. Due to the limited availability of wetland and stream compensation sites near the Beltway, it is possible that a mitigation bank (or banks) would be utilized. There are several potential mitigation banks which service the watersheds within the project area, including: Bull Run Wetland Mitigation Bank, Cedar Run Wetlands Bank, Foggy Bottom Wetland Farm, and Licking Run Mitigation Bank in Prince William County; Northern Virginia Stream Restoration Bank in Fairfax County; and, Potomac River Wetland Mitigation Bank, Northern Virginia Regional Environmental Bank, and Great Oaks Mitigation Bank in Fauquier County. Table 4-19 SUMMARY OF IMPACTS AND COMPENSATION REQUIREMENTS FOR WETLANDS Cowardin Classification Jurisdictional Wetlands Compensation Area Impacted Compensation Required Ratio Acres Hectares Acres Hectares PEM 1.5: PFO 2: PSS 1.5: Total Jurisdictional Impacts/ Compensation Requirements Isolated Wetlands Total Isolated Wetland Impacts/ Compensation Requirements : Total Impacts/Compensation Note: Totals reported expressly exclude non-jurisdictional features that have characteristics of wetlands, but were determined not to be waters of the United States subject to Section 404 permitting by the Corps of Engineers. 4-58
261 Environmental Consequences Capital Beltway Study 4.11 FLOODPLAINS Potential impacts to the 100-year floodplain were assessed in accordance with Executive Order Floodplain Management and FHWA's Program Manual , Location and Hydraulic Design for Encroachments on Floodplains. Preliminary project designs sought to minimize and avoid impacts to floodplains by including floodplains as evaluation criteria in the early alternatives development process. To evaluate the initial concepts, digital constraints mapping was prepared for the project area that included the approximate 100-year floodplain boundaries. The boundaries were obtained from the National Flood Insurance Maps (FIRM) prepared by the Federal Emergency Management Agency (FEMA). Determining floodplain impacts involved superimposing the alternative designs onto the 100-year floodplain digital mapping. There are four 100-year floodplains within the 14-mile project area that are spanned or abutted by the existing Capital Beltway. These are associated with Flag Run, Accotink Creek, Holmes Run and Scotts Run (see Figure 3-13). The Preferred Alternatives would further encroach upon the Scotts Run floodplain as detailed in Table The extent of encroachment was determined by calculating the area between the existing edge of pavement and the new cut and fill line associated with the Preferred Alternative This method recognizes potential retaining walls and other potentially impervious fill areas and thus provides a slightly higher and more conservative estimate of floodplain encroachment than would just the increase in new impervious service associated with pavement alone. The Scotts Run floodplain runs adjacent to the eastern edge of Beltway for over a mile. Most of this longitudinal encroachment is attributed to the fill outside the actual pavement area. These longitudinal encroachments cannot be avoided by bridging because the majority of the encroachments occur where the floodplains run parallel to the existing roadway and the encroachment is the result of extending existing roadbed fill. Table 4-20 FLOODPLAIN ENCROACHMENTS Area of Encroachment (acres) Floodplain Longitudinal Latitudinal Total Flag Run Accotink Creek Holmes Run Scotts Run Total Floodplain Encroachment Sections 107 and 303 of VDOT's specifications require the use of stormwater management practices to address concerns such as post-development stormflows and downstream channel capacity. These standards require that stormwater management ponds be designed to reduce stormwater flows to pre-construction conditions for up to a 10-year storm. VDOT would adhere to its specifications to prevent an increase in flooding risks associated 4-59
262 Capital Beltway Study Chapter 4 with the proposed improvements. It is expected that backwater elevations and velocity increases at the floodplain encroachments would be nonexistent or minimal. During final design, a detailed hydraulic survey and study would evaluate the effect of the proposed improvements on stormwater discharge. This evaluation would help ensure that no substantial increase in downstream flooding would occur. In addition, to the extent practicable, VDOT s final design will consider opportunities for retrofitting existing stormwater management facilities within the right-of-way. For these reasons, the project would have negligible impacts to natural and beneficial floodplain values WILDLIFE AND HABITATS Aquatic Habitats Displacements of sections of stream bottom by the Preferred Alternative would result in minor losses of benthic (bottom-dwelling) organisms. The water quality of streams that receive runoff from the Beltway and surrounding urban and suburban areas is already impaired, and the increase in pavement and replacement of natural stream channels with culverts or other structures has the potential to further degrade water quality and associated habitats. However, with proper stormwater controls, further degradation can be avoided or minimized. Given the lack of existing stormwater controls, it is possible that the overall water quality of receiving streams could actually improve following the installation of stormwater management facilities as part of the project. Fish migrate to search for food and to spawn. Of particular concern would be anadromous species (saltwater species that migrate to fresh water to breed). Anadromous species include striped bass, American shad, hickory shad, alewife, and blueback herring. Highway crossings can obstruct movements of anadromous and other fishes by altering stream width, depth, velocity, and gradient, especially on smaller tributaries where culverts are used instead of bridging. Several streams crossed by the project, particularly Accotink Creek, may still support anadromous fishes. Culverts will be designed such that low-flow channels can be maintained to minimize the possibilities for obstructing fish passage Terrestrial Habitats Because the project follows an existing major highway corridor carrying large volumes of traffic within an urbanized area, impacts to terrestrial habitat would be limited to displacements of small amounts of remaining disjunct vegetated areas. Such areas harbor transient or permanent populations of small animals adapted to life in fragmented urbanized environments close to human populations. The existing Beltway already constitutes a barrier to wildlife movements and a constant threat of mortality to wildlife wandering onto the highway. The proposed widening would not substantially change that condition Invasive Species In accordance with Executive Order 13112, Invasive Species, construction of the proposed Beltway improvements will minimize the potential for the establishment of invasive terrestrial or aquatic animal or plant species by following the VDOT Road and Bridge Specifications Manual. Activities related to establishing and maintaining the newly constructed right-of-way follow guidelines set forth in the manual under the following 4-60
263 Environmental Consequences Capital Beltway Study sections: Clearing and Grubbing (Section 301), Drainage Structures (Section 302), Earthwork (Section 303), Selective Tree Removal, Trimming, and Cleanup (Section 601), Topsoil (Section 602), Seeding (Section 603), Sodding (Section 604), Planting (Section 605), Soil Retention Covering (606), Herbicide Spraying (Section 607), and Mowing (Section 608). Contract bid packages must include special provisions for managing invasive species that relate to those sections of the manual listed above. While the right-of-way is vulnerable to the colonization of invasive plant species from adjacent properties, implementation of the stated construction specifications and special provisions will reduce the potential for the establishment and proliferation of invasive species in the right-of-way THREATENED AND ENDANGERED SPECIES As described in Chapter 3, consultations with state and federal agencies with responsibilities for threatened and endangered species, along with field inventories of natural resources in the study area, revealed no occurrences of protected species. Therefore, the project will have no effects on threatened or endangered species CULTURAL RESOURCES Pursuant to Section 106 of the National Historic Preservation Act, the effects of the project alternatives on historic properties have been considered. As discussed in Chapter 3, a comprehensive historic property identification survey found two historic districts in the project s Area of Potential Effect (APE): Holmes Run Acres and the W&OD Railroad. A summary of the effects to Cultural Resources from the No-Build and Preferred Alternative is provided in Table The effects of the other alternatives considered in the preparation of the Draft EIS and Final EIS are also shown for comparison purposes Holmes Run Acres Historic District The Holmes Run Acres Historic District (VDHR # ), located in the northeast corner of the Gallows Road interchange, is a residential subdivision that originally contained 344 homes. Following publication of the Draft EIS, the interchange concept for Gallows Road was redesigned to eliminate the impacts to the historic district. The subdivision currently is screened from the Beltway by an existing noise barrier. That barrier will be replaced as part of the project. The incremental changes to the visual character in a portion of the historic would not constitute an adverse effect on the district. Table 4-21 SUMMARY OF EFFECTS TO CULTURAL RESOURCES Final EIS Alternatives Revised Alternative Candidate Build Alternatives Draft EIS Resource No-Build Preferred Alternative 12-Lane HOT 10-Lane HOV Concurrent HOV Express/ Local with HOV Barrier- Separated HOV Holmes Run Acres No No No Yes Yes Yes W&OD Railroad Regional Park No No No No No No 4-61
264 Capital Beltway Study Chapter W&OD Railroad Historic District The W&OD Railroad Historic District (VDHR # ) is a 45-mile linear district encompassing approximately 545 acres. A regional trail linking a number of parks and residential areas now occupies the former railroad right-of-way. The modern bridges carrying the trail over the Beltway and I-66 are non-contributing elements of the district. These bridges will be replaced as part of the proposed project. Because the project would not alter the characteristics that qualify the district for inclusion on the NRHP, there would be no effect on the district CONSTRUCTION IMPACTS Construction impacts are short-term environmental effects resulting from the process of building the project. Construction impacts can involve temporary changes in land use and community access, water quality, air quality, and noise levels Land Use and Access Access to businesses could be temporarily disrupted on interchanges and cross roads due to temporary detours that are necessary to allow ample space for staging and construction. These temporary disruptions are unavoidable and will be minimized to the extent possible by carefully planning maintenance of traffic provisions and incorporating them into the design plans Wildlife and Habitat Temporary impacts to wildlife are related to the displacement of vegetated cover within the construction footprint of the Preferred Alternative. The mechanical removal of cover will cause animal migration away from the disturbance, resulting in a temporary decrease in habitat usage by edge-dwelling species. Construction activities may also cause direct mortality of wildlife unable to escape construction equipment. Opportunistic plant species are likely to have a greater competitive advantage during early construction activity. Therefore, temporary impacts could also be associated with slope stabilization effects that could temporarily reduce wildlife usage and foraging behaviors in disturbed areas Water Quality and Wetlands VDOT will avoid stream relocations and implement perpendicular stream crossings as much as practicable to minimize construction impacts. Compensation will be required for unavoidable impacts as described in Sections 4.10 and Short-term water quality impacts may result from erosion following ground disturbance and earthmoving operations. After entering streams, the eroded material may increase turbidity levels and sedimentation downstream. Excessive quantities of suspended solids can harm fish and other aquatic life. Deposition of suspended solids may alter the substrate of streambeds, interfere with plant production and fish spawning, smother benthic fauna, and reduce substrate utilization. Eroded material may also contain organic matter and nutrients, such as nitrogen and phosphorus. High inputs of organic matter may result in an increase in biochemical oxygen demand, decreasing dissolved oxygen concentrations. Additionally, inputs of nutrients can increase both turbidity and eutrophication by increasing algae production. Erosion and sediment control measures will be implemented to minimize water quality impacts from increased levels of sedimentation and turbidity. Control measures may 4-62
265 Environmental Consequences Capital Beltway Study include berms, dikes, sediment basins, fiber mats, straw silt barriers, netting, mulch, temporary and permanent seeding, and other methods. Construction impacts to in-stream aquatic habitats may be minimized to the extent practicable by avoiding stream relocations and by crossing streams at right angles. To the extent possible, construction equipment will be restricted from fording and otherwise disrupting in-stream habitats. The construction contractor would be required to comply with the conditions and pollution control measures specified in VDOT s Road and Bridge Specifications Air Quality Construction impacts on air quality include exhaust emissions from construction equipment and dust generated by construction activities on disturbed earth. These impacts will be minimized by enforcement of construction specifications and adherence to VDEQ regulations. The VDOT s Road and Bridge Specifications regulate construction procedures on all projects. The Specifications require the contractor to comply with all applicable local, state, and federal laws, ordinances, regulations, orders, and decrees. This includes compliance with emissions standards for construction equipment and adherence to regulations for burning of materials from clearing and grubbing, demolition, or other operations. The Specifications were reviewed by the DEQ and were found to conform to the SIP. The Specifications prohibit burning of tires, asphalt materials, used crankcase oil, or similar materials that produce dense smoke. Provisions will be included in the contract for preventing dust from becoming airborne Noise Noise receptors that would be sensitive to highway traffic noise would also be sensitive to noise from construction equipment while the project is being built. To minimize the effects of construction noise, the VDOT s Road and Bridge Specifications contain noise control provisions, which include the following: Equipment shall in no way be altered so as to result in noise levels which are greater than those produced by the original equipment. The contractor s operations shall be performed such that the exterior noise levels measured at a noise-sensitive activity shall not exceed 80 dba during periods of such activity. VDOT reserves the right to prohibit or restrict to certain portions of the project any work that produces objectionable noise during normal sleeping hours, 10 p.m. to 6 a.m., unless other hours are established by local ordinance, in which case the local ordinance shall govern SECONDARY AND CUMULATIVE EFFECTS The Council of Environmental Quality s (CEQ s) regulations implementing the NEPA divide environmental impacts into three categories: direct impacts, indirect or secondary impacts, and cumulative impacts. The regulations require that all three types of impacts be included in NEPA documents. Direct impacts are discussed throughout this environmental impact statement. 4-63
266 Capital Beltway Study Chapter 4 CEQ regulations require consideration of indirect (or secondary impacts), which are caused by the proposed action, but which are later in time or further in distance than the direct impacts discussed elsewhere in this document (40 CFR ). Indirect effects may include growth-inducing effects and other effects related to induced changes in the pattern of land use, population density or growth rate, and related effects on air, water, natural systems, or the human environment. CEQ regulations also require that federal agencies preparing an environmental impact statement consider the cumulative effects of a proposed action and other actions. CEQ defines cumulative effects as an impact on the environment which results from the incremental impact of the action when added to other past, present, and reasonably foreseeable future actions. CEQ s publication, Considering Cumulative Effects Under the National Environmental Policy Act (January 1997), provides a framework for addressing cumulative effects. This handbook outlines general principles about how to evaluate cumulative effects. It does not represent new legal requirements nor is it legally binding; rather, it clarifies a complex area of the NEPA process. This analysis in this section focuses on three primary areas of concern: Determining the secondary effects associated with construction of the Preferred Alternative and the induced development (also referred to in this Final EIS as secondary development) that would be associated with the project; Describing the potential cumulative effects that would occur due to construction of the Preferred Alternative in addition to past, present and future reasonably foreseeable projects within the same study area; and Suggesting mitigation measures that could reduce the potential for secondary effects caused by the Preferred Alternative Methodology for Secondary and Cumulative Effect Analysis The process used to evaluate secondary and cumulative effects is based on CEQ regulations and involves a multi-step process to identify and evaluate these effects. The first step in the process is the identification of sensitive resources to be analyzed for effects. These resources would include: those that are directly affected by the Preferred Alternative, those affected by any secondary development that is associated with the Preferred Alternative, and those resources that are particularly susceptible to cumulative effects (e.g. wetlands can experience multiple individual impacts from many projects over time, that when summed result in cumulative effects). Sensitive resources were identified using the environmental information prepared for the various sections of this Final EIS and agency and public comments. The next step was determining the geographic and temporal boundaries to be analyzed. The geographic boundary for cumulative effects was determined by using a series of overlay mapping. Overlays of the areas of traffic influence, census tracts, and subwatersheds were created. As shown in Figure 1-3, the majority of trips on most segments of the Beltway originate within 2 miles to the east or west. Census tracts that border the project area are shown in Figure 3-5 and cover an area of roughly 50 square 4-64
267 Environmental Consequences Capital Beltway Study miles. As discussed in Section , the project area includes all or portions of four subwatersheds: Accotink Creek, Cameron Run, Pimmit Run, and Scotts Run. A temporal boundary was also determined for the project. According to CEQ guidelines, the design year is a good proxy to use for the evaluation of future conditions and has been selected for this project, specifically year The use of 2020 also allows the analysis to be consistent with other sections of this Final EIS, as they also use a future timeframe of The next step in the process was to evaluate how the Preferred Alternative would affect growth patterns within the study area. This is referred to as the secondary development analysis. The secondary development analysis assesses not only the potential for new growth associated with the project, but is also defines the impacts on sensitive resources due to that growth. According to CEQ guidance, this secondary development has to be directly attributable to the Preferred Alternative. In other words, the growth that would only occur due to the construction of the Preferred Alternative. General growth patterns are assessed in a more general fashion in the cumulative effects analysis which is designed to look at how all past, present, and future reasonably foreseeable projects, including the Preferred Alternative, would affect the sensitive resources previously identified. In order to determine cumulative effects, other reasonably foreseeable projects within the study area, regardless of type or sponsor, have to be included as part of the evaluation. These projects have been assessed in conjunction with the Preferred Alternative, even though some of the projects are currently just studies and are not considered to be reasonably foreseeable at this time since no preferred alternative has been selected and there is little environmental impact information available to be used in the assessment of cumulative effects. The final step in the process is to suggest measures that might be appropriate for mitigating secondary and cumulative effects Resource Identification Not all impacts tend to accumulate that is, similar impacts from more than one project do not tend to add together and create a greater impact. Certain resources when they experience independent impacts may have minimal change, but when impacts are summed cumulatively, they may experience substantial effects over time. These impacts may be the result of secondary effects such as induced development or they may be the result of other past, present, and future actions. For example, wetlands within the geographic boundary analyzed may experience a loss in acreage due to several individual actions that might include losses due to the Preferred Alternative, future development, or any of the other projects identified in Table Individual impacts may be negligible, but when the impacts are accumulated there may be a cumulative impact to the function or value of the watershed. An example of resources that do not accumulate impacts would be hazardous materials or displacements; these resources would experience only one direct, primary impact. 4-65
268 Capital Beltway Study Chapter 4 Table 4-22 OTHER REASONABLY FORESEEABLE PROJECTS INCLUDED IN THE CUMULATIVE EFFECTS ANALYSIS Project Description Springfield Interchange Interchange improvement project that includes construction of new lanes and additional access patterns to the Capital Beltway. Braddock Road Adding two HOV lanes between Burke Lake Road and the Beltway. Route 236 Roadway widening from Fairfax City line to Alexandria city line (widen to 6 lanes).. Route 50 Roadway widening between Route 7 and Nutley Street (widen to 6 lanes). Route 29 Roadway widening between Cedar Lane and the Beltway (widen to 6 lanes) Route 7 Route 7 within Tysons Corner is planned for expansion from six to eight lanes by Route 7 is also planned for expansion from four to six lanes between Reston Parkway and the Dulles Toll Road, and Rolling Holly Drive and Reston Parkway. Route 123 Roadway widening from Route 7 to I-495 (from six to eight lanes; estimated completion by 2010). Dulles Airport Access Road Widening From Dulles Airport to Route 123; widen from four to six lanes; estimated completion 2010; not in TIP. Dulles Corridor Rapid Transit Project An extension of Metrorail from the Orange Line in the vicinity of West Falls Church through Tysons Corner to Reston (Wiehle Avenue) in Phase 1 (by 2011) and then through Reston, Herndon, Dulles Airport to Loudoun County in Phase 2. Capital Beltway Rail Feasibility Study Feasibility study that identified preliminary transit modes that are feasible within the study area. The effects that do accumulate and that are addressed in this document include the following: Neighborhoods, Community Services, and Cohesion Changes (due to proximity impacts, changes in access, or multiple displacements within the same neighborhood) Visual and Aesthetic Character Cultural Resources Parks and Recreation Facilities Geologic Resources Water Resources Aquatic Biota and Habitats Terrestrial Biota and Habitats Rare, Threatened and Endangered Species Traffic If the proposed project does not result in an impact to a certain resource, then it will not contribute to cumulative impacts to that resource. The Preferred Alternative for the Capital Beltway improvements will not result in impacts to environmental justice populations, air quality, or energy as discussed in the previous sections of this chapter, even though these resources are sensitive to cumulative effects. Therefore, they are not included in this evaluation. 4-66
269 Environmental Consequences Capital Beltway Study Secondary Development Effects The ability of a transportation facility to alter or to affect land use patterns is dependent on a number of factors, including the type of access it provides to land available for development, the development potential of the land, and the regulations in place that govern land use in proximity to the transportation facility. The transportation facility, in and of itself, does not create induced or secondary development. However, a transportation facility can encourage development by providing access to new growth locations as allowed by local jurisdictions. When a direct relationship can be proven to exist between a transportation facility and new growth that would occur due to the existence of that facility this is referred to as secondary development that is associated with the transportation project. The effects of this new growth on sensitive resources are assessed in the secondary development effects analysis. Secondary development effects typically are perceived to include effects on human and natural systems resulting from changes in land use patterns or growth rate accelerations that are induced by the project. Quantifying these effects is often difficult due to the inability to foresee relationships between the project and future development, as well as the interplay of factors besides transportation (e.g., overall economic conditions, availability of other infrastructure such as water and sewer systems, growth policies and plans of local governments, and inclinations of individual landowners). However, CEQ does provide guidance on the level of detail needed to assess potential impacts primarily by assessing the potential level of change and location of that change that is directly induced by the project. Before exploring the secondary development effects of the project, it may be useful to first look at how highway projects can affect development decisions by landowners. Transportation has two basic functions: access and mobility. Access enables landowners to develop or otherwise extract economic value from their properties. Direct access off of a highway enables customers to enter properties to transact business, and enables the landowner to export his products to markets beyond the bounds of the property. Mobility enables commerce and social interaction by providing for travel; the better the mobility, the greater the geographic range of interaction and the reach of commerce. Together, access and mobility provide the linkage for human interaction, from neighborhood to global scales. If a new highway is built into undeveloped lands, that highway provides new access that may, or may not, influence the landowner to build something on the property or extract natural resources from it. The provision of the new access, in and of itself, does not cause the development; rather, it facilitates the development when there are other factors in place that lead the landowner to a development decision (e.g., a growing population creates demand for additional housing; a market exists for the natural resources on the property; a robust and growing economy provides fertile conditions for new businesses; and other essential infrastructure and services, such as schools, water, sewer, and power, are available at reasonable cost). Enhancements to mobility reduce travel time, thereby reducing the cost of goods transported and increasing the efficiency of commercial and social interaction. Producers can ship their goods greater distances for less cost, workers can commute greater distances in less time, and shoppers can travel farther for greater purchasing choices and opportunities. Again, however, the enhanced mobility, in and of itself, does not ensure expanded economic or social activity. 4-67
270 Capital Beltway Study Chapter 4 Rather, it facilitates it when there are other factors in place enabling people to take advantage of it (e.g., a robust economy that supports a large and diverse labor pool, aggressive economic development policies aimed at recruiting new business and industry, and a population with time and money to take advantage of shopping and entertainment opportunities). The Preferred Alternative is not projected to result in secondary effects due to induced development. No new access to undeveloped land is provided by the Preferred Alternative. According to CEQ guidelines, the potential for induced development is greatest for new transportation corridors on new location. The Preferred Alternative is located within an existing transportation corridor and no new points of access are proposed as part of any of the alternatives. From a regional perspective, the Preferred Alternative will enhance mobility. In order for secondary development effects to be associated with the Preferred Alternative, it must be shown that the mobility enhancements from the Preferred Alternative is directly linked in some manner to future development patterns in the region. In other words, it must be shown that without the improvements, development projects or the induced development in the region would not occur. No such causal relationship can be shown to exist, since the Preferred Alternative is located within an almost completely built-out urban environment. Since growth has long since moved beyond the area surrounding the Capital Beltway along radial routes into outer counties and most of the new growth projected for the region is to occur well outside of the Beltway, it is difficult to attach any regional induced development to improvements that are designed to improve traffic flow on the Beltway. The other component of induced development focuses on whether the improvements will change land use patterns within the local environment. No such changes are projected. In Table 3-2 it has been shown that the area surrounding the Capital Beltway is projected to be completely developed by Coordination with Fairfax County indicated that the only growth projected to occur within proximity to the Beltway is in Tysons Corner and Merrifield. Development in Merrifield is projected to be complete as part of the no-build condition without any relationship to the proposed improvements. Tysons Corner may experience an increase in density, but these increases can not be directly attributed to the proposed Beltway improvements, and are more dependent on the construction of rapid rail through the core of Tysons. In addition, no development projects have been identified that are in any way dependent on the Preferred Alternative. Thus, no causal relationship exists between the alternatives and any secondary, or induced development Cumulative Effects As stated previously, cumulative effects are those incremental consequences of a proposed action that, when added the consequences of past and reasonably foreseeable actions, affect the same resources. Other actions in the project area potentially impacted by cumulative effects include other highway projects and residential, commercial, and institutional development. Cumulative effects occur when there is an additive relationship between the various projects in relation to the resources being analyzed. In the following, section the other major actions that have been identified as being located within the geographic resource boundary are discussed in relation to the Preferred Alternative for the Capital Beltway. 4-68
271 Environmental Consequences Capital Beltway Study Other Actions. Described below are other projects that have occurred, are ongoing, or are reasonably foreseeable within the geographic and temporal boundaries established above. Springfield Interchange Improvement Project. The Springfield Interchange Improvement Project located in Springfield, Virginia, is a multi-year program to improve traffic flow at the heavily congested interchange of I-95/I-395/I-495. The interchange improvements include new HOV and general-purpose lane connections to the Capital Beltway. Construction is anticipated to be completed in FHWA determined that the project would not significantly impact the human environment and that an EIS was not required. This finding was based on the Final Environmental Assessment/4(f) Evaluation dated September 19, 1994, and a Reevaluation dated October 27, However, the selected alternative has a few direct impacts. There are 0.12 acres (0.05 hectares) of wetlands and 0.21 acres (0.09 hectares) of floodplains within the right-of-way. Of the Resource Protection Areas, 1.54 acres (0.62 hectares) will be impacted. These natural resource impacts occur within the Cameron Run subwatershed, which would also be impacted by the Preferred Alternative as described in Sections and Three parks were affected, with a total of 2.33 acres (0.94 hectares) impacted, none of which will be impacted by the Preferred Alternative for the Capital Beltway improvements. No archaeological or historic sites were impacted. Roadway Widenings (Routes 620, 236, 50, 29, 7, and 123). Six of the roadways crossing the Beltway are planned to be widened with or without the Capital Beltway improvements (see Table 4-22). In each case the Preferred Alternative does not have any direct influence on the proposed projects. The widenings will occur within the existing rights-of-way and minimal environmental impacts are projected to occur. Dulles Airport Access Road Widening. The widening of the Dulles Airport Access Road does intersect with the Capital Beltway. However, there are no incremental changes that would result due to the Preferred Alternative. The widening will occur within existing rights-of-way and minimal environmental impacts are projected to occur. Dulles Corridor Rapid Transit Project. The Virginia Department of Rail and Public Transportation (DRPT), in cooperation with the Washington Metropolitan Area Transit Authority (WMATA), Fairfax and Loudoun counties, and the Metropolitan Washington Airports Authority (MWAA), is planning to construct a 23.1-mile transit system in Fairfax and Loudoun counties, Virginia. A (Final EIS) for the project was completed in December A record of decision was signed by the Federal Transit Administration in March The project will extend the existing Metrorail system from the Orange Line (between the East and West Falls Church stations) in Fairfax County through Tysons Corner to Washington Dulles International Airport and beyond the airport to Route 772 in Loudoun County. Most of the extension will be constructed in the median of the Dulles International Airport Access Highway and Dulles Connector Road, but the alignment would also directly serve Tysons Corner and Dulles Airport. The extension will include 11 new Metrorail stations, a new rail yard on Dulles Airport property, and improvements to an existing rail yard at West Falls Church. This alignment was selected because it offers the highest ridership potential with the fewest impacts on residential areas and the natural environment. 4-69
272 Capital Beltway Study Chapter 4 Because of federal funding limitations and the timing of local funding availability, DRPT intends to construct the Locally Preferred Alternative (LPA) in two major phases. Phase 1 of the Project will complete the first 11.6 miles of the planned extension and include five new stations (Tysons East, Tysons Central 123, Tysons Central 7, Tysons West, and Wiehle Avenue). Metrorail service to Wiehle Avenue is scheduled to begin in DRPT began Preliminary Engineering on Phase 1 of the project in October Phase 2 of the Project will complete the remainder of the LPA from Wiehle Avenue to Route 772 in Loudoun County. Due to the nature of the planned transit improvements (they run primarily in medians and along developed arterials and they are primarily located outside the study area for the Capital Beltway Study which means that they will not cumulatively impact the same resources that will potentially be impacted by the Preferred Alternative), direct environmental impacts will be minimal. There is some interaction between neighborhoods within the Dulles Corridor project that are in close proximity to the Beltway, but no displacements or relocations are projected to occur that could accumulate over time. However, as mentioned previously, the Fairfax County Comprehensive Plan specifically allows for increased densities in Tysons Corner for parcels in close proximity of a new rail station. Capital Beltway Corridor Rail Feasibility Study. The Capital Beltway Corridor Rail Feasibility Study was initiated by the General Assembly to develop and identify the most feasible means of running rapid transit between Springfield and Tysons Corner and beyond into Maryland. A total of four transit technologies (heavy rail, light rail, monorail, and bus rapid transit) and three alignments were considered in the study, with three technology/alignment combinations being recommended for further study. Two of the alignments were recommended for further study. The Blue Corridor would parallel the Beltway and the Red Corridor would run from Springfield to Annandale along Backlick and Annandale roads, and then through Merrifield to Tysons Corner along Gallows Road, terminating at the Potomac River. As a feasibility study, the purpose of this project was to identify appropriate technologies and alignments, and to consider only fatal flaw impacts. Because the rail study only represents a feasibility study of potential rail plans in the corridor and no significant commitment has been made to implement the recommendations either in terms of a location study, proposed changes to the CLRP for the region or funding, the proposed rail plans are not considered a reasonably foreseeable future project and as such, not included as part of this cumulative impact analysis. Maryland Capital Beltway Study. The Maryland State Highway Administration is currently conducting a study which is evaluating improvements to the Maryland portion of the Capital Beltway. Cumulative impacts to the Potomac River may occur, as both projects terminate at the river and will impact the river directly or indirectly through impacts to streams draining into the river. The timing of the recommendations from the Maryland Capital Beltway Study and a demonstrated commitment whether the Maryland Capital Beltway Study is considered a reasonably foreseeable future project to be considered in this cumulative impact analysis. Private Development. Given the relatively built-out nature of development along the Capital Beltway, there are only a limited of number areas that have been identified as potential development sites. The biggest development and redevelopment opportunities in the corridor exist in the Merrifield and Tysons Corner activity centers. Although the Merrifield area is 4-70
273 Environmental Consequences Capital Beltway Study largely developed, there are substantial opportunities and plans for redevelopment. Several buildings are currently under construction, and recently adopted comprehensive plan amendments provide opportunities for additional redevelopment. In general, the new plans seek to take advantage of proximity to the Dunn Loring Metrorail Station changing the area from a largely industrial-use area into a mixed-use district with housing, retail, and commercial uses. Because any new development will be in the form of redevelopment and there are no sensitive resources in the area, new development is not expected to contribute to cumulative effects for this project. In Tysons Corner, there are both new development and redevelopment sites within proximity of the Beltway. West of the Beltway, the Gannett/USA Today Headquarters complex on Jones Branch Drive includes 820,000 square feet of office space. The Tysons II development, which includes the Tysons Galleria shopping mall, several office buildings, and a large hotel, is planned to include several additional buildings, although exact sizes and uses have yet to be determined. To the east of the Beltway, Capital One developed a new headquarters campus, which resulted in the redevelopment of the Westgate office park area. All of these Tysons Corner developments lie within the Scotts Run watershed. The Preferred Alternative will impact this watershed through direct impacts to 1,129 meters of Scotts Run and its tributaries. As discussed in Section , urbanization generally increases concentrations of non-point source pollutants in almost all categories associated with higher degrees of development and impervious surfaces. An increase in impervious surface, however, does not necessarily result in an increase in siltation or pollutants. With BMPs in place, the downstream effects on water quality are mitigated to a great extent. Pollutants, including grease and oil, metals, nitrogen, and total suspended solids, are trapped and sequestered in stormwater basins for a short period, and eventually are trapped by bottom-settled sediments. BMPs may also offset increases in peak stormwater flows that would otherwise result from increases in impervious surface. Implementing BMPs for the periodical maintenance of control structures and dredging of stormwater basins is now a requisite activity that also improves and maintains water quality by reducing concentrations of harmful pollutants. As a result of BMP implementation, new construction has the potential to improve water quality because they usually treat a greater area of runoff than what has been disturbed by the project. Existing Development and Roadway Network. As the areas surrounding the Capital Beltway have been developed and built up over the last 40 years, an extensive roadway network has been constructed to serve these new neighborhoods and activity centers. The development of these neighborhoods, activity centers, and roadway network has resulted in the fragmentation and displacement of natural land cover in the project area. As a result, the improvements to the Capital Beltway are occurring in an already-disturbed area and will cause little additional impact. Air Quality. Despite increases in traffic volumes and vehicle miles traveled, air quality in the metropolitan Washington region is improving for each of the six pollutants for which the U.S. Environmental Protection Agency has established standards: ground-level ozone, carbon monoxide, sulfur dioxide, nitrogen dioxide, particulate matter, and lead. Today, the region is meeting standards for four of the six pollutants with ample margins. Ground-level ozone and PM2.5 are the pollutants for which the region has not yet reached the federal health standard. 4-71
274 Capital Beltway Study Chapter 4 Ozone levels have been decreasing over the past two decades. There are fewer days when unhealthful ozone air quality occurs. The study area currently is classified as a moderate nonattainment area for the eight-hour ozone standard and a non-attainment area for PM2.5. As a result, conformity to the SIP is determined through a regional air quality analysis performed on the TIP by the Metropolitan Washington Council of Governments. This regional air quality analysis is based upon a regional model which accounts for traffic not only from proposed improvements to the Capital Beltway but also from other transportation projects planned in the region as well. This cumulative traffic is then used to determine the cumulative impact of these planned transportation improvements on ground level ozone for several milestone years over the life of the CLRP. This analysis, which is dated 2004 and available from the Metropolitan Washington Council of Governments, demonstrates that the pollutants, which make up ozone, will be below the budgets established for the region by the DEQ. Summary of Cumulative Impacts. Quantifying cumulative impacts depends on the availability of data for each of the projects and resources. In some cases, these data are not available due to the timing of this and other studies, as is the case with the Capital Beltway Rail study. In other cases, impacts are evaluated only qualitatively, making only qualitative assessments of cumulative impacts possible. The proposed improvements to the Capital Beltway will affect resources, particularly water resources that have been impacted by prior public and private projects and will likely be impacted in the future. On the other hand, this project and others in the region will have a net benefit on regional air quality due to reductions in congestion. A summary of the potential for cumulative effects as they relate to the other major actions is presented in Table Table 4-23 SUMMARY OF CUMULATIVE EFFECTS Resource Considered Neighborhoods, Community Services, and Cohesion Displacements Visual and Aesthetic Cultural Resources Parks and Recreation Geologic Resources Water Resources Aquatic Biota and Habitat Terrestrial Biota and Habitat Rare, Threatened and Endangered Species Traffic Potential Effects Due to Other Major Actions in Conjunction with the Preferred Alternative Minimal direct effects, some interaction with Dulles Corridor Rapid Transit Project where neighborhoods overlap, but no changes in access or community cohesion projected due to cumulative effects. Displacements from Preferred Alternative. No cumulative effects projected. Direct changes only projected for Preferred Alternative. No cumulative effects projected. No cumulative effects projected. Direct effects from Preferred Alternative. No cumulative effects projected. No cumulative effects projected. Direct effects from Preferred Alternative. Likely cumulative effect is improvement in water quality due to use of current BMPs and upgrades to current stormwater management for watersheds for Beltway improvements and other transportation projects such as the Dulles Corridor Rapid Transit Project and Springfield Interchange Project. Direct effects to wetlands and floodplains from project. Minor cumulative effects to Scotts Run watershed as a result of floodplain encroachments from Beltway improvements and Dulles Corridor Rapid Transit Project. Minor cumulative effects to Cameron Run watershed due to Beltway improvements and Springfield Interchange Project. No cumulative effects projected. No cumulative effects projected. No cumulative effects projected, some benefit projected due to increased mobility. 4-72
275 Environmental Consequences Capital Beltway Study 4.17 RELATIONSHIP BETWEEN LOCAL SHORT-TERM USES OF THE ENVIRONMENT AND THE MAINTENANCE AND ENHANCEMENT OF LONG-TERM PRODUCTIVITY Local short-term uses of the environment principally include the construction impacts described in Section 4.15 and the resources used in the construction of the proposed improvements, including materials, energy, and labor. The short-term environmental impacts and use of resources must be balanced against the long-term benefits of the project, both locally and regionally. The Capital Beltway is a major transportation facility for the region. Improvements to the Beltway are based on local and regional transportation plans and are needed to assure the productivity of Fairfax County and the entire region. The local short-term impacts and use of resources for the project are consistent with the maintenance and enhancement of long-term productivity IRREVERSIBLE AND IRRETRIEVABLE COMMITMENT OF RESOURCES The implementation of the improvements to the Capital Beltway involves a commitment of natural, physical, human, and fiscal resources. Land used in the construction of the improvements is considered an irreversible commitment during the time period that the land is used for highway facilities. However, if a greater need arises for use of the land or if the Beltway improvements are no longer needed, the land can be converted to another use. At present, there is no reason to believe such a conversion will ever be necessary or desirable. Considerable amounts of fossil fuels, labor, and highway construction materials, such as cement, aggregate, asphalt, and steel, would be expended. Additionally, large amounts of labor and natural resources would be used in the fabrication and preparation of construction materials. These materials are generally not retrievable; however, they are not in short supply and their use would not have an adverse effect on the continued availability of these resources. Any construction would also require a substantial one-time expenditure of local, state, and federal funds that are not retrievable. The commitment of these resources is based on the concept that residents in the immediate area and the region will benefit from the improved quality of the transportation system. These benefits would consist of improved accessibility and safety, time savings, and greater availability of quality services, which are anticipated to outweigh the commitment of these resources. 4-73
276 Capital Beltway Study Chapter
277 5 LIST OF PREPARERS This /Section 4(f) Evaluation was prepared by the Virginia Department of Transportation in close coordination with the Federal Highway Administration. Personnel from these agencies who were instrumental in the preparation of this document and related technical studies include: Virginia Department of Transportation Kenneth Wilkinson, Environmental Program Planner Loretta Markham, Environmental Program Planner Jeffrey Cutright, Senior Transportation Engineer Thomas Campbell, Senior Transportation Engineer Bart Thrasher, Senior Transportation Engineer Lloyd Arnold, Environmental Planner Noise Samuel Curling, Environmental Planner Air Quality Amy Costello, Environmental Planner Air Quality Jim Ponticello, Environmental Planner Air Quality Kathy Graham, Transportation Planning Engineer Jackie Keeney, Cultural Resources Manager Helen Ross, Cultural Resources Manager Steve Russell, Chief Wetlands Scientist Robert Condrey, Environmental Planner Federal Highway Administration, Virginia Division Tarsem Lal, Senior Field Operations Engineer Tom Jennings, Transportation Management Engineer Ed Sundra, Senior Environmental Specialist 5-1
278 Capital Beltway Study Chapter 5 CAPITAL BELTWAY STUDY TEAM The Beltway study team, which assisted in the preparation of this Final Environmental Impact Statement/Section 4(f) Evaluation, was comprised of the following representatives from federal, state, and local transportation agencies: Kenneth Wilkinson Jeffrey Cutright Thomas Campbell Kathy Graham Bahram Jamei Susan Shaw Tarsem Lal Ed Sundra Corey Hill Karl Rohrer Doug MacTavish Tony Giardini Jennifer Straub Kathleen Donodeo VDOT, Environmental Division VDOT, Location and Design Division VDOT, Location and Design Division VDOT, Transportation Planning Division VDOT, Northern Virginia District Office VDOT, Northern Virginia District Office Federal Highway Administration Federal Highway Administration Virginia Department of Rail and Public Transportation Virginia Department of Rail and Public Transportation Fairfax County Department of Transportation Metropolitan Washington Council of Governments Northern Virginia Regional Commission Washington Metropolitan Area Transit Authority PROJECT CONSULTANTS The following consultants were involved in the preparation of this Final Environmental Impact Statement/Section 4(f) Evaluation, and related technical reports. A brief resume for each consultant and his/her role in the study are listed below. Parsons Transportation Group Stephen Walter B.S., M.S., Environmental Science; 29 years in environmental planning and NEPA studies. Project Manager J. Stuart Tyler, P.E., A.I.C.P. B.A., Environmental Science and M.S., Civil Engineering; 29 years in environmental planning and NEPA studies. Deputy Project Manager Bruce Barnett, P.E. Kevin Chrisman B.S., Civil Engineering; 16 years in transportation engineering. B.S., Advertising Design; 17 years in illustration and graphics design. Preliminary Engineering, Cost Estimates and Constructability Illustrations and Computer Graphics 5-2
279 List of Preparers Capital Beltway Study Draft Environmental Impact Statement Anne McNulty Darnall Elizabeth Federico, A.I.C.P. Warren Gray, P.W.S., C.F. Kenneth Mobley, A.I.C.P. Mary Pickens B.S., Chemistry and M.S., Geology; 18 years in environmental planning and impact assessment. B.A., Art History and M.R.P., Land Use and Environmental Planning; 7 years in environmental planning and NEPA studies. B.S., Forest Biology; 18 years in environmental planning and natural resources assessments. M.S. Public Policy and Management; 16 years in Land Use, Transportation, and Environmental Planning B.A., English; 31 years in technical editing, writing, and document production. Public Involvement, Environmental Analysis Land Use and Section 4(f) Analysis Natural Environment and Wetland Analyses Environmental and Cumulative Impact Analysis Technical Editing Daniel Prevost, A.I.C.P. B.A., Environmental Science and Policy; 10 years in environmental planning and policy analysis. Sina Raouf, A.I.C.P. M.C.P. City Planning; B.S. Architecture; 26 years experience in transportation planning, master planning and environmental documentation. Air Quality Analysis, Land Use and Socioeconomics, Relocation Analysis Environmental Analysis Patricia Vokoun, P.E. Joshua Wade, P.E. Robert Wright, P.W.S. Gray and Pape Inc. Brad Bowden, RPA Ashley Neville B.S., Civil Engineering; 19 years in design and NEPA studies. B.S., Civil Engineering; 13 years in transportation engineering and computergenerated graphics and presentations. B.S., Environmental Science and B.S., Natural History; 17 years in ecological studies and environmental planning. B.A., Sociology/Anthropology and M.S., Anthropology; 16 years in archaeology and Section 106 compliance. B.A, Historic Preservation and M.A. (candidate), American Studies; 19 years in architectural history surveys and Section 106 compliance. Environmental Analysis Alternatives Development, Cost Estimates, CADD Graphics Natural Environment and Wetland Analyses Task Manager for Cultural Resources, Archaeological Analysis Historic Architecture Analysis Harris Miller Miller & Hanson Inc. Christopher Menge B.S., Physics; 34 years in transportation noise analysis. Task Manager for Noise Analysis 5-3
280 Capital Beltway Study Chapter 5 Christopher Bajdek Jason Volk B.S., Mechanical Engineering; 16 years in transportation noise analysis. B.S., Mechanical Engineering; 6 year in transportation noise analysis. Noise Analysis Noise Analysis Vanasse Hangen Brustlin, Inc. Jim Curren, P.E. Surbhi Ashton, P.E. Sung Shin, P.E. Olegario Villoria Jose Ojeda B.S., Civil Engineering; 29 years in transportation planning and engineering. B.S., Civil Engineering; 12 years in transportation planning and engineering B.S., Civil Engineering; 6 years in transportation planning and engineering B.S., Civil Engineering; 20 years in transportation planning and engineering B.S., Civil Engineering; 20 years in transportation planning and engineering Task Manager for Traffic and Transportation Transportation Analysis Transportation Analysis Transportation Modeling Transportation Modeling 5-4
281 6 DISTRIBUTION LIST The following agencies and organizations were provided copies of this Final Environmental Impact Statement/Section 4(f) Evaluation. Those agencies which provided written comments on the Draft Environmental Impact Statement are noted in the following by an asterisk (*). 6.1 FEDERAL AGENCIES Advisory Council on Historic Preservation - Eastern Office Council on Environmental Quality Federal Emergency Management Agency* U.S. Coast Guard - Fifth District (OAN)* U.S. Department of Agriculture - Department of the Secretary - Natural Resources Conservation Service U.S. Department of the Army - Corps of Engineers Norfolk District* U.S. Department of Energy U.S. Department of Commerce, National Oceanic & Atmospheric Administration - National Marine Fisheries Service - Office of the Chief Scientist U.S. Department of Health and Human Services - Office of Public Health and Science U.S. Department of Housing and Urban Development - Region 3, DC Field Office 6-1
282 Capital Beltway Study Chapter 6 U.S. Department of Interior - Fish and Wildlife Service, Regional Director - Fish and Wildlife Service, Virginia Field Office - National Park Service, National Capital Region - Office of Environmental Policy and Compliance - Office of Environmental Project Review U.S. Department of Transportation - Federal Transit Administration - Federal Railroad Administration U.S. Environmental Protection Agency - Region 3, Virginia Field Office U.S. House of Representatives - Frank Wolf - Jim Moran - Tom Davis U.S. Senate - George Allen - John W. Warner 6.2 COMMONWEALTH OF VIRGINIA AGENCIES AND OFFICIALS Chesapeake Bay Local Assistance Department Virginia Commission for the Arts Virginia Department of Agriculture and Consumer Services Virginia Department of Aviation Virginia Department of Commerce and Trade Virginia Department of Conservation and Recreation - Division of Natural Heritage* - Northern Virginia Soil and Water Conservation District Virginia Department of Environmental Quality - Air Division* - Waste Division - Water Division* Virginia Department of Forestry Virginia Department of Game and Inland Fisheries 6-2
283 Distribution List Capital Beltway Study Virginia Department of Health - Division of Drinking Water* Virginia Department of Historic Resources Virginia Department of Housing and Community Development Virginia Department of Mental Health, Mental Retardation, and Substance Abuse Services Virginia Department of Mines, Minerals, and Energy Virginia Department of Rail and Public Transportation Virginia Economic Development Partnership Virginia House of Delegates - Albert C. Eisenberg - James M. Scott Virginia Institute of Marine Science Virginia Marine Resources Commission Virginia Museum of Natural History Virginia Outdoors Foundation Virginia Port Authority Virginia State Forester 6.3 REGIONAL AGENCIES AND ORGANIZATIONS Greater Washington Board of Trade Metropolitan Washington Airports Authority* Metropolitan Washington Council of Governments National Capital Region Transportation Planning Board Northern Virginia Planning District Commission Northern Virginia Regional Park Authority Northern Virginia Regional Commission* 6-3
284 Capital Beltway Study Chapter 6 Northern Virginia Transportation Commission Virginia Railway Express Washington Metropolitan Area Transit Authority* 6.4 FAIRFAX COUNTY AGENCIES AND OFFICIALS Fairfax County Board of Supervisors* Fairfax County Executive Fairfax County Department of Housing and Community Development Fairfax County Department of Planning and Zoning Fairfax County Department of Public Works and Environmental Services Fairfax County Department of Community and Recreation Services Fairfax County Department of Transportation Fairfax County Economic Development Authority Fairfax County Health Department Fairfax County Park Authority Fairfax County Non-Motorized Transportation Committee* Fairfax County Planning Commission Fairfax County School Board 6.5 OTHER LOCAL GOVERNMENTS City of Fairfax City of Falls Church County of Arlington Town of Herndon Town of Vienna 6-4
285 7 COMMENTS AND COORDINATION Federal, state, and local agencies were contacted to inform them about the proposed Beltway improvements, identify issues of concern, and obtain information about environmental resources within the project area. The general public was notified about the scope of the proposed improvements and was provided numerous opportunities to provide comments about the proposed alternatives and environmental concerns. These agency and public comments helped the Virginia Department of Transportation (VDOT) develop alternatives that meet the project s purpose and need, while minimizing adverse effects on the environment and adjacent communities. 7.1 AGENCY COORDINATION Coordination with various federal, state, and local agencies on the scope of this project began early and continued throughout the study, supplemented by regular meetings of the Beltway Study Team, interagency coordination meetings, and meetings with individual agencies Early Agency Coordination Coordination with appropriate federal, state, and local agencies was initiated in July 1998, when VDOT formally notified these agencies of its intent to prepare an Environmental Assessment (EA) for proposed improvements to the Beltway between the I-95/I-395/I-495 interchange and the American Legion Bridge. Each agency listed in Table 7-1 was given a detailed brochure outlining the scope of the proposed improvements. The brochure included maps and a description of the project location, a discussion of the necessity for improvements to the Capital Beltway, descriptions of the types of alternatives being considered, and a summary of the environmental review process. In a scoping letter accompanying the brochure, VDOT asked each agency to identify concerns about the project and provide information regarding any potentially sensitive environmental resources in the project area. This early notification and coordination allowed for the timely identification, evaluation, and resolution of environmental and regulatory issues. Coordination with interested agencies continued throughout the remainder of the study. 7-1
286 Capital Beltway Study Chapter 7 Table 7-1 AGENCIES AND OFFICIALS CONTACTED DURING EARLY AGENCY COORDINATION FEDERAL AGENCIES Advisory Council on Historic Preservation Federal Aviation Administration, Eastern Region Federal Emergency Management Agency, Region III Federal Transit Administration, Region III National Capital Planning Commission National Marine Fisheries Service, Northeast Region National Ocean Service National Geodetic Survey National Park Service, National Capital Region U.S. Army Corps of Engineers, Norfolk District U.S. Coast Guard, Fifth District U.S. Department of Agriculture Natural Resources Conservation Service, Southeast Regional Office and Virginia State Conservationist U.S. Department of Housing and Urban Development, Virginia State Coordinator U.S. Department of Interior, Office of Environmental Compliance and Policy U.S. Environmental Protection Agency, Region III U.S. Fish and Wildlife Service, Northeast Region VIRGINIA AGENCIES Virginia Department of Agriculture and Consumer Services Virginia Department of Aviation Virginia Department of Conservation and Recreation: Planning and Recreation Resources Division Soil and Water Conservation Division Natural Heritage Division Virginia Department of Environmental Quality: Air Division Policy and Legislation Division Technical Services Division Environmental Sciences Division Customer Services Division Water Division Virginia Department of Forestry Virginia Department of Game and Inland Fisheries Virginia Department of Health Virginia Department of Historic Resources Virginia Department of Housing and Community Development Virginia Department of Mines, Minerals and Energy Virginia Department of Rail and Public Transportation Virginia Institute of Marine Science Virginia Marine Resources Commission Virginia Outdoors Foundation REGIONAL AGENCIES Washington Metropolitan Airports Authority Metropolitan Washington Council of Governments: Transportation Planning Board Citizens Advisory Committee 1. Now the Fairfax County Department of Public Works and Environmental Services. 2. Now the Fairfax County Department of Planning and Zoning. 3. Now the Fairfax County Department of Transportation. Northern Virginia Planning District Commission Northern Virginia Regional Park Authority Northern Virginia Soil and Water Conservation District Northern Virginia Transportation Commission Northern Virginia Transportation Coordination Council Potomac and Rappahannock Transit Commission Virginia Railway Express Washington Metropolitan Area Transit Authority FAIRFAX COUNTY AGENCIES/OFFICIALS Fairfax County Board of Supervisors: Chairman Braddock District Dranesville District Hunter Mill District Lee District Mason District Mt. Vernon District Providence District Springfield District Sully District Fairfax County Executive Fairfax County Department of Environmental Management 1 Fairfax County Department of Fire and Rescue Fairfax County Department of Health Fairfax County Department of Housing and Community Development Fairfax County Department of Police Fairfax County Department of Public Works 1 Fairfax County Economic Development Authority Fairfax County Office of Community and Recreation Services Fairfax County Office of Comprehensive Planning 2 Fairfax County Office of the Sheriff Fairfax County Office of Transportation 3 Fairfax County Office of Waste Management Fairfax County Park Authority Fairfax County Planning Commission Fairfax County School Board Fairfax County Transportation Advisory Commission Fairfax County Water Authority Fairfax County Wetlands Board OTHER LOCAL GOVERNMENTS Arlington County Manager City of Alexandria, Mayor s Office City of Fairfax, Mayor s Office City of Falls Church, Mayor s Office Town of Herndon, Mayor s Office Town of Vienna, Mayor s Office 7-2
287 Comments and Coordination Capital Beltway Study A total of 39 agencies and elected officials formally responded to VDOT s early coordination efforts. Although most of the responding agencies did not have any comments or concerns about the scope of the project, some agencies requested that specific issues be discussed in the NEPA document. Comments received during early agency coordination are summarized below. Federal Agency Comments: Advisory Council on Historic Preservation Initiate coordination with the Virginia State Historic Preservation Officer. Identify and assess impact to historic properties as required by Section 106 of the National Historic Preservation Act. Federal Aviation Administration, Eastern Region No comments; project not a concern with respect to FAA facilities. Federal Emergency Management Agency, Region III Assess impacts to 100-year floodplains. National Capital Planning Commission Proposed improvements are in conformance with National Capital Planning Commission s Comprehensive Plan for the National Capital Region. Include enhanced intermodal connections and signage (e.g., improved access to park and ride lots) in improvement plans. Avoid impacts to the George Washington Memorial Parkway and coordinate any changes/impacts with the National Park Service. National Oceanic Service National Geodetic Survey (National Oceanic and Atmospheric Administration) No comments. National Park Service, National Capital Region Evaluate impacts to park resources. U.S. Coast Guard, Fifth District No comments; project does not cross navigable waterways. U.S. Environmental Protection Agency, Region III An Environmental Impact Statement (EIS) should be prepared for this project to fully study issues such as: residential and business displacements, removal of forested buffers, noise and visual impacts, disruption of commuting patterns, increased congestion and delay, and secondary impacts. The EIS should also assess cumulative impacts from all ongoing transportation projects in the region, including: traffic, delays, air pollution, increased congestion on other roads, alternative traffic patterns that will result, impacts to level of service on the Beltway, and impacts to local roads. Explain how proposed highway improvements would fit into a new regional rail network and if improvements would preclude future rail improvements. Conduct a project-level air quality conformity analysis and assess air pollution impacts. 7-3
288 Capital Beltway Study Chapter 7 Assess effect of project on future vehicle miles traveled. Explain land use and growth assumptions. Analyze effects of alternative land use and growth scenarios on travel demand. U.S. Fish and Wildlife Service, Virginia Field Office Wetland issues will be reviewed after the Draft NEPA document is completed. Coordinate with the U.S. Army Corps of Engineers regarding wetland identification and impact assessment. Virginia Agency Comments: Virginia Department of Agriculture and Consumer Services No comments; do not anticipate any adverse impacts related to preservation of agricultural lands or protection of listed endangered or threatened plant and insect species. Virginia Department of Conservation and Recreation, Planning and Recreation Resources Division No concerns related to potential impacts to existing or planned recreational facilities or streams on the National Park Service Nationwide Inventory, Final List of Rivers, potential Scenic Rivers, or existing or potential Scenic Byways. Virginia Department of Conservation and Recreation, Soil and Water Conservation Division Adhere to the State s erosion and sediment control and stormwater management requirements as contained in VDOT s annual specifications already approved by the Division of Soil and Water Conservation. Virginia Department of Conservation and Recreation, Natural Heritage Division Minimize impacts to natural heritage resources and associated habitat. Virginia Department of Environmental Quality, Technical Services Division No comments. Virginia Department of Environmental Quality, Environmental Sciences Division Consider all possibilities for mass transit improvements and enhanced lane management operation; consider strategies that combine transit enhancements and express/local lanes. Consider air quality impacts of the project when conducting the regional air quality conformity determination. Air quality impact evaluation should include lane management techniques, congestion management systems, or traffic control measures. Assess construction-related air quality impacts, including contributory impacts from construction of other major projects (e.g., Woodrow Wilson Bridge and I-95/I- 395/I-495 interchange). Show vehicle miles traveled, level of service, peak hour vehicle capacities, changes in average congested speed, and time-delay data for existing conditions, no-build, interim construction period, and build scenarios. 7-4
289 Comments and Coordination Capital Beltway Study Include traffic impacts from the new Woodrow Wilson Bridge and I-95/I-395/I- 495 interchange in future no-build and build scenarios. Assess latent demand for additional roadway capacity. Utilize most recently adopted demographic forecast from the Metropolitan Washington Council of Governments in traffic demand forecasts. Virginia Department of Forestry No concerns; project is not significant with regard to the forest resources of Virginia. Virginia Department of Health No concerns; no impacts anticipated to any public water supply or sanitary sewer facilities in the vicinity of the project. Virginia Department of Housing and Community Development Assess potential loss of housing (especially affordable housing) within the corridor. Census tracts with such housing potentially at risk abut the Beltway in Annandale, North Springfield, and Merrifield. Virginia Department of Mines, Minerals and Energy No comments. Virginia Institute of Marine Science No concerns about direct impacts to coastal/marine resources. Virginia Marine Resources Commission Coordinate with the Marine Resources Commission if the proposed improvements encroach on state-owned submerged lands. Regional Agency Comments: Northern Virginia Planning District Commission Concerned about post-construction stormwater quality management; recommends adherence to Virginia Stormwater Management Regulations. Northern Virginia Regional Park Authority Assess impacts to the W&OD Railroad Regional Park and the parcel adjacent to the park at the Beltway. Any impacts to these lands would constitute a conversion of use under 6(f) of the Federal Land & Water Conservation Fund Act and should be evaluated accordingly. Maintain the continuity, safety, and convenience of the W&OD Railroad Regional Park at all times during construction. Replace or upgrade the current grade-separated crossing for the W&OD Railroad Regional Park over the Beltway to current Authority standards. Provide a bridge for the W&OD Railroad Regional Park directly across I-66 to maintain continuity of the trail rather than having it run along Idylwood Park and cross I-66 on the Virginia Lane overpass. Northern Virginia Soil and Water Conservation District Evaluate impacts of increased impervious surfaces (e.g., increased surface runoff, reduced soil infiltration, lower water table, pollution from degraded quality of stormwater runoff, and increased flood discharges downstream). 7-5
290 Capital Beltway Study Chapter 7 Avoid impacts from erosion, sediment, water quality, and stormwater runoff. Avoid aggravating existing sediment, water quality, and water quantity problems in the Scotts Run, Pimmit Run, Cameron Run, and Accotink watersheds. Include stormwater management facilities in plans and use Best Management Practices. Stormwater management facilities should be constructed early and be temporarily modified to serve as sediment basins during construction. Utilize sediment traps and basins to control siltation in project area. Consider temporary or permanent seeding to control erosion during construction. Employ a full-time sediment control specialist during construction to ensure correct installation and maintenance of sediment controls. Northern Virginia Transportation Commission Evaluate systemwide effects of proposed multi-modal solutions, including enhanced bus services that are connected to the region s public transit network. Design improvements to not preclude future rail improvements and to identify where right-of-way for future rail can be preserved now. Consider travel time savings provided by operating express bus service in HOV lanes. Include route-specific analysis in this phase of the study. Design ramps and lanes to allow express bus service on the Beltway (e.g., wide ramp radii to accommodate the turning radii of buses). Consider use of technology to better manage traffic on the Beltway. Washington Metropolitan Area Transit Authority Design improvements to enable use of the HOV lanes by transit and other high occupancy vehicles. Provide exclusive access and egress from the HOV lane to support transit use. Design improvements to ramps and arterials to support express bus service. Provide safe areas for bus stops on arterials and safe access to park and ride lots. Consider traffic management techniques such as allowing buses to use shoulder to bypass queues at traffic signals or extended green signals for buses approaching interchanges. Preserve as much right-of-way as possible so that highway improvements do not preclude future rail improvements. Design interchanges to allow for placement of piers at the proper intervals to support possible future aerial rail structures. Consider the travel needs of pedestrians and bicyclists, especially on the arterial roadways. Fairfax County Agency/Official Comments: Fairfax County Board of Supervisors, Beltway Improvement Task Force Elevate environmental documentation from an Environmental Assessment to an Environmental Impact Statement. Reexamine present standards for cost-effectiveness of sound abatement. 7-6
291 Comments and Coordination Capital Beltway Study Provide clear and understandable information regarding right-of-way acquisition process. Provide prompt resolution of acquisitions. Include mass transit elements in proposed improvements. Further evaluate rail alternatives. I-66 interchange should be developed within the existing right-of-way and consider efficient and safe traffic movement. Coordinate design with Fairfax County Fire Department and Police Department. Include citizen input during the public hearings, and subsequent review and design processes. Design participation from the community and businesses must be solicited and accepted to the maximum extent practicable, at the earliest possible time. Coordinate with other ongoing transportation projects in the area. Cost effectiveness must be considered for all options. Funding sources and priorities must be identified. Fairfax County Board of Supervisors, Mason District (Penelope A. Gross) Include sound walls, where appropriate and desired by local communities, as part of the project. Assess construction-related impacts, including: increase in traffic on local roads, noise pollution in neighborhoods surrounding the Beltway, damage to local roads caused by potential increases in truck traffic, and possible increases in stormwater runoff pollution. Fairfax County Executive No comments. Fairfax County Department of Fire and Rescue Assess impacts on response times as a result of traffic congestion and/or access challenges. Concerned about access to hazardous materials incidents on restricted (barrierseparated) roadways. Fairfax County Department of Health Assess adverse effects to properties near Little River Turnpike interchange that have septic systems and individual water wells. Fairfax County Department of Public Works and Environmental Services No comments. Fairfax County Office of Community and Recreation Services No comments. Fairfax County Department of Planning and Zoning Assess existing and projected noise levels. Concerned about noise impacts, particularly in residential areas. 7-7
292 Capital Beltway Study Chapter 7 Determine right-of-way requirements and assess impacts to existing properties, including the number and type of structures to be taken, the number of residents displaced, and the effects on neighborhood character. Assess air quality impacts, including localized carbon monoxide impacts and regional impacts due to ozone precursors. Assess impacts to wetlands and streams, Resource Protection Areas, and Environmental Quality Corridors. Provide mitigation measures for any adverse impacts. Fairfax County Office of the Sheriff No comments. Fairfax County Transportation Advisory Commission No comments. Fairfax County Water Authority Incorporate adequate stormwater management facilities into final design of proposed improvements. Use appropriate erosion and sediment control measures during construction. Other Local Government Comments: City of Fairfax, Mayor s Office Assess impacts on operation of Route 123 and historic portion of Old Town Fairfax that result from commuters traveling between Interstate 95 and Tysons Corner. Town of Herndon, Department of Community Development No concerns; alternatives to be considered and review process appear to be adequate. Town of Vienna, Mayor s Office Include improvements to reduce the heavy congestion on Route 123 and adjacent residential streets in Vienna Study Team A multi-jurisdictional study team was formed at the beginning of the environmental review process to assist VDOT in identifying Beltway improvement alternatives, examining their engineering feasibility, and assessing their environmental impacts. This study team worked to build a consensus on the alternatives to be included in the environmental document and to identify key issues and concerns. Members of the study team included representatives from the Federal Highway Administration, Virginia Department of Transportation, Virginia Department of Rail and Public Transportation, Fairfax County Department of Transportation, Metropolitan Washington Council of Governments, Washington Metropolitan Area Transit Authority, and Northern Virginia Transportation Commission. The Beltway Study Team met regularly to discuss areas of concern, review technical analyses, and manage the environmental review process. Technical expertise and staff support were provided by the project s consultants. During the course of the 7-8
293 Comments and Coordination Capital Beltway Study environmental study, the study team met a total of 31 times. In addition to these formal study team meetings, many informal meetings were held among individual study team members to review conceptual plans, plan citizen workshops, expedite data collection, or review analytical methods Interagency Coordination Meetings The proposed Beltway improvements were discussed at VDOT s Interagency Coordination Meetings (IACM) on September 15, 1998, and October 17, At the first IACM meeting, the project s purpose and need, history, preliminary alternatives, and preliminary findings of the environmental inventories were presented. The preliminary findings of environmental effects were presented at the second IACM. Representatives from the U.S. Army Corps of Engineers, Virginia Department of Conservation and Recreation, Virginia Marine Resources Commission, U.S. Fish and Wildlife Service, National Marine Fisheries Service, and U.S. Environmental Protection Agency attended the meetings Other Agency Meetings Individual meetings were held with many of the agencies listed in Table 7-1 throughout the environmental review process. For example, briefings were scheduled with the Metropolitan Washington Transportation Planning Board and the Northern Virginia Transportation Coordination Council at key project milestones. In addition, VDOT met with the Washington Metropolitan Area Transit Authority (WMATA) on several occasions to ensure that the proposed improvements to the Beltway would not preclude extending Metrorail to Tysons Corner or other locations where existing right-of-way could be available. Meetings were also held with various Fairfax County agencies, including the Department of Transportation, Department of Planning and Zoning, and the Fairfax County Park Authority, to gather additional information about the project area, review County plans and policies, and to discuss specific technical issues. Several other Fairfax County agencies were consulted and provided technical information or details about their facilities and services within the project area Scoping for Environmental Impact Statement Based on an assessment of the project area and the environmental constraints identified during the Major Investment Study (MIS) for the Capital Beltway Improvements, FHWA and VDOT determined that there would be some impacts associated with constructing and operating this project. However, at that stage of the project development process, the extent and degree of environmental impacts were not clear. The information at that time was not sufficient to determine whether impacts were significant, as defined by the Council of Environmental Quality's regulations for implementing the procedural provisions of NEPA. Therefore, FHWA determined that preparation of an EA was appropriate to identify environmental impacts and determine their severity. This approach was consistent with FHWA's NEPA regulations (23 CFR 771), which require that an EA be completed when the significance of impacts associated with the proposed action is not clearly established. 7-9
294 Capital Beltway Study Chapter 7 As a result of more intensive engineering and operational studies conducted while preparing the EA, the environmental impacts associated with the proposed improvement alternatives were better defined. The studies indicated the following: 1. Potential impacts to wetlands, residential and commercial properties, parks and recreation areas near interchanges, along the mainline, and in the extended study area were greater than the impacts initially identified in the MIS. 2. Additional right-of-way is needed along the mainline for each alternative. At the outset of the NEPA process for this project, it was assumed that, with the exception of areas next to interchanges, the proposed improvements could be accommodated within the existing right-of-way. 3. Federal, state, and local agencies expressed concern over the level of environmental documentation. Based on these findings, FHWA and VDOT cooperatively decided to elevate the environmental document from an EA to an EIS. A Notice of Intent was published in the Federal Register on July 11, 2000, which advised the public of this decision. Coincident with the Federal Register notice, additional scoping letters were sent to federal, state, and local agencies. Because of the level of coordination that had taken place in the development of the EA, it was determined that a formal scoping meeting was not necessary. Twenty-six agencies formally responded to this second set of scoping letters with updated agency points of contact and/or reiterations of previously submitted comments. A summary of the comments received is presented below. Federal Agency Comments: Advisory Council on Historic Preservation Environmental document should be coordinated with the Virginia State Historic Preservation Officer as required by Section 106 of the National Historic Preservation Act. Army Corps of Engineers Designated point of contact. Provide update of project status at next interagency coordination meeting. Environmental Protection Agency, Region III Agreed to participate as a Cooperating Agency. Federal Aviation Administration, Eastern Region Designated point of contact. Federal Emergency Management Agency, Region III Designated point of contact. Housing and Urban Development Designated point of contact. 7-10
295 Comments and Coordination Capital Beltway Study National Park Service, National Capital Region Designated point of contact. Natural Resource Conservation Commission Designated point of contact. U.S. Fish and Wildlife Service, Virginia Field Office Wetland issues will be reviewed after the Draft NEPA document is completed. Coordinate with the U.S. Army Corps of Engineers regarding wetland identification and impact assessment. Virginia Agency Comments: Virginia Department of Agriculture and Consumer Services Project will not involve disturbance or transfer of agricultural lands. Contact Department regarding endangered plant and insect species. Designated point of contact. Virginia Department of Conservation and Recreation Designated point of contact. Virginia Department of Economic Development Partnership Designated point of contact. Virginia Department of Environmental Quality Project must be shown to conform in a Transportation Conformity Analysis. Since project is located within an ozone non-attainment area, fugitive emissions of volatile organic compounds (VOCs) and oxides of nitrogen (NOx) generated from construction activities must be minimized. Applicable state air pollution regulations include: Fugitive Dust and Emission Control (9 VAC et seq.) Open Burning Restrictions (9 VAC et seq.) Cut-back Asphalt Usage Restriction (9 VAC , et seq.) Designated point of contact. Virginia Department of Historic Resources Designated point of contact. Virginia Department of Mines, Minerals and Energy No additional data are available. Virginia Institute of Marine Science Designated point of contact. Virginia Marine Resources Commission Designated point of contact. 7-11
296 Capital Beltway Study Chapter 7 Virginia Outdoors Foundation Foundation holds no easements in vicinity of project. Regional Agency Comments: Metropolitan Washington Council of Governments Designated point of contact. Northern Virginia Regional Park Authority Authority owns and operates the Washington & Old Dominion (W&OD) Trail, which crosses the Beltway. The Park Authority must review and approve plans affecting this facility. Maintain the continuity, safety, and convenience of the W&OD Railroad Regional Park at all times during construction. W&OD Trail was acquired and developed with assistance from Land and Water Conservation Funds (LWCF). Under Section 6(f) of the LWCF Act, any conversion from park use to roadway use must be approved by the National Park Service, Virginia Department of Conservation and Recreation, and the Regional Park Authority. Fairfax County Agency/Official Comments: Fairfax County Board of Supervisors Designated point of contact. Fairfax County Department of Health Consider properties adjacent to or directly affected by construction that are served by on-site sewage disposal systems and groundwater wells. Recommend attention be paid to the effect of construction activities on air pollution and stream water quality. Designated point of contact. Fairfax County Park Authority Designated point of contact. Fairfax County Public Schools Improvement alternatives should include: (1) some form of physical separation of lanes, and (2) adequate grade, deceleration, and turning radius for large vehicles at interchange and access. Other Local Government Comments: Arlington County, Office of County Manager Designated point of contact. City of Falls Church Designated point of contact. 7-12
297 Comments and Coordination Capital Beltway Study Town of Vienna, Mayor s Office Designated point of contact Comments on the Draft EIS A total of 14 agencies responded to receipt of the Draft EIS. The comment letters received are presented in Appendix A. Upon receipt, each letter was reviewed and comments were assigned a number. Responses to each comment are also presented in Appendix A. The following federal, state, regional, and local agencies or elected officials submitted comments on the Draft EIS for the Capital Beltway Study: Federal Agencies Federal Emergency Management Agency U.S. Coast Guard U.S. Department of the Army, Corps of Engineers Virginia Agencies Department of Conservation and Recreation Department of Health, Division of Drinking Water Department of Environmental Quality, Virginia Water Protection Permit Program Department of Environmental Quality, Office of Air Data Analysis Regional Agencies Metropolitan Washington Airports Authority Northern Virginia Regional Commission Washington Metropolitan Area Transit Authority Local Elected Officials and Agencies Fairfax County Board of Supervisors, Providence District Commonwealth of Virginia, House of Delegates, 47th District Commonwealth of Virginia, House of Delegates, 53rd District Fairfax County, Countywide Non-Motorized Transportation Committee 7.2 PUBLIC INVOLVEMENT VDOT developed an extensive public involvement program to ensure that concerned citizens, interest groups, civic organizations, and businesses had adequate opportunities to express their views throughout the environmental review process. Following are the objectives of the public involvement program: Educate the public regarding the existence, purpose, and scope of the project; 7-13
298 Capital Beltway Study Chapter 7 Encourage and provide opportunities for public participation throughout the study process; Report findings of technical analyses at key project milestones; and Document how public suggestions and concerns have been considered and incorporated into the project s planning. Various communication media, including newsletters, brochures, questionnaires, informational videos, the Internet, a project telephone hotline, and citizen workshops were used to provide information about the project and gather input from citizens and other interested parties. In addition, VDOT representatives met personally with numerous interest groups, civic associations, and businesses to discuss the project and answer questions about the proposed improvements and the environmental review process Outreach Program A variety of outreach techniques and materials were used to inform citizens and other interested parties about the details of the proposed Beltway improvements and to solicit their comments and concerns. Specific tools used to notify the public and engage them in the study process are described below. In addition to these outreach methods, VDOT officials conducted interviews with local and regional newspapers, television news organizations, and public radio to raise awareness of the project, answer questions, and describe the environmental review process. Project Hotline. A telephone hotline (703/359-MOVE) was established to handle information requests and record public comments about the project. Calls are answered from 8 a.m. to 5 p.m., Monday through Friday, for the duration of the study. At other times, messages are recorded and calls returned at a later date, if necessary. In addition, a project address (beltway_study@parsons.com) was established to provide another way for citizens to comment or request project information. During the course of the study, more than 600 calls were made to the project hotline and more than 900 messages were sent to the project address. Internet. Information was also available on the Internet for the duration of the study. A summary of the project is available on the Virginia Department of Transportation s web site ( In addition, a separate project-specific web site was created to provide more detailed information about the proposed Beltway improvements. This web site ( includes information on the project s background, the environmental review process, alternatives being considered, traffic and transportation issues, and an extensive set of Frequently Asked Questions (FAQs). The project web site also includes electronic versions of project newsletters, public meeting displays, conceptual plans, and other project documents. Project Mailing List. A project mailing list, which VDOT used to send announcements of upcoming public meetings and distribute project newsletters, was created at the beginning of the environmental review process. The mailing list included entries for local, state, and federal elected officials; representatives from local, regional, state, and federal government agencies; interested citizens; civic associations in Fairfax County; local transportation and 7-14
299 Comments and Coordination Capital Beltway Study planning agencies; and the news media. The project mailing list is being continuously updated throughout the study to include citizens who asked to be included, attendees at VDOT and Fairfax County public meetings on the Beltway project, and attendees at meetings with interest groups, civic associations, and businesses. The mailing list contained approximately 2,000 entries at the beginning of the environmental review process; it now contains more than 3,500 entries. Newsletters. Seven project newsletters were prepared during the course of the study to keep interested parties informed about its status and progress. Topics discussed in these newsletters included: the Beltway MIS recommendations, an overview of the environmental review process, VDOT s public involvement program, public meeting announcements and agendas, the types of alternatives being considered, the scope of environmental analyses, and the project schedule. Each newsletter also provided an address for written comments and the telephone hotline number for questions, comments, and information requests. The newsletters were mailed to all individuals, organizations, and agencies on the mailing list; were made available at public meetings; and were sent to hotline callers who requested additional information about the project. Additional copies of the newsletters were also provided to elected officials and civic associations upon request. Brochures. Informational brochures describing the need for Beltway improvements, the types of alternatives being considered, and the environmental review process were prepared for each of the citizen workshops and public meetings. These brochures were distributed to workshop attendees, citizens or groups that requested copies, and attendees at informal meetings with VDOT representatives. The brochures supplemented the information being presented at the workshops and presented an overview of the project in a concise, easy-to-read format. A similar informational brochure summarizing the environmental impacts of the various alternatives being considered was distributed at the Location Public Hearing Meetings with Interest Groups, Homeowners Associations, Community Organizations, and Property Owners In addition to formal public meetings for the project, VDOT representatives met with several interest groups, civic and homeowners associations, community organizations, and individual property owners to discuss the proposed Beltway improvements, outline the environmental review process, and answer specific questions about the alternatives and potential environmental impacts. During the course of the study, more than 40 meetings were held with the following groups. Audiences at these meeting ranged from small groups (five or six people) to several hundred. Multiple meetings were held with some groups. Braddock District Council BF Saul Company Coscan (Brookfield Homes) Camelot Civic Association Dunn Loring Improvement Association Fairfax Coalition for Smarter Growth Fairfax County Chamber of Commerce Falls Church/Merrifield Chamber of Commerce 7-15
300 Capital Beltway Study Chapter 7 Greater Washington Board of Trade, Transportation Committee Hines Construction (Gannett Corporation) Mason District Council McLean Citizens Association McLean Citizens Association, Transportation Committee McLean Hamlet HOA Merrifield Task Force Opus East (Metro Place) Ravensworth-Bristow Civic Association Ravensworth Farm Civic Association Regency of McLean Sandburg Station HOA Shrevecrest/Fallswood HOA Stone Haven Civic Association Tysons Corner Center TYTRAN Citizen Workshops Two sets of workshops have been held to gather public input about the range of alternatives being considered and the scope of the environmental review. Because of the size of the project area, each set of workshops was held in three locations between the I- 95/I-395/I-495 interchange and the American Legion Memorial Bridge on consecutive nights. Identical information was presented at each night s workshop. These open house workshops offered an opportunity for interested citizens and nearby residents to learn more about the proposed Beltway improvements and participate in the ongoing environmental review process. Materials that provided background information about the project were available at the workshops, including informational videos; detailed displays on the need for Beltway improvements, the environmental review process, and traffic studies; and large maps showing conceptual plans for the proposed roadway and interchange improvements. Informational handouts, including project newsletters, brochures, and summaries of existing conditions, were also available. VDOT staff and project consultants were present throughout the evening to answer questions and explain the study process, traffic analysis, and conceptual plans. All workshop attendees were provided with comment forms to express their comments and concerns about the project in writing. Verbatim reporters were present to record people s oral comments. November 1998 Workshops. The first set of citizen workshops was on November 17, 18, and 19, 1998, from 4:30 p.m. to 8:00 p.m., at Luther Jackson Middle School in Falls Church, Poe Middle School in Annandale, and Franklin Sherman Elementary School in McLean. Various methods were used to advertise the workshops. More than 2,000 newsletters, summarizing the study process and announcing the workshops, were mailed to citizens, interest and civic groups, businesses, local elected officials, and local media outlets (including minority newspapers) on October 31, Advertisements for the workshops appeared in the Washington Post, Washington Times, Fairfax Journal, and Times Community newspapers approximately three weeks and one week prior to the workshops. In addition, 75,000 postcards were mailed to the residents of Fairfax County, and more than 650 fliers were mailed to employers in the study area. A total of 461 citizens registered as workshop attendees. These workshops provided participants with an overview of the environmental review process, a review of the types of alternatives 7-16
301 Comments and Coordination Capital Beltway Study being considered, and possible interchange improvement concepts. To help VDOT understand more about how, when, and why drivers use the Beltway, workshop attendees were asked to complete a short questionnaire. This questionnaire also asked attendees what types of improvements were preferred and where improvements should be a priority. Questionnaires were completed by 175 of the persons attending the workshops. Following are among the key findings: Most respondents (75 percent) live within one mile (1.6 kilometers) of the Beltway; 39 percent live within ¼ mile (0.4 kilometer). Most respondents use the Beltway daily, generally during the morning and evening peak periods. More than half of the trips made on the Beltway are journeys to work; most other trips are for shopping or personal business. More than two-thirds of respondents use alternate routes to avoid congestion on the Beltway. Beltway interchanges at I-66, Leesburg Pike, and Chain Bridge Road were considered the worst-performing interchanges. A complete summary of the questionnaire results is included in the November 1998 Citizen Workshop Summary Report. VDOT received comments from 270 citizens, businesses, civic associations, and interest groups. 1 A total of 197 comment forms, 29 messages, and 9 letters and postcards were submitted, and 35 people spoke to the verbatim reporters. There were 208 unique comments made by the respondents and a wide range of issues was identified. The most prevalent comments were: (1) include a rail transit alternative in current study (65 commentors), (2) evaluate noise impacts and add sound barriers (55 commentors), and (3) improve the region s public transportation system (41 commentors). Many commentors also expressed concerns about impacts to properties adjacent to the Beltway and supported construction of a new bypass around the Washington, D.C. area. A summary of all comments received and copies of the actual comments sheets (or other correspondence) are included in the November 1998 Citizen Workshop Summary Report. June 1999 Workshops. The second set of citizen workshops was on June 8, 9, and 10, 1999, from 5 p.m. to 9 p.m., at Poe Middle School in Annandale, Shrevewood Elementary School in Falls Church, and the Best Western Tysons Westpark Hotel in McLean. To maximize participation by interested citizens and ensure that all potential stakeholders were notified, a comprehensive notification campaign was carried out. All 3,400 individuals, businesses, associations, and interest groups on the project mailing list received notification of the workshops through the project newsletter. In an effort to reach citizens who had not previously expressed interest in the project, postcards were mailed to 1 This total includes all comments received between the beginning of the environmental review process (July 1998) through the November 1998 Citizen Workshops. 7-17
302 Capital Beltway Study Chapter 7 all addresses, comprising more than 82,000 citizens and businesses, in the zip codes immediately adjacent to the project area. Multiple advertisements announcing the meetings were placed in the Washington Post and Washington Times, as well as local newspapers that are distributed throughout the county, such as the Fairfax Journal, Times Community, and Connection newspapers. Letters announcing the June workshops were also mailed to each of the groups VDOT has met with to help ensure that their members were notified of the June workshops. The second set of workshops was even more well-attended than the first set, with more than 700 registered attendees. This series of workshops provided citizens with another opportunity to learn more about the Capital Beltway Study and to provide input at an early stage in the environmental review process. In response to requests from the public, agencies, and local elected officials, the format for this set of workshops was expanded from the traditional open house format to include a scheduled presentation and question-and-answer session. These workshops also featured representatives from VDOT s right-of-way office to answer property-related questions, the project s acoustical consultant to answer noise questions, and information about other planned transportation improvements in the region. As a result of these workshops, VDOT received comments from 400 citizens, businesses, civic associations, and interest groups. 2 A total of 164 comment forms, 57 messages, and 128 letters and postcards were submitted, and 51 people spoke to the verbatim reporters. There were 252 unique comments made by the respondents and a wide range of issues was identified. The most prevalent comments were: (1) interchange improvements are needed (88 commentors), (2) general support for the 12-lane Express/Local with HOV improvement alternative (84 commentors), and (3) interchange designs should accommodate transit links in radial corridors (83 commentors). A summary of all comments received and copies of the actual comments sheets (or other correspondence) are included in the June 1999 Citizen Workshop Summary Report Fairfax County Beltway Task Force Public Meetings Because of concerns about the potential impacts of the proposed Beltway improvements, the Fairfax County Board of Supervisors created the Beltway Improvement Task Force in December Chaired by Jack Herrity (former Chairman of the Fairfax County Board of Supervisors), the Task Force was comprised of representatives from neighborhoods and businesses adjacent to the Beltway. Acting as a community liaison to the county government, the Task Force provided additional citizen involvement in the process and worked to minimize impacts to affected residents, businesses, and property owners. The Task Force held a series of public meetings in January and February Although these meetings were not part of its public involvement program for this project, VDOT participated in these public meetings at the Task Force s request. At the Task Force meetings, displays from the November 1998 workshops were available for review. VDOT representatives also presented an overview of the proposed Beltway improvements and 2 This total includes all comments received during the 60-day comment period for the November 1998 Citizen Workshops. 7-18
303 Comments and Coordination Capital Beltway Study answered questions from citizens attending the meetings. Following these public meetings, the Task Force submitted a report to the County Board in April 1999 that identified the major issues and concerns of communities along the Beltway and included several recommendations. This report was forwarded to VDOT and was considered in developing Beltway improvement alternatives and conducting the environmental review process Location Public Hearing Public hearings for the Capital Beltway Study were held on May 28, 29, and 30, The hearings were held at the Hilton Springfield Hotel in Springfield, the Tyson s Westpark Hotel in Mclean/Tyson s Corner, and the Fairview Park Marriott Hotel in Falls Church, respectively. This series of public hearings was intended to provide citizens with an opportunity to provide input on the findings of the Draft EIS. To maximize participation from interested citizens and ensure that all stakeholders were notified, a comprehensive notification campaign was carried out. Efforts were made to ensure that all potentially interested parties received notice of the hearings. All individuals, businesses, associations, and interest groups on the project mailing list received notification about the hearings through the project newsletter. The mailing list, which included approximately 3,900 names. In an effort to reach stakeholders who had not previously expressed interest in the project, postcards were mailed to all addresses in the zip codes immediately adjacent to the project area, comprising more than 250,000 residences and businesses. Multiple advertisements announcing the hearings were placed in the Washington Post and Washington Times, as well as local newspapers, such as the Journal and Times Connection newspapers, that are distributed throughout Fairfax County. In addition, letters announcing the May hearings were mailed to each of the groups VDOT has met with to help ensure that their members were notified. Finally, press releases were mailed to the local media before the hearings and a press briefing was held on May 28, 2002 immediately prior to the first hearing. The project hotline and address were also monitored daily to handle information requests, answer questions, and accept public comments. A total of 927 citizens signed the attendance logs located at the entrance of the hearings. After signing in, attendees were offered a project brochure and comment form. Upon entering the hearing area, citizens were guided to the detailed displays of the environmental review process, traffic studies, and preliminary plans for the alternatives and interchanges between Springfield and the American Legion Bridge. Members of the study team were available throughout the display room to answer questions and offer explanations of the study process, traffic analysis, and preliminary plans. Due to the large number of previous questions and comments regarding the Department s right-of-way policies, tables dedicated to these issues were set up and staffed by VDOT right-of-way personnel. Right-of-way plans that indicated all potential displacements were available for review and discussion. Copies of the Draft Environmental Impact Statement as well as copies of the supporting technical reports were available at the public hearings. Attendees were able to review the documents, as well as discuss them with study team members. 7-19
304 Capital Beltway Study Chapter 7 A presentation, followed by a citizen comment session, began each evening at 6 p.m. Verbatim reporters for oral comments were available in the display room throughout the evening, enabling individuals to have their testimony recorded even if they did not sign up to speak in front of all in attendance. A total of 1,823 citizens, businesses, civic associations, interest groups, and elected officials submitted comment statements for the Capital Beltway Study during the public hearing period, and 191 participants had their oral testimony recorded at the May 2002 public hearings. Following the hearings, all of the comment forms, letters, faxes, postcards, messages, petitions, and records of testimony were given a unique identification number and logged into the project s database, to facilitate their review. To facilitate review by the study team, the comments were categorized as explained in Appendix B. A summary of all comments received and responses to those comments is also presented in Appendix B. More detailed information about these hearings, including copies of the notification materials, display boards, handouts, and comment statements received, is presented in the Summary Report for the Location Public Hearing, Volumes I, II, III, and IV June 2004 Public Workshops Based on the large number of comments received from local governments and the general public regarding the physical impacts associated with the proposed improvements presented in the Draft EIS, VDOT decided to evaluate modifications which would reduce the size of the Candidate Build Alternatives. In addition, the feasibility and effectiveness of High-Occupancy Toll (HOT) lanes on the Beltway was also evaluated. The results of these additional studies were presented at two citizen information meetings held on June 29 and 30, 2004 near Falls Church (at the Fairview Park Marriott and in Tysons Corner (at the Tysons Westpark Hotel). Notice of these meetings was provided in the same manner as for the previous Location Public Hearings. Both of the meetings were well attended with nearly 400 citizens participating over the two nights. Detailed plans of the revised alternatives were available for review, as well as displays of associated environmental impacts and traffic operations. As a result of the meetings, VDOT received more than 200 written comments about the revised Candidate Build Alternatives. These comments and additional technical studies were considered by the Commonwealth Transportation Board in the selection of the Preferred Alternative on January 20,
305 8 SECTION 4(f) EVALUATION 8.1 INTRODUCTION Section 4(f) (49 U.S.C. 303) of the U.S. Department of Transportation Act of 1966 protects public parks and recreational lands, wildlife habitat, and historic sites of national, state, or local significance from acquisition and conversion to transportation use. Section 4(f) is implemented by regulation 23 CFR Section 4(f) applies to publicly owned parks, recreational areas, and wildlife or waterfowl refuges, but it does not apply to these land uses if they are privately owned. Publicly owned land includes parks, recreation areas, or wildlife or waterfowl refuges when the land has been officially designated as such or when the federal, state, or local officials having jurisdiction over the land determine that one of its major purposes or functions is for park, recreation, or refuge purposes. Section 4(f) also applies to all historic sites, whether or not they are publicly owned, that are in, or have been determined to be eligible for listing in, the National Register of Historic Places (National Register). In historic districts, Section 4(f) normally does not apply where an affected or potentially affected property is not individually historic, is not an integral part of the historic district in which it is located, and does not contribute to the factors that distinguish the district historic. Section 4(f) also applies to all archaeological sites in or eligible for inclusion in the National Register if it has been determined, after consultation with the State Historic Preservation Officer (SHPO) and, if applicable, the Advisory Council for Historic Preservation (ACHP), that the site warrants preservation in place. If the site is determined to be important chiefly because of what can be learned by data recovery and has minimal value for preservation in place, Section 4(f) does not apply. According to Section 4(f), the use of public lands for transportation purposes may only occur if there is no feasible and prudent alternative to such use and if the project includes all possible planning to minimize harm to resources from such use. The determination of feasible and prudent alternatives must include supporting information that demonstrates unique problems or unusual factors involved with implementing avoidance alternatives or that the cost, social, economic, and environmental impacts, or community disruption resulting from such alternatives would reach extraordinary 8-1
306 Capital Beltway Study Chapter 8 magnitudes. An alternative may be rejected as not being feasible and prudent if it meets one of the following criteria: Would not meet the project purpose and need; Would have excessive costs of construction; or Would result in severe operational or safety problems; unacceptable adverse social, economic, or environmental impacts; serious community disruption; or accumulation of the aforementioned impacts that, when combined, would reach an unacceptable level. Section 6(f) of the U.S. Land and Water Conservation Fund Act of 1965 (16 U.S.C to ) preserves, develops, and assures the quality and quantity of outdoor recreation resources through purchase and improvement of recreational lands, wildlife and waterfowl refuges, and other similar resources. Section 6(f) contains provisions to protect and maintain the quality of federal, state, and local investments in parkland and/or recreational resources. The Act established a funding source for federal acquisition of park and recreation lands and matching grants to state and local governments for recreation planning, acquisition, and development. Once purchased using these funds, these lands are protected from conversion to uses other than public outdoor recreational uses. Any such conversion must be in accordance with an existing comprehensive statewide outdoor recreation plan and must be approved by the Secretary of the Interior. If a conversion occurs, the land must be replaced with other recreational properties of at least equal fair market value and with reasonably equivalent usefulness and location. The conversion requirements for Section 6(f) land are outlined in 36 CFR The Section 6(f) conversion process is usually conducted jointly by the Virginia Department of Conservation (VDCR) and the US department of Interior (USDOI) following the completion of the NEPA process. 8.2 PURPOSE AND NEED FOR THE PROPOSED ACTION The Federal Highway Administration (FHWA), in conjunction with the Virginia Department of Transportation (VDOT), proposes to improve the Capital Beltway (I-495) in Fairfax County, Virginia, between the I-95/I-395/I-495 Interchange and the American Legion Bridge. Improvements are needed to increase the Beltway s capacity to accommodate expected growth in daily traffic volumes and to remedy current congestion, operational, and safety problems on this critical link in the region s transportation system. The Capital Beltway provide connections to other major roadways within the Washington, D.C. region and carries more traffic than any other road in Virginia. Although there have been incremental improvements to correct specific safety and operational problems during its 42 years of operation, the last major improvements to the Beltway were completed in 1977, when it was widened from four to eight lanes. Because of its role as a key link in the region s transportation system, major improvements to the Beltway have been recommended in local, regional, and state transportation plans for almost a decade. Major factors contributing to the need for Beltway improvements are listed in the Table
307 Section 4(f) Evaluation Capital Beltway Study Table 8-1 PURPOSE AND NEED FOR BELTWAY IMPROVEMENTS Purpose of the Beltway Improvements 1. Provide safer and more efficient travel on the Beltway. 2. Correct substandard roadway and interchange design. 3. Ease Beltway congestion and reduce cutthrough traffic on local roadways and neighborhood streets. 4. Complete the regional HOV roadway network and enhance connections with other regional roadways. 5. Expand availability of mass transit options and improve access to other transportation modes. 6. Accommodate growing travel demand and changes in regional trip characteristics. 7. Better serve the diverse mix of land uses and improve access to regional activity centers in Fairfax County. 8. Preserve key link in transportation system that sustains regional economy. Why Improvements Are Needed Accidents on the Beltway are increasing. Congestion and the current roadway design are the cause of many accidents. Beltway travel speeds are decreasing. Travel times and the length of back-ups on the Beltway are increasing. Beltway and interchanges were not designed to handle current traffic volumes. Many interchanges and portions of Beltway do not meet current engineering and safety standards. Expansion of the regional roadway network has not kept pace with population and employment growth. Major capacity improvements to the Beltway have not been made in almost 25 years. Beltway congestion spills over to adjacent roadways. Congestion levels will worsen in the future. Beltway serves both local and through traffic. Regional HOV system is incomplete; Beltway link between existing HOV facilities is missing. Beltway is important to regional freight movement. Transit on the Beltway would increase its capacity and enhance mobility. Existing Beltway does not support effective express bus operations. Beltway provides access to other transportation modes and facilities. Changing demographics and employment patterns are increasing the number of trips made each day. Suburb-to-suburb trips are on the rise. Combined trips (with intermediate stops) are increasing. Most trips in the region are made by automobile. Fairfax County has urbanized rapidly since New development is occurring primarily in suburban areas. Non-residential land uses are increasing. Density of suburban activity centers is increasing. Additional development is already approved to take place as provided for in Fairfax County s land use plan. Fairfax County is major employment center. Most new jobs and businesses are being created in the suburbs. Work force changes are increasing travel demand. Congestion has economic costs. Regional employment to grow substantially over the next 20 years. 8-3
308 Capital Beltway Study Chapter 8 Table 8-1 PURPOSE AND NEED FOR BELTWAY IMPROVEMENTS Purpose of the Beltway Improvements 9. Meet the transportation needs of a growing population. 10. Upgrade the region s transportation infrastructure in accordance with local and regional plans. Why Improvements Are Needed Population of Northern Virginia has increased 50 percent since Center of region s population has shifted to Fairfax County. Population will grow another 40 percent by Number of households is growing even faster than the population. Improvements to the Beltway have been recommended for more than a decade by local governments, regional planning agencies, and state transportation officials. Based on its ability to best satisfy the noted criteria of purpose and need, the Commonwealth Transportation Board (CTB) selected the 12-Lane HOT / Managed Lanes Alternative as the Preferred Alternative. As described previously in Chapter 2, the Preferred Alternative is one of two revised alternatives developed from the Candidate Build Alternatives presented in the Draft EIS. Substantial reductions in the amount of right-of-way required for the revised alternatives also resulted in similar reductions in the use of Section 4(f) resources. Each of the Candidate Build Alternatives in the Draft EIS could potentially affect eight parks and one historic district involving the direct use to acres of Section 4(f) properties. Designs for the two revised build alternatives (12-Lane HOT and 10-Lane HOV) reduced the number of effected Section 4(f) properties to five parks and substantially reduced the amount of Section 4(f) lands used to 1.14 to 2.5 acres. Although the Preferred Alternative required the use of approximately 1.36 acres of Section 4(f) lands than the revised 10-Lane HOV Alternative, it far outperformed the 10-Lane Alternative in each of the ten operational and safety merits contained in the purpose and need. In each case of additional 4(f) use by the Preferred Alternative, the property involved is a linear sliver of parkland adjacent the existing Beltway right-of-way and in each case the properties are far distant from area of active park functions. 8.3 SECTION 4(f) PROPERTIES As listed in Table 8-2 and shown on Figure 8-1, there are 25 properties along the Beltway subject to protection under Section 4(f). They include county parks, regional parks, a national park, public school recreational facilities that are available for public use, and historic districts. The following section describes the five Section 4(f) properties which are directly affected by the Preferred Alternative. Details on the other properties may be found in the Draft EIS. 8-4

309 Section 4(f) Evaluation Capital Beltway Study 8-5

310 Capital Beltway Study Chapter 8 Accotink Stream Valley Park Annandale Community Park Americana Park Wakefield Park Howery Field Park Fitzhugh Park Canterbury Woods Park 495 Flag Run Park Lake Accotink Park North Springfield Elementary School Begin Project Approximate Scale (Miles) SECTION 4(f) PROPERTIES I-95/I-395/I-495 Interchange to Little River Turnpike BLTWY037 Figure 8-1a (1 of 4) CAPITAL BELTWAY STUDY 8-6

 Wakefield Park BLTWY038 SECTION 4(f) PROPERTIES Little River Turnpike")
311 Section 4(f) Evaluation Capital Beltway Study Stenwood Elementary School Jefferson District Park 495 Holmes Run Acres Historic District Accotink Stream Valley Park Woodburn Elementary School Annandale Community Park Americana Park Approximate Scale (Miles) Wakefield Park BLTWY038 SECTION 4(f) PROPERTIES Little River Turnpike to I-66 Figure 8-1b (2 of 4) CAPITAL BELTWAY STUDY 8-7
312 Capital Beltway Study Chapter 8 Scotts Run Stream Valley Park 495 Lisle Park George C. Marshall High School W&OD Railroad Regional Park Idylwood Park Stenwood Elementary School Jefferson District Park Approximate Scale (Miles) SECTION 4(f) PROPERTIES I-66 to Dulles Access/Toll Road BLTWY039 Figure 8-1c (3 of 4) CAPITAL BELTWAY STUDY 8-8

 SECTION 4(f) PROPERTIES Dulles Access/Toll Road")
313 Section 4(f) Evaluation Capital Beltway Study Scotts Run Nature Preserve End Project George Washington Memorial Parkway Scotts Run Stream Valley Park 495 Cooper Middle School Timberly Park McLean Hamlet Park Falstaff Park Scotts Run Stream Valley Park Approximate Scale (Miles) SECTION 4(f) PROPERTIES Dulles Access/Toll Road to American Legion Memorial Bridge BLTWY040 Figure 8-1d (4 of 4) CAPITAL BELTWAY STUDY 8-9
314 Capital Beltway Study Chapter 8 The parks and recreational facilities are owned and operated by the Fairfax County Park Authority, the Northern Virginia Regional Park Authority, the National Park Service, or the Fairfax County School Board. The Fairfax County Park Authority categorizes its parks by functions and service areas: Neighborhood Parks generally encompass 3 to 10 acres and are characterized by easilyaccessible, low-intensity recreation. Facilities may include picnic areas, trails, playgrounds, fitness stations, natural areas, and recreational fields or courts. Limited or no parking is typically provided. These parks serve adjacent residential areas within a 15-minute walk. Community Parks generally encompas10 to 50 acres and include with facilities for a variety of individual and organized recreational activities. Facilities may include athletic fields and courts, playgrounds, trails, picnic areas, and garden plots. Parking is usually provided on-site or co-located with adjoining development. These parks serve neighborhoods within three miles. District Parks generally encompass 50 to 200 acres and include diversified area-wide recreational services for extended day use and organized activities. Facilities may include interpretative natural or cultural resources, large complexes of athletic fields and courts, picnic pavilions, playgrounds, equestrian facilities, miniature golf, amphitheaters, and trails. Access is provided via multiple transportation modes, with on-site parking provided. Developed facilities may be combined with extensive natural areas. These parks serve large portions of county population and typically have a service area of up to seven miles. Multiple Resource Parks are normally 200 acres or more and include a variety of recreational opportunities in natural settings and at developed outdoor facilities for individuals and large groups. These parks are often used for day-long or extended activities with large numbers of participants or spectators. Facilities may include camp grounds, boat ramps, visitor centers, tournament-level athletic fields, and swimming pools. Multiple resource parks generally serve all county residents as well as visitors. Natural Resource Parks preserve and protect areas of sensitive environmental or ecological areas. These parks may include interpretive facilities, visitors centers, and hiking, biking, or equestrian trails. They serve all county residents and visitors. Stream Valley/Greenway Parks preserve contiguous natural areas for riparian habitat, water quality protection, and environmental corridors (or greenways). This type of park is often located within floodplains. Trails usually provide access and travel routes through stream valley parks. These parks serve all county residents as well as visitors and provide a range of educational experiences. The Preferred Alternative would require the use of land from the following five park or recreational properties: Wakefield Park, Fitzhugh Park, Accotink Stream Valley Park, Jefferson District Park, and the Washington and Old Dominion (W&OD) Railroad Regional Park. These parks are described in more detail in the following sections. 8-10
315 Section 4(f) Evaluation Capital Beltway Study Wakefield Park Size and Location. Wakefield Park is a acre park located at 8100 Braddock Road. The park is bounded by Little River Turnpike, the Beltway, Braddock Road, and residential properties off of Wakefield Chapel Road. Relationship to Proposed Action. Figure 8-1a shows the location of Wakefield Park in relation to the Capital Beltway. Figure 8-2 illustrates the park and how it would be affected by the proposed project. The existing highway rights-of-way for Little River Turnpike, the Beltway, and Braddock Road comprise the northern, eastern, and southern boundaries of the park, respectively. The nearest existing Beltway lane is within 6 feet of the park boundary. None of the park facilities would be displaced by the Preferred Alternative. Ownership and Type of Property. Wakefield Park is a public park owned by the Fairfax County Park Authority. Function. This is a multiple resource park providing a variety of recreational opportunities in natural settings and developed facilities for individuals and large groups. The Fairfax County Park Authority estimates that approximately 340,000 people used Wakefield Park in 1998 (at facilities where registration or payment is required). Facilities. Facilities at Wakefield Park include: four ball diamonds, two multi-use fields, two basketball courts, two tennis courts, 10 horseshoe pits, 16 shuffleboard courts, 28 garden plots, several trails (hiking/biking, fitness), natural areas (wooded), open space, picnic areas, playgrounds, outdoor concession stand, restrooms, and recreation center. The recreation center contains an indoor swimming pool, sun deck, sauna, meeting rooms, fitness equipment, racquetball courts, squash courts, and a gymnasium. A maintenance building is located near the park entrance and a recycling drop-off area is located at the north end of the recreation center s parking lot. Planned facilities include a community center, amphitheater, picnic area with restrooms, additional playgrounds, archery area, winter sports area, another multi-use court, and additional parking for approximately 300 cars. Access. Vehicular and pedestrian access is provided via Braddock Road and a park service road. Additional pedestrian access to and from the east side of the Beltway (in the vicinity of Americana Drive) is provided by an enclosed overpass just north of Herkimer Street. Relationship to Similarly Used Lands. Other multiple resource parks along the project corridor are Lake Accotink Park and Jefferson District Park. Applicable Clauses Affecting Ownership. There are no recorded reversionary clauses affecting ownership. Fairfax County funds were used to purchase Wakefield Park. No LWCF monies were used to acquire or develop the park. Unusual Characteristics. Wakefield Park has no unusual characteristics. 8-11


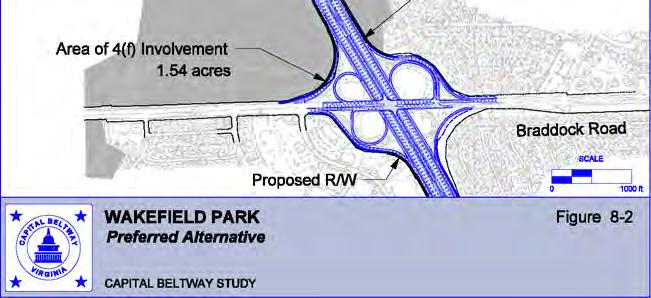
316 Capital Beltway Study Chapter
317 Section 4(f) Evaluation Capital Beltway Study Fitzhugh Park Size and Location. Fitzhugh Park is a acre park located at 4966 Americana Drive. The park is bounded on the west by the Inner Loop of the Beltway, on the north by Americana Drive, and on the east and south by residential properties on Killebrew Drive and Kalorama Road. Relationship to Proposed Action. Figure 8-1a shows the location of Fitzhugh Park in relation to the Capital Beltway. Figure 8-3 illustrates the park and how it would be affected by the build alternatives. The existing Beltway right-of-way forms the western boundary of the park. The nearest existing Beltway lane is within 74 feet of the park boundary, within 123 feet of the hiking trail and multi-use court. No facilities would be displaced by the Preferred Alternative. Ownership and Type of Property. Fitzhugh Park is a public park owned by the Fairfax County Park Authority. Function. This neighborhood park provides passive recreational use for local residents. The service area for this type of park typically includes residences within a 0.5-mile radius of the park boundary. The Fairfax County Park Authority does not collect usage statistics for Fitzhugh Park. Facilities. Fitzhugh Park is predominantly wooded, with an open area near Americana Drive. Existing facilities include a multi-use/basketball court, playground, tot lot, and trail for hiking, biking, and jogging. No additional facilities are planned. Access. Pedestrian access is provided via Americana Drive and Kalorama Road. There is no vehicular access into the park. Vehicle parking is available on local streets. Relationship to Similarly Used Lands. Public parks that offer similar facilities within one mile of Fitzhugh Park include Ossian Hall Park, Flag Run Park, Lake Accotink Park, Wakefield Park, and Oak Hill Park. Applicable Clauses Affecting Ownership. There are no recorded reversionary clauses affecting ownership. Fairfax County funds were used to purchase Fitzhugh Park. No LWCF monies were used to acquire or develop the park. Unusual Characteristics. Fitzhugh Park has no unusual characteristics. 8-13


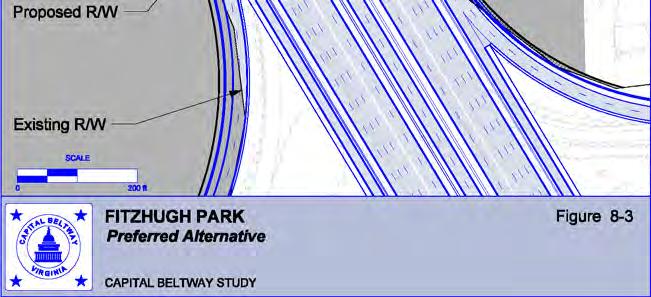
318 Capital Beltway Study Chapter
319 Section 4(f) Evaluation Capital Beltway Study Accotink Stream Valley Park Size and location. Accotink Stream Valley Park is a acre park located along Accotink Creek. The park is a collection of unconnected parklands that extend along Accotink Creek through Fairfax County between the City of Fairfax and the Potomac River. Only a small portion of the park is located near the Beltway (62.75 acres). The trails in the Accotink Stream Valley Park provide a critical link in the routing of the 34-mile Cross County Trail which will eventually connect the northern and southern reaches of the county for non-motorized travel. Relationship to Proposed Action. Figure 8-1a shows the location of Accotink Stream Valley park in relation to the Capital Beltway. Figure 8-4 is a detailed map of the park showing how the Preferred Alternative would affect it. The existing Beltway right-of-way forms the eastern boundary of the park. The nearest existing Beltway lane adjacent to the park is within 46.5 feet of the park boundary. No recreational facilities in this park would be displaced by the Preferred Alternative. Ownership and Type of Property. Accotink Stream Valley Park is a public park owned by the Fairfax County Park Authority. Function. This stream valley park provides primarily passive recreation for local residents. The service area for this type of park typically includes the entire county. The Fairfax County Park Authority does not collect usage statistics for Accotink Stream Valley Park. Facilities. The park has an unpaved trail that parallels Accotink Creek. There are no plans for adding facilities to Accotink Stream Valley Park, other than to continue the trail along the creek as additional parcels are purchased. Access. Pedestrian access to the park is provided via a trail along Accotink Creek. The nearest trailhead is at King Arthur Road, nearly two-thirds of a mile (one kilometer) from the Beltway. There is no vehicle access into Accotink Stream Valley Park within the project area. Relationship to Similarly Used Lands. Other parks with similar facilities within one mile of Accotink Stream Valley Park include: Annandale Community Park, Americana Park, and Wakefield Park. The trail along Accotink Creek connects to trails running through Americana, Wakefield, and Lake Accotink parks. Applicable Clauses Affecting Ownership. There are no recorded reversionary clauses affecting ownership. Fairfax County funds were used to purchase Accotink Stream Valley Park. No Land and Water Conservation Fund (LWCF) monies were used to acquire or develop the park. Unusual Characteristics. Accotink Stream Valley Park has no unusual characteristics. 8-15


320 Capital Beltway Study Chapter
321 Section 4(f) Evaluation Capital Beltway Study Jefferson District Park Jefferson District Park (24.6-hectare) park located at 7900 Lee Highway. The park is bounded by Lee Highway on the south, the Beltway on the west, the Oldewood and Holly Crest neighborhoods on the north, and the Pinewood Greens neighborhood on the east. Shreve Road divides the southwest corner of the park, and the existing highway rights-ofway for the Beltway, Shreve Road, and Lee Highway abut the park. Relationship to Proposed Action. Figure 8-1b shows the location of Jefferson District Park in relation to the Capital Beltway. Figure 8-5 illustrates the park and how it would be affected by the proposed project. The closest existing highway lanes on the Beltway are approximately 65 feet (20 meters) from the park. No park facilities would be displaced by the Preferred Alternative. Ownership and Type of Property. Jefferson District Park is a public park owned by the Fairfax County Park Authority. Function. This multiple resource park provides a variety of recreational opportunities in a natural setting and at developed outdoor facilities for individuals and groups. Jefferson District Park serves all county residents and visitors. The Fairfax County Park Authority estimates that 115,000 people used the golf facilities in Facilities. Facilities include 2 multi-use courts, 12 tennis courts, a 9-hole golf course, a mini-golf course, a clubhouse, a concession stand, 2 parking lots, and a maintenance area. The Fairfax County Park Authority plans future construction of a games area with a shelter. Access. Vehicle and pedestrian access is provided to Jefferson District Park via Hyson Lane. Relationship to Similarly Used Lands. Other multiple resource parks along the project corridor include Lake Accotink Park and Wakefield Park. Similar facilities are offered at Pine Spring Park and Idylwood Park, which are located within 1 mile of Jefferson District Park. No other golf courses are located nearby. Applicable Clauses Affecting Ownership. There are no recorded reversionary clauses affecting ownership. Fairfax County funds were used to purchase Jefferson District Park. No LWCF monies were used to acquire or develop the park. Unusual Characteristics. Jefferson District Park has no unusual characteristics. 8-17


322 Capital Beltway Study Chapter
323 Section 4(f) Evaluation Capital Beltway Study W&OD Railroad Regional Park Size and Location. Washington and Old Dominion (W&OD) Railroad Regional Park is a linear park extending 45 miles from I-395 in Arlington County to Purcellville in Loudoun County. It is approximately 100 feet wide, encompasses acres, and crosses the Beltway just north of the I-66 interchange. Part of the park next to the Beltway was a replacement parcel for earlier park impacts elsewhere. Relationship to Proposed Action. Figure 8-1c shows the location of W&OD Park in relation to the Beltway. Figures 8-6 shows how W&OD Park would be affected by the build alternatives. The Preferred Alternative would require replacement of bridges carrying the trail over the Beltway. Ownership and Type of Property. W&OD Park is a public park owned by the Northern Virginia Regional Park Authority. The park also is an historic property eligible for the National Register of Historic Places. Function. The W&OD trail within the park is a National Recreation Trail and is on the Department of Interior s national register of trails. The trail connects a series of parks (e.g., North Side Park, Idylwood Park, and East Falls Church Park). The park serves the residents of Northern Virginia in urban areas inside the Beltway and suburban and more rural areas outside the Beltway. Usage statistics indicate that 2 million people per year use the trail. Facilities. Facilities include a multi-use paved trail used for hiking, running, biking, and other activities, and a 30.5-mile gravel bridle path for horseback riding and hiking that runs between Vienna and Purcellville. The park includes a number of overpasses to allow users to safely cross highways. Near the Beltway, the W&OD trail crosses Interstate 66 on the Virginia Lane overpass and the Beltway on a bridge between the Interstate 66 interchange and the Idylwood Road overpass. Access. Pedestrian, bicycle, and equestrian access is provided at various places along the length of the trail. Near the Beltway, a parking lot is provided at Idylwood Park. Relationship to Similarly Used Lands. Similar multi-use trails include trails in Wakefield Park and the Potomac Heritage Trail. Applicable Clauses Affecting Ownership. W&OD Park was developed with LWCF monies. Any conversion of lands within the park to highway right-of-way is subject to approval by the U.S. Department of Interior National Park Service under Section 6(f) of the LWCFA. Unusual Characteristics. W&OD Park is a long linear park only about 100 feet wide running for approximately 45 miles. It also is an historic district eligible for the National Register of Historic Places. However, the bridges carrying the park s trail across the Beltway are not contributing resources to the historic district. 8-19


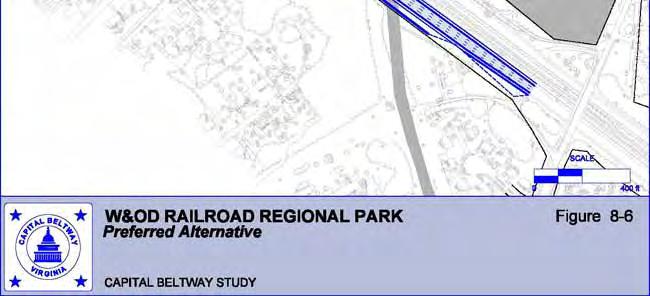
324 Capital Beltway Study Chapter
325 Section 4(f) Evaluation Capital Beltway Study 8.4 IMPACTS TO SECTION 4(f) PROPERTIES The No-Build Alternative would avoid all Section 4(f) involvements. However, this alternative would not meet the identified transportation needs. The Preferred Alternative would require the use of small amounts of land from five parks and recreation areas, as shown in Table 8-3. The parks listed in Table 8-3 are those that are directly affected by the Preferred Alternative or the Candidate Build Alternatives studied in the Draft EIS. In some cases, other proximity effects to Section 4(f) resources, such as increased noise levels or changes in visual quality would occur, but would not result in substantial impairment of the use of any of the Section 4(f) resources. As appropriate these effects are also described below. After publication of the Draft EIS, the proposed cross sections of the mainline and the ramps of all interchanges were minimized to the extent feasible in an effort to reduce and eliminate impacts to private property, commercial land, and parkland and to reduce construction costs. The Preferred Alternative would have far fewer impacts to Section 4(f) properties than the Candidate Build Alternatives studied in the Draft EIS (See Table 8-3). Under the Preferred Alternative, the impacts to Flag Run Park, Stenwood Elementary School, Lisle Park, and the Holmes Run Acres Historic District were eliminated. However due to land procurements since the publication of the Draft EIS, use of one additional park, Accotink Stream Valley Park, would occur. The following describes the Section 4(f) resources that will be impacted or used by the Preferred Alternative Wakefield Park The Preferred Alternative would use 1.54 acres of land along the east and south sides of Wakefield Park. The use of land in the park would consist of very narrow strips along the interchange with Braddock Road and along the mainline of the Beltway. This area of Wakefield park is not used for active recreation. The park service roadways impacted by the Candidate Build Alternatives studied in the Draft EIS are no longer affected. Minor changes in noise levels and visual quality would also occur. None of these proximity impacts would be substantial enough to impair the use of this resource. There are no anticipated impacts to park access or available park activities during construction Fitzhugh Park The Preferred Alternative would use 0.48 acres of land along the west side of the park. The use of land in this park would be in a wooded edge along the western edge of the park. This area is not actively used for recreation. The basketball fields impacted by the Candidate Build Alternatives studied in the Draft EIS are no longer affected. Noise impacts are predicted to occur under all alternatives studied, including the No-Build Alternative. Minor changes in noise levels and visual quality would also occur. None of these proximity impacts would be substantial enough to impair the use of this resource. There are no anticipated impacts to park access or available park activities during construction. 8-21
326 Capital Beltway Study Chapter 8 Table 8-3 SUMMARY OF IMPACTS TO SECTION 4(f) PROPERTEIS Name of Section 4(f) Property Final EIS Alternatives No-Build Preferred Alternative 12-Lane HOT Revised Alternative 10-Lane HOV Candidate Build Alternatives Draft EIS Concurrent HOV Express/ Local with HOV Barrier- Separated HOV Flag Run Park 8.66 acres Right-of-Way Requirement Loss of Park Functions No No No No No No Activity Areas Exposed to Noise Impact 2 No No No No No No Wakefield Park acres Right-of-Way Requirement Loss of Park Functions No No No No No No Activity Areas Exposed to Noise Impact 2 Yes Yes Yes Yes Yes Yes Fitzhugh Park acres Right-of-Way Requirement Loss of Park Functions No No No Yes Yes Yes Activity Areas Exposed to Noise Impact 2 Yes Yes Yes Yes Yes Yes Accotink Stream Valley Park acres Right-of-Way Requirement NA 3 NA 3 NA 3 Loss of Park Functions No No No No No No Activity Areas Exposed to Noise Impact 2 No No No No No No Jefferson District Park 60.8 acres Right-of-Way Requirement Loss of Park Functions No No No No No No Activity Areas Exposed to Noise Impact 2 No No No No No No Stenwood Elementary School 5.18 acres Right-of-Way Requirement Loss of Park Functions No No No Yes Yes Yes Activity Areas Exposed to Noise Impact 2 Yes Yes Yes Yes Yes Yes 8-22
327 Section 4(f) Evaluation Capital Beltway Study Table 8-3 SUMMARY OF IMPACTS TO SECTION 4(f) PROPERTEIS Name of Section 4(f) Property Final EIS Alternatives No-Build Preferred Alternative 12-Lane HOT Revised Alternative 10-Lane HOV Candidate Build Alternatives Draft EIS Concurrent HOV Express/ Local with HOV Barrier- Separated HOV Washington & Old Dominion Railroad Regional Park 545 acres Right-of-Way Requirement Loss of Park Functions No No No No No No Activity Areas Exposed to Noise Impact 2 Yes Yes Yes Yes Yes Yes Lisle Park 0.97 acres Right-of-Way Requirement Loss of Park Functions No No No No No No Activity Areas Exposed to Noise Impact 2 Yes N/A 4 N/A 4 Yes Yes Yes Holmes Run Acres Historic District acres Right-of-Way Requirement ) Historic Resources Affected No No No Yes Yes Yes Activity Areas Exposed to Noise Impact 2 No No No No No No Total Section 4(f) Impact Right-of-Way Requirement Loss of Park Functions Impacted Parks with Areas Exposed to Noise Impact Historic Resources Affected Notes: 1. Impacts are given in acres. 2. Noise impacts in activity areas are defined as exposure to noise levels greater than 66 dba. 3. Impacts to Accotink Stream Valley Park from the Candidate Build Alternatives studied in the Draft EIS were not calculated because the no impacts to the park occurred at that time. Additional lands were purchased by the Fairfax County Park Authority in 2004 to expand the park. These new lands would be impacted by the Preferred Alternative. 4. Noise impacts were not measured at Lisle Park because it is outside the study area for the Preferred and Revised 10-Lane HOV alternatives Accotink Stream Valley Park The Preferred Alternative would use 0.30 acres of land along the east side of the Accotink Stream Valley Park. This impact was not reported in the Draft EIS, because the land 8-23
328 Capital Beltway Study Chapter 8 affected was purchased by the Fairfax County Park authority in July of 2004, after the Draft EIS was published. The area affected is a long sliver of land that is immediately adjacent to the Route 236 westbound exit ramp. The area is not used for active recreation and is well away from the trail along Accotink Creek. Minor changes in noise levels and visual quality would also occur. None of these proximity impacts would be substantial enough to impair the use of this resource. There are no anticipated impacts to park access or available park activities during construction Jefferson District Park The Preferred Alternative would use 0.11 acres of land from a disjunct portion of Jefferson District Park lying between the Beltway and Shreve Road. The parcel of park land used by the Preferred Alternative has no recreational facilities or activities on it. Minor changes in noise levels and visual quality would occur. None of these proximity impacts would be substantial enough to impair the use of this resource. There are no anticipated impacts to park access or available park activities during construction W&OD Railroad Regional Park The Preferred Alternative would use 0.07 acres of land from W&OD Park. The park land used primarily involves the trail passing through the Beltway/I-66 interchange and a contiguous parcel abutting the south side of the trail and the west side of the Beltway. The Preferred Alternative includes a replacement for the bridges used to carry the trail over the Beltway and I-66. Minor changes in noise levels and visual quality would occur. None of these proximity impacts would be substantial enough to impair the use of this resource. The W&OD Railroad Regional Park was developed in stages with money from the Land and Water Conservation Fund Act. Therefore, the park is afforded additional protection under Section 6(f) of the act. Under the Preferred Alternative, conversion of Section 6(f) land would occur. Construction of replacement bridges will be complete before existing bridges carrying the trail are removed. There should be no impact to trail usage during this construction period. A land-swap at the location of the existing bridges will be conducted to replace the Section 6(f) properties used for the new bridges carrying the trail. Coordination activities initiated during the NEPA phase will be concluded during the design phase (see Section 8.6). 8.5 AVOIDANCE ALTERNATIVES AND MEASURES TO MINIMIZE HARM The No-Build Alternative would avoid all Section 4(f) involvements. However, this alternative would not meet the identified transportation needs. A build alternative that would avoid all Section 4(f) involvements would require relocation of the Beltway alignment to go around parks where they lie on both sides of the Beltway. For example, as shown on Figure 8-1a, to avoid any encroachment on both Wakefield Park 8-24
329 Section 4(f) Evaluation Capital Beltway Study and Fitzhugh Park would require shifting the Beltway to the east of Fitzhugh Park. Inspection of the graphic readily shows that such an alternative would be massively disruptive to the communities between Fitzhugh Park and Ravensworth Road. Similarly, the long, linear nature of W&OD Park (stretching 45 miles from Arlington to Purceville) makes it impossible to go around it and still keep the Beltway within the study area. Design alternatives have been considered to avoid Section 4(f) involvements where they occur on only one side of the Beltway, and to minimize the involvements where they occur on both sides of the Beltway. Depending on the location of the Section 4(f) resource, these design alternatives include minor shifts of portions of alignments, design features or modifications to reduce the cross section of the road, changes to the lane or ramp configurations, and alternative interchange concepts. Measures to minimize harm include the same kinds of minor shifts in the roadway alignment and special design features, such as retaining walls and noise barriers. The following sections describe the avoidance alternatives and minimization measures considered for each Section 4(f) involvement associated with the Preferred Alternative Wakefield Park Wakefield Park could be avoided by shifting the Beltway mainline to the east. However, such a shift would cause a comparable (1.5 acre) increase in takings from Fitzhugh Park on the east side of the Beltway (see Section below) and therefore this would not be a complete Section 4(f) avoidance alternative. Moreover, such a shift of the entire Beltway mainline and the Braddock Road Interchange would create major constructability difficulties and maintenance of traffic problems extending over a mile in each direction of the Beltway. Another alternative would be to shorten or move the southbound ramps going to Braddock Road. Shortening the ramps would not allow sufficient distance for proper grades and for deceleration and merging movements. Braddock Road also would need to be shifted south, resulting in 15 additional residential displacements and damages to several businesses. Another alternative would be to further reduce the cross section over what has already been done since publication of the Draft EIS. Further reductions would require substandard elements, such as in the shoulders or the travel lanes, and are not desirable for safety and operational reasons on this type of facility. The encroachment on this property by the Preferred Alternative is the minimum necessary to construct a facility meeting the identified needs within acceptable design tolerances. The land impacted by the project does not contain any park facilities Fitzhugh Park Fitzhugh Park could be avoided by shifting each of the alternatives to the west. However, such a shift would impact approximately one-half acre of another Section 4(f) involvement with Wakefield Park, and therefore this would not be a complete Section 4(f) avoidance alternative (see Section above). As described above, such a shift of the entire Beltway Mainline to the west would create major constructability difficulties and maintenance of traffic problems extending south to the Springfield Interchange and north to the Route 236 Interchange (i.e., tie in points for mainline shifts). Another alternative would be to shorten or move the northbound ramps coming from Braddock Road. Shortening the ramp would 8-25
330 Capital Beltway Study Chapter 8 not allow sufficient distance for proper grades and for acceleration and merging movements. Another alternative would be to further reduce the cross section over what has already been done since publication of the Draft EIS. Further reductions would require substandard elements, such as in the shoulders or the travel lanes, and are not desirable for safety and operational reasons on this type of facility. The encroachment on this property by the Preferred Alternative is the minimum necessary to construct a facility meeting the identified needs within acceptable design tolerances. The land impacted by the project does not contain park facilities Accotink Stream Valley Park To avoid Accotink Stream Valley Park, the Capital Beltway mainline and the ramps associated with the Route 236 (Little River Turnpike) interchange would need to be shifted to the east. This shift would require the relocation of approximately three to four power line towers within the Virginia Power easement long the edge of the Beltway s Inner Loop (estimated relocation costs at $1 million each). The shift would also move the ramps located in the northeast quadrant of the interchange and require the use of lands within the previously undisturbed Annandale Community Park (estimated at 0.2 acres which is comparable to the impact to the Accotink Stream Valley Park. Lastly, the mainline shift would entail major constructability and maintenance of traffic problems that are not created by the Preferred Alternative. Another possibility would be to further reduce the width of the cross section in this area over what was done after completion of the Draft EIS. However the cross section of the mainlines in this area are at their minimum width for each of the mainline types and a reduction in their overall widths would require substandard elements such as in the shoulders or the travel lanes. This sort of change would not be acceptable for safety and operational reasons on this type of facility. The encroachment caused by the Preferred Alternative on this property is the minimum necessary to construct a facility meeting the identified needs within acceptable design tolerances Jefferson District Park To avoid the small isolated section of the Jefferson District Park, the Capital Beltway mainline would need to be shifted to the west. This would increase the impact to commercial areas on the west side of the Beltway, resulting in additional project costs of approximately $41.5 million and annual county property tax revenue losses of more than $200,000. Similar to other avoidance alternatives described above, such a shift of the Beltway mainline would entail major constructability issues by affecting the entire segment between Route 50 and I-66 interchanges, as well as causing significant maintenance of traffic problems for this same segment and beyond. Another possibility would be to reduce the width of the cross section in this area. However the cross section of the mainlines in this area are at their minimum width for each of the mainline types and a reduction in their overall widths would require substandard elements such as in the shoulders or the travel lanes. This sort of change would not be acceptable for safety and operational reasons on this type of facility. It should be noted that following the publication of the Draft EIS, the proposed cross sections of the mainline and the ramps of all interchanges were minimized to the extent feasible. 8-26
331 Section 4(f) Evaluation Capital Beltway Study The encroachment on this property is the minimum necessary to construct a facility meeting the identified needs within acceptable design tolerances. The encroachment involves a disjunct portion of the property that is not actively used for recreation W&OD Railroad Regional Park Due to of the long linear nature of this park (extending 45 miles from Arlington to Purceville) and the fixed location of the Capital Beltway of which it crosses, it is impossible to avoid use of this Section 4(f) property. The Preferred Alternative includes replacing the bridges carrying the trail over the Beltway and I-66, thereby preserving the functionality of the trail facility. 8.6 COORDINATION The National Park Service, Northern Virginia Regional Park Authority, Virginia Department of Recreation and Conservation, Fairfax County Park Authority, and Fairfax County School Board were consulted regarding the potential impacts to parks and recreational facilities. Agency comments and committed actions are summarized below. During early coordination efforts, the National Park Service and Northern Virginia Regional Park Authority noted that the W&OD Park was acquired and developed with assistance from the federal Land & Water Conservation Fund (LWCF). In addition, the Regional Park Authority also owns a parcel of land adjacent to the southwest quadrant of the intersection of the W&OD Trail and the Beltway. This 2.8-acre parcel is replacement land that was approved for a previous road crossing project across the W&OD. As noted in the previous section, the Preferred Alternative will replace the bridges carrying the Trail across I-66 and the Beltway. In order to do so will require the use of 0.07 acres of parkland. This conveyance of park land will constitute a conversion of use under Section 6(f) of the LWCF Act. Following issuance of FHWA s Record of Decision, VDOT will resume conversion coordination with the National Park Service, Virginia Department of Recreation and Conservation and the Regional Park Authority. Previous discussions noted that the existing bridge that carries the W&OD Trail over the Beltway does not meet Park Authority s current standards for width. New designs will ensure a much improved crossing as well as provide continued access and appropriate maintenance of traffic during and after construction. The Virginia Department of Conservation and Recreation s Division of Planning and Recreation Resources stated that the proposed project is not anticipated to have any adverse impacts on existing or planned recreational facilities, nor will it impact any streams on the National Park Service Nationwide Inventory, Final List of Rivers, potential Scenic Rivers, or existing or potential State Scenic Byways. The Fairfax County Park Authority requested and received an opportunity to review and comment on the Draft EIS. The Fairfax County School Board provided information on the programmed activities occurring on school properties in the project area. 8-27
332 Capital Beltway Study Chapter 8 A copy of the / Section 4(f) Evaluation will be provided to each of these coordinating agencies. 8.7 CONCULSION Based on the discussions above there are no prudent and feasible alternatives which avoid the use of Section 4(f) properties. Design adjustments have been made to minimize the acreage of Section 4(f) property required for the Preferred Alternative and further measures to minimize harm will be developed in the project s final design. Coordination of all mitigations will continue with the National Park Service, Virginia Department of Conservation and Recreation, Northern Virginia Regional Park Authority, and the Fairfax County Park Authority. Based on the final Section 4(f) Evaluation including consideration of the project s stated purpose and need, the Preferred Alternative has been identified as the most feasible and prudent alternative that fully satisfies the project s purpose and needs. All possible planning measures have been incorporated into the proposed project to minimize impacts to Section 4(f) resources. 8-28
333 REFERENCES GENERAL 42 USC 4321 et seq. National Environmental Policy Act of 1969, as amended. 40 CFR Parts Regulations for Implementing the Procedural Provisions of the National Environmental Policy Act. Council on Environmental Quality. 23 CFR Part 771. Environmental Impact and Related Procedures. Federal Highway Administration. ADC of Alexandria, Inc. Northern Virginia Map Book. 41 st Edition Council on Environmental Quality. Questions and Answers About NEPA Regulations. March Federal Highway Administration. Guidance for Preparing and Processing Environmental and Section 4(f) Documents. Technical Advisory T6640.8A. October 30, Virginia Department of Transportation. VDOT Environmental Document Handbook. Second Edition. February TRAFFIC AND TRANSPORTATION Capital Beltway Safety Team. Capital Beltway Safety Update. September 29, Fairfax County Map Series. Fairfax County Transportation Plan (4000 scale) Fairfax County Map Series. Trails Plan (4000 scale) Fairfax County Office of Comprehensive Planning. Fairfax Plan Monitoring. Transportation Characteristics: Existing Conditions and Trends Report. July Federal Highway Administration. Travel Behavior Issues in the 90's. July Granat, Diane. Traffic Busters. Washingtonian. September Greater Washington Board of Trade. Transportation Study 1997, Executive Summary. October Greater Washington Board of Trade. Transportation Study 1997, Report 1. History and Current Conditions. February Greater Washington Board of Trade. Transportation Study 1997, Report 2. Regional Forecasts and CLRP Adequacy Assessment. March R-1
334 Capital Beltway Study References Greater Washington Board of Trade. Transportation Study 1997, Report 3. Economic and Quality of Life Costs of Not Meeting Transportation Needs. April Greater Washington Board of Trade. Transportation Study 1997, Report 4. Highway and Transit Solutions. June Greater Washington Board of Trade. Transportation Study 1997, Report 5. What Better Transportation Will Cost and How to Pay for It. October Metropolitan Washington Council of Governments Count of Heavy Truck Traffic on the Capital Beltway and Other Major Highways in the Washington Region. May Metropolitan Washington Council of Governments COG/TPB Household Travel Surveys: Summary of Major Findings. January Metropolitan Washington Council of Governments Suburban Employment Center Cordon Count of Vehicular and Passenger Volumes. April Metropolitan Washington Council of Governments Beltway Cordon Count of Vehicular and Passenger Volumes. April Metropolitan Washington Council of Governments Performance of Regional High- Occupancy Vehicle Facilities on Interstate Highways in the Washington Region. May 20, Metropolitan Washington Council of Governments. Air Cargo Element of the Washington- Baltimore Regional Airport System Plan. February Metropolitan Washington Council of Governments. Analysis of Reverse Commuting Patterns. June Metropolitan Washington Council of Governments. Bicycle Cordon Counts. December Metropolitan Washington Council of Governments. Round 6a Cooperative Forecasts of Population, Household, and Employment for Metropolitan Washington. April 8, Metropolitan Washington Council of Governments. Survey of Morning Peak Hour Bicyclists in the Metropolitan Washington Area. December Metropolitan Washington Council of Governments. The Potential for Circumferential Transit in the Washington Metropolitan Region. August Metropolitan Washington Council of Governments. Traffic Quality on the Metropolitan Washington Area Limited-Access Highway System. n.d. Metropolitan Washington Council of Governments. Transportation Models and Forecasts. August 25, National Capital Region Transportation Planning Board Update to the Long-Range Plan for the National Capital Region. July National Capital Region Transportation Planning Board Update to the Long-Range Plan for the National Capital Region. July R-2
335 References Capital Beltway Study National Capital Region Transportation Planning Board Update Analysis of Financial Resources for the Constrained Long-Range Plan. November National Capital Region Transportation Planning Board. Long-Range Transportation Plan for the National Capital Region. September 21, National Capital Region Transportation Planning Board. Bicycle Plan for the National Capital Region. July National Capital Region Transportation Planning Board. A Citizen Guide to Transportation Planning in the National Capital Region. December National Capital Region Transportation Planning Board. The Region: Addressing Our Transportation Challenges. Volume 36. Fall National Capital Region Transportation Planning Board. The Region: Shaping Transportation Solutions. Volume National Capital Region Transportation Planning Board. Transportation Improvement Program for the Washington Metropolitan Region, FY November 11, National Capital Region Transportation Planning Board. Transportation Improvement Program for the Washington Metropolitan Region, FY May 8, National Capital Region Transportation Planning Board. Transportation Vision Plan. November 19, National Highway Traffic Safety Administration. Analysis of Capital Beltway Crashes: Years December National Highway Traffic Safety Administration. Capital Beltway Update: Beltway User Focus Groups. April, National Research Council. Transportation Research Board. Special Report 209: Highway Capacity Manual Northern Virginia Transportation Commission. Northern Virginia Annual Transportation Update. October Texas Transportation Institute. Urban Roadway Congestion Annual Report November Transportation Coordinating Council of Northern Virginia. Northern Virginia 2020 Transportation Plan: Summary. December Transportation Coordinating Council of Northern Virginia. Northern Virginia 2020 Transportation Plan: Technical Report. December Transportation Coordinating Council of Northern Virginia. Study of Surface Transportation Planning and Organization. December 14, Van Dyne, Larry. Getting There. Washingtonian. May R-3
336 Capital Beltway Study References Virginia Commonwealth Transportation Board. Six-Year Improvement Program: Fiscal Year July Virginia Department of Transportation. Average Daily Traffic Volumes with Vehicle Classification Data on Interstate, Arterial, and Primary Routes Virginia Department of Transportation. Capital Beltway (I-95/I-495) Improvement Study: Phase I Final Report. April Virginia Department of Transportation. Capital Beltway Study: Final Long-Term Recommendations Report. August Virginia Department of Transportation. Capital Beltway Study: Short Term and Mid-Term Recommendations Report. August Virginia Department of Transportation. Capital Beltway Major Investment Study: Model Calibration Report. July Virginia Department of Transportation. Capital Beltway Major Investment Study: Phase I Results Report. January LAND USE Fairfax County Map Series. Comprehensive Land Use Plan (2000 scale). June 26, Fairfax County Map Series. Comprehensive Land Use Plan (4000 scale). June 26, Fairfax County Map Series. Fairfax County Real Property Identification Maps: Official Zoning. February Fairfax County Map Series. Office and Industrial Zoning (4000 scale) Fairfax County Office of Comprehensive Planning. Policy Plan: The County-wide Policy Element of the Comprehensive Plan for Fairfax County, Virginia. August Fairfax County Office of Comprehensive Planning. Concept for Future Development and Land Classification System. August 6, Fairfax County Office of Comprehensive Planning. The Comprehensive Plan for Fairfax County, Virginia: Area I. January Fairfax County Office of Comprehensive Planning. The Comprehensive Plan for Fairfax County, Virginia: Area II. January Fairfax County Office of Comprehensive Planning. The Comprehensive Plan for Fairfax County, Virginia: Area III. February Fairfax County Office of Comprehensive Planning. The Comprehensive Plan for Fairfax County, Virginia: Area IV. February Fairfax County Office of Comprehensive Planning. Fairfax Plan Monitoring. State of The Plan. March Fairfax County Office of Transportation. Tysons Corner Urban Center Study: Preferred Concept Analysis. November R-4
337 References Capital Beltway Study National Capital Planning Commission. Extending the Legacy, Planning America s Capital for the 21st Century. n.d. National Capital Planning Commission. Internet Fact Sheet: NCPC s Mission and Responsibilities. Comprehensive Plan for the National Capital. September SOCIOECONOMICS Executive Order Federal Actions to Address Environmental Justice in Minority Populations and Low Income Populations. Washington, D.C., Fairfax County Economic Development Authority. Real Estate Report: Year-end Fairfax County Economic Development Authority. Real Estate Report: Year-end Fairfax County Economic Development Authority. Internet Fact Sheets: Demographics, Economy, and Market Descriptions. November Fairfax County Economic Development Authority. Fairfax County, Virginia Profile. May Fairfax County Map Series. Public Facilities (4000 scale) Fairfax County Office of Management and Budget Fairfax County Household Survey Fairfax County Office of Management and Budget Household Survey Highlights. December Fairfax County Office of Management and Budget Demographics Estimates and Forecasts Fairfax County Office of Comprehensive Planning. Fairfax Plan Monitoring. Public Facilities and Services: Existing Conditions and Trends Report. July Fairfax County Office of Comprehensive Planning. Fairfax Plan Monitoring. Socio- Economic Characteristics. Existing Conditions And Trends Report. July Metropolitan Washington Council of Governments. Commercial Construction Indicators: 1997 Annual Summary. June Metropolitan Washington Council of Governments. Economic Trends in Metropolitan Washington July 8, Metropolitan Washington Council of Governments. Round 6a Cooperative Forecasts of Population, Household, and Employment for Metropolitan Washington. April 8, Northern Virginia Planning District Commission. Northern Virginia Data Book Times Community Newspapers. Total Guide to Fairfax County R-5
338 Capital Beltway Study References U.S. Department of Commerce, Bureau of the Census Census of Population and Housing, Summary Tape File 1A. Washington, D.C., May U.S. Department of Commerce, Bureau of the Census Census of Population and Housing, Summary Tape File 3A. Washington, D.C., May NATURAL ENVIRONMENT Ator, S., J. Blomquist, J. Brakebill, J. Denis, M. Ferrari, C. Miller and H. Zappia. Water Quality in the Potomac River Basin, Maryland, Pennsylvania, Virginia and the District of Columbia. U.S. Geological Survey Circular 1166, Reston, Va. 38 p Barbour, M., J. Gerritson, B. Snyder and J, Stribling. Rapid Bioassessment Protocols for Use in Streams and Wadeable Rivers: Periphyton, Benthic Invertebrates and Fish, Second Edition. EPA Report 841-B , US EPA, Office of Water, Washington, DC. Bellows, A. S. and J. Mitchell. Small Mammal Communities in Riparian and Upland Habitats on the Upper Coastal Plain of Virginia. Va. J. Sci. 51(3): Belval, D. and L. Sprague. Monitoring Nutrients in the Major Rivers Draining to Chesapeake Bay. USGS Water Resources Inv. Report , Reston, Va. 15 pages, Berlinghoff, L. Letter to Capital Beltway Study Manager, Agency Coordination Appendix, Log Entry 8, August 10, Blake, J. and J. Karr. Species Composition of Bird Communities and the Conservation Benefit of Large Versus Small Forests. Biological Conservation 30: , Boward, D.M., P. Kazyak, S. Stranko, M. Hurd, and T. Prochaska. From the Mountains to the Sea: The State of Maryland s Freshwater Streams. EPA Report 903-R Maryland DNR, Monitoring and Nontidal Assessment Division, Annapolis, MD, Bowman, G. and L. Harris. Effect of Habitat Heterogeneity on Ground Nest Predation. J. of Wildl. Management 44: , Brinson, M., A. Lugo, and S. Brown. Primary Productivity, Decomposition, and Consumer Activity in Freshwater Wetlands. Ann. Rev. Ecol. Systematics 12: Burke, M., B. Lockaby, and W. Conner. Aboveground Production and Nutrient Circulation Along a Flooding Gradient in a South Carolina Coastal Plain Forest. Can. J. For. Res. 29: Burkhead, N. and R. Jenkins. Fishes. pp , In: K. Terwilliger (Coord.). Virginia s Endangered Species, McDonald and Woodward Publishing, Blacksburg, Virginia Bushman, E. and G. Therres. Habitat Management Guidelines for Forest Interior Breeding Birds of Coastal Maryland. Wildlife Technical Publication 88-1, Maryland Department of Natural Resources, Annapolis, 50 pages, Center for Watershed Protection. Better Site Design: An Assessment of the Better Site Design Principles for Communities Implementing Virginia s Chesapeake Bay R-6
339 References Capital Beltway Study Preservation Act, Published for the Chesapeake Bay Local Assistance Board. 89 p Courter III, J. C. Letter to Capital Beltway Study Manager, Agency Coordination Appendix, Log Entry 7, August 4, Drake, A.A. and Froelich, A.J. Geologic Map of the Annandale Quadrangle, Fairfax and Arlington Counties, and Alexandria City, Virginia. U.S. Geological Survey, Geologic Quadrangle Map GQ Drake, A.A. Jr. and Froelich, A.J. Geologic Map of the Falls Church Quadrangle, Fairfax and Arlington Counties and the City of Falls Church, Virginia, and Montgomery County, Maryland. U.S. Geological Survey, Geologic Quadrangle Map GQ Duguay, J., P. Wood, and G. Miller. Effects of Timber Harvest on Invertebrate Biomass and Avian Nest Success. Wildl. Soc. Bull. 28(4): Dunn, C., F. Stearns, G. Guntenspergen and D. Sharpe. Ecological Benefits of the Conservation Reserve Program. Conservation Biology 7(1): Edwards, E.A., Li, H., Schreck, C.B. Habitat Suitability Information: Longnose Dace. (10.33). U.S. Dept. of Interior, U.S. Fish & Wildlife Service: Ernst, C., C. Belfit, S. Sekscienski, and A. Laemmerzahl. The Amphibians and Reptiles of Fort Belvoir and Northern Virginia. Bull. Maryland Herpetol. Soc. 33: 1-62, Ernst, C. and J. McBreen. Wood Turtle: Clemmys insculpta (LeConte). Pages , In: K. Terwilliger (Coord.). Virginia s Endangered Species. McDonald and Woodward Publishing Company, Blacksburg Fairfax County Department of Public Works. Ratings of Soils for Urban Development in Fairfax County. Environmental Services Webpage at: http/: Fairfax County Health Department. Naturally Occurring Asbestos in Fairfax County. Webpage at: http/: a. Fairfax County Health Department. Fairfax County Radon Potential Map. Webpage at: http/: b. Fairfax County Map Series. Fairfax County Real Property Identification Maps: Chesapeake Preservation Areas. March Fairfax County Map Series. Fairfax County Real Property Identification Maps: Soils Map. January Fairfax County Map Series: Watersheds (4000 scale) Fairfax County GIS and Mapping Services. Orange Soils Map. Health Department Webpage at: http//: Fairfax County Office of Comprehensive Planning. Fairfax Plan Monitoring. Environmental Characteristics: Existing Conditions and Trends Report. July R-7
340 Capital Beltway Study References Fairfax County Park Authority. Preliminary Wetland Determination Report, Eakin Community Park and Accotink Stream Valley Park, Fairfax County, Virginia. 10 pages, plus maps, and data sheets. July Fargione, M., P. Curtis, and M. Richmond. Resistance of Woody Ornamental Plants to Deer Damage. Cornell University Publ. 147HGFS800.00, Ithaca, New York, Federal Emergency Management Agency, National Flood Insurance Program. Flood Insurance Rate Map, Fairfax County, Virginia Unincorporated Areas, Panel 50 of 150. March 5, 1990a. Federal Emergency Management Agency, National Flood Insurance Program. Flood Insurance Rate Map, Fairfax County, Virginia Unincorporated Areas, Panel 75 of 150. March 5, 1990b. Federal Emergency Management Agency, National Flood Insurance Program. Flood Insurance Rate Map, Fairfax County, Virginia Unincorporated Areas, Panel 79 of 150. March 5, 1990c. Federal Emergency Management Agency, National Flood Insurance Program. Flood Insurance Rate Map, Fairfax County, Virginia Unincorporated Areas, Panel 83 of 150. March 5, 1990d. Federal Emergency Management Agency, National Flood Insurance Program. Flood Insurance Rate Map, Fairfax County, Virginia Unincorporated Areas, Panel 87 of 150. March 5, 1990e. Federal Emergency Management Agency, National Flood Insurance Program. Flood Insurance Rate Map, Fairfax County, Virginia Unincorporated Areas, Panel 100 of 150. March 5, 1990f. Federal Emergency Management Agency, National Flood Insurance Program. Flood Insurance Rate Map, Fairfax County, Virginia Unincorporated Areas, Panel 150 of 150. March 5, 1990g. Federal Highway Administration. Is Highway Runoff a Serious Problem? FHWA Environmental Technology Brief, Office of Engineering R. & D. McLean, Virginia, 7 pages, Federal Highway Administration. Critter Crossings: Linking Habitats and Reducing Roadkills. Office of Natural Environment, Washington, DC., 31 pages, Fitch, G. M. Nonanadromous Fish Passage in Highway Culverts. Final Report 96-R6, Virginia Transportation Research Council, 18 pages, Foreman, J. M. Letter to Capital Beltway Study Manager, Agency Coordination Appendix, Log Entry 2, August 6, Forman, R. and L. Alexander. Roads and Their Major Ecological Effects. Annu. Rev. Ecol. Syst , Friends of the Rivers of Virginia. State of Ours Rivers Report, Roanoke, Virginia, 24 pages R-8
341 References Capital Beltway Study Froelich, A.J. and Langer, W.H., Maps Showing Geologic Provinces, Landforms, Drainage Basin Characteristics, and Flooding in Fairfax County and Vicinity, Virginia. United States Geological Survey, Miscellaneous Field Investigation Map I Froelich, A.J. and Zenone, C. Maps Showing Geologic Terrain, Drainage Basins, Overburden, and Low Flow of Streams in Fairfax County and Vicinity, Virginia. United States Geological Survey, Miscellaneous Field Investigation Map I Haskell, D. G. A Reevaluation of the Effects of Forest Fragmentation on Rates of Bird-Nest Predation. Conservation Biology 9: , Holsinger, J. Notes on Other Listed Species of Amphipoda in the Family Crangonyctadae. Pages , In: K. Terwilliger (Coord.). Virginia s Endangered Species. McDonald and Woodward Publishing Company, Blacksburg Holsinger, J. Freshwater Amphipod Crustaceans (Order Amphipoda), Pages , In: D. W. Linzey (Ed.). Endangered and Threatened Plants and Animals of Virginia, Virginia Polytechnic Institute and State University, Blacksburg, Virginia Horn, D. J. and R. R. Koford. Relation of Grassland Bird Abundance to Mowing of Conservation Reserve Program Fields in North Dakota. Wildl. Soc. Bull. 28(3): , Horner, R. R. Long-Term Effects of Urban Stormwater on Wetlands. pp , In: L. Roesner, B. Urbonas and M. Sonnen (eds.) Design of Urban Runoff Quality Controls. Proc. Current Practice and Design Criteria for Urban Quality Controls. Am. Soc. Civil Engineers, New York Hurt, W. G. and V. W. Carlisle. Using Hydric Soil Indicators in Disturbed Soils. Page 16, In: R. Spagnolo (ed.) Proceedings of the EPA Wetlands Regulatory Workshop, November 4-6, Atlantic City, New Jersey. Program with abstracts Jenkins, R. and N. Burkhead. Freshwater Fishes of Virginia. American Fisheries Society, Bethesda, Maryland, 1080 pages Karr, J., K. Fausch, P. Angermeier, P. Yant and I. Schlosser. Assessing Biological Integrity in Running Waters: a Method and its Rationale. Special Publication 5, Illinois Natural History Survey, Carbondale, 28 pages Kays, J. S. Damage to Ornamental Plants by White-tailed Deer. Maryland Cooperative Extension Service, Fact Sheet 655, 8 pages, LaClaire, L. and R. Franz. Importance of Isolated Wetlands in Upland Landscapes. Florida Land Management Society Annual Meeting Proceedings, pages 9-15, Lakatos, D. F., and L. J. McNemar. Wetlands and Stormwater Pollution Management. Pages , In: J. Kusler and G. Brooks (eds.) Proceedings of the National Wetland Symposium: Wetland Hydrology. ASWM Technical Report 6, Berne, New York, 339 pages Lee, D., A. Norden, and C. Gilbert. Atlas of North American Freshwater Fishes. North Carolina Museum of Natural History, Raleigh R-9
342 Capital Beltway Study References Loos, J. W. Woolcott, and N. Foster. An Ecologist s Guide to the Minnows of the Freshwater Drainage Systems of the Chesapeake Bay Area. ASB Bulletin 19: Lowrance, R., L. Altier, and J. Newbold. Water Quality Functions of Riparian Forest Buffer Systems in the Chesapeake Bay Watershed. Chesapeake Bay Program Technology Transfer Report, EPA Report 903-r ), Lynch, J. and D. Whigham. Effect of Forest Fragmentation on Breeding Bird Communities in Maryland. Biological Conservation 8: , Magee, T., T. Ernst, M. Kentula, and K. Dwire. Floristic Comparison of Freshwater Wetlands in an Urbanizing Environment. Wetlands 19(3): Martin, A., H. Zim, and A. L. Nelson. American Wildlife and Plants: A Guide to Wildlife Food Habits. McGraw-Hill Books, Inc., New York, 500 pages, McShea, W. and J. Rappole. White-tailed Deer as Keystone Species Within Forest Habitats of Virginia. Va. J. Sci. 43(1B): Merriam, G. Movement in Spatially Divided Populations: Responses to Landscape Structure. In: W. Lidicker, Jr. (Ed.), Landscape Approaches in Mammalian Ecology and Conservation, pages 64-77, Mitchell, J. and J. Pilcicki. The Wood Turtle (Clemmys insculpta), in Eastern Fairfax County, Virginia. Catesbeiana 20(1): 34-38, Otton, J., R. Schumann, D. Owen, N. Thurman and J. Duval. Map Showing Radon Potential of Rocks and Soils in Fairfax County, Va. Misc. Field Inv. Map MF :48,000 scale, Pagels, J., S. Erdle, and K. Uthus. Small Mammal Diversity in Forested and Clearcut Habitats in the Virginia Piedmont. Va. J. Sci. 43(1B): Petrovic, A. The Fate of Nitrogenous Fertilizers Applied to Turfgrass. J. of Env. Quality 19(1): 1-14, Poore, W. Guidance to Determine the Upstream Limit of Waters of the United States, Issued to Norfolk District Project Managers, U. S. Army Corps of Engineers. March 12, 1999a. Poore, W. Regulatory Branch Letter, Regarding Abandoned and Naturalized Stormwater Management Ponds, Norfolk District Branch Chief, U. S. Army Corps of Engineers. September 9, 1999b. Pollack, M. M., R. J. Naiman and T. A. Hanley. Plant Species Richness in Riparian Wetlands: A Test of Biodiversity Theory. Ecology 79(1): Porter, C.H., J.F. Dertling, J.H. Elder, and E.S. Henry. Soil Survey Fairfax County, Virginia. United States Department of Agriculture, Soil Conservation Service, Washington, D.C Rader, E.K. and Evans, N.H., (eds). Geologic Map of Virginia expanded explanation. Virginia Division of Mineral Resources R-10
343 References Capital Beltway Study Ritchie, J. C. Sediment, Fish, and Fish Habitat. J. Soil and Water Conserv. May-June: Robbins, C. Effect of Forest Fragmentation on Bird Populations. General Technical Report NC-51, U. S. Forest Service North Central Forest Experiment Station, St. Paul, Minnesota, Robbins, C. Effect of Forest Fragmentation on Breeding Bird Populations in the Piedmont of the Mid-Atlantic Region. Atlantic Nat. 33(1): 31-36, Robbins, C., D. Dawson, and B. Dowell. Habitat Area Requirements of Breeding Forest Birds in the Middle Atlantic States. Wildlife Monographs 103: 1-34, Robinson, W. L. and E. C. Bolen. Wildlife Ecology and Management. MacMillan Publishing Company, New York Roth, R. Spatial Heterogeneity and Bird Species Diversity. Ecology 57: , Schueler, T. Homeowner Survey Reveal Lawn Management Practices in Virginia. Technical Note 27, Watershed Protection Techniques 1(2): 85-86, Schueler, T. First Flush of Stormwater Pollutants Investigated in Texas. Technical Note 28, Watershed Protection Techniques 1(2): 88-89, Schueler, T. and J. Lugbill. Performance of Current Sediment Control Measures at Maryland Construction Sites. Technical Note 42, Watershed Protection Techniques 1(3): , Schumann, R. and D. Owen. Relationships Between Geology, Equivalent Uranium Concentration, and Radon in Soil Gas, Fairfax County, Va. Open File Report 88-18, 28 p Skogley, C. R. Turfgrass, Golf Courses, and the Environment. URI Turfgrass Research Review 19, 6 pages, Sponenberg, T. D. and J. H. Kahn. A Groundwater Primer for Virginians. Virginia Water Resources Research Center, Blacksburg, Virginia, 22 pages, Trial, J.G., J.G. Stanely, M. Batcheller, G. Gebhart, O.E. Maughan, P.C. Nelson. Habitat Suitability Information: Blacknose dace. (10.41). U.S. Dept. of the Interior & Wildlife Service: Trochlell, P and T. Bernthal. Small Wetlands and the Cumulative Impacts of Small Wetland Losses: A Synopsis of the Literature. Wis. Dept. Nat. Res. Publ. FH226-98, Madison, Wis., U. S. Army Corps of Engineers. The Highway Methodology Workbook Supplement: Wetland Functions and Values, A Descriptive Approach, New England Division, Waltham, MA.,1995. U. S. Department of Agriculture. Field Indicators of Hydric Soils in the Mid-Atlantic United States. Interagency Mid-Atlantic Hydric Soil Committee. U.S. Environmental Protection Agency, 77 p., R-11
344 Capital Beltway Study References U. S. Department of the Army. Memorandum for SEE Distribution: Questions and Answers on 1987 Manual. October 7, U. S. Department of the Army. Memorandum for Clarification and Interpretation of the 1987 Manual, March 6, U.S. Fish and Wildlife Service. National Wetlands Inventory Map: Annandale, Virginia Quadrangle U.S. Fish and Wildlife Service. National Wetlands Inventory Map: Falls Church, Virginia Quadrangle U.S. Fish and Wildlife Service. Letter from W. Hester to Capital Beltway Study Manager, Agency Coordination Appendix, Log Entry 31, September 3, U.S. Geological Survey. Annandale, Virginia Quadrangle Topographic Map. 7.5 Minute Series Revision. 1994a. U. S. Geological Survey. Falls Church, Virginia Quadrangle Topographic Map. 7.5 Minute Series Revision. 1994b. U. S. Geological Survey. Geologic Radon Potential Maps for Counties in the Washington, D.C. Metro Area. USGS webpage at: Usher, M. Effects of Fragmentation on Communities and Populations: A Review with Applications to Wildlife Conservation. In: D. Saunders and others (Eds.), Nature Conservation: the Role of Remnants of Native Vegetation, Surrey Beatty and Sons Publ. Ltd., N.S. W., Australia, pages , Villard, M-A., M. Trzcinski, and G. Merriam. Fragmentation Effects on Forest Birds: Relative Influence of Woodlot Cover and Configuration on Landscape Occupancy. Conservation Biology 13(4): , Virginia Department of Environmental Quality. Virginia Ambient Water Quality Monitoring Report, Monitoring Year, DEQ Technical Bulletin. WQA/ , Water Quality Assessment Division, Richmond, Virginia Whipple, Jr., W. Best Management Practices for Storm Water and Infiltration Control. Water Res. Bull. 27(6): White, R. County Considers Bowhunters to Thin Deer Flock. Fairfax Journal, page A-1, October 9, Wilcove, D. Nest Predation in Forest Tracts and the Decline of Migratory Songbirds. Ecology 66: , Wilson, T. P. Habitat Usage and Spatial Ecology of the Spotted Turtle (Clemmys guttata) in Fairfax County, Virginia. Va. J. Sci. 50(2): 170, Yates, M. D., S. Loeb, and D. C. Guynn, Jr. The Effects of Habitat Patch Size on Small Mammal Populations. Proc. Annu. Conf. Southeast Assoc. Fish and Wildl. Agencies 51: , R-12
345 References Capital Beltway Study Zenone, C. and Larson, J.D. Ground-water Resources of Fairfax County and Vicinity, Virginia, and Some Aspects of Their Development. United States Geological Survey, Miscellaneous Field Investigation Map I PARKLANDS AND RECREATION AREAS 16 U.S.C. 460(I)(8)(f). Section 6(f) of Land and Water Conservation Fund Act of 1965, as amended. 49 U.S.C. 303(c). Section 4(f) of the U.S. Department of Transportation Act of 1966, as amended. 23 CFR Part Environmental Impact and Related Procedures: Section 4(f) (49 U.S.C. 303). Federal Highway Administration. Fairfax County Department of Planning and Zoning. Existing Trails Map. June Fairfax County Department of Planning and Zoning. Countywide Trails Plan Map. June Fairfax County Map Series. Trails Plan (4000 scale). March Fairfax County Office of Planning. Fairfax Plan Monitoring. Parks and Recreation: Existing Conditions and Trends Report. September Fairfax County Park Authority. Register of Parks and Facilities Federal Highway Administration. Section 4(f) Policy Paper. Revised Edition. June 1989 Virginia Department of Transportation. Northern Virginia Regional Bicycle and Trail Network Study. Final Report. November AIR QUALITY 42 U.S.C. 7401: Clean Air Act of 1970, as amended. 40 CFR Part 50: National Primary and Secondary Ambient Air Quality Standards. 40 CFR Parts 80 and 86: Control of Emissions of Hazardous Air Pollutants from Mobile Sources. 40 CFR Part 81: Designation of Areas for Air Quality Planning Purposes. Subpart C, Section 107 Attainment Status Designations. 40 CFR Part 93: Determining Conformity of Federal Actions to State or Federal Implementation Plans. Environmental Protection Agency. Fact Sheet U.S. Court of Appeals for the D.C. Circuit Decision on EPA s Public Health Air Standards for Smog and Soot Environmental Protection Agency. Proposed Rule, Control Emissions of Hazardous Air Pollutants from Mobile Sources: Default Baseline Revision. December 22, Environmental Protection Agency. Toxic Air Pollutants website: index.html. R-13
346 Capital Beltway Study References Environmental Protection Agency. Mobile Source Air Toxics website: toxics.htm. Federal Highway Administration. Transportation and Air Quality: Selected Facts and Figures Federal Highway Administration. Letter from James M. Shrouds, Director Office of Natural and Human Environment to Mr. John T. Price, Division Administrator, Carson City, NV regarding Project-Level Analysis of Air Toxic and PM2.5 Emissions. Federal Highway Administration. Transportation-Related Air Toxics: Case Study Materials Related to US 95 in Nevada. Revised Final White Paper. STI RFWP. March 7, Federal Highway Administration. Transportation and Toxic Air Pollutants website: Metropolitan Washington Council of Governments. Plan to Improve Air Quality in the Washington, DC-MD-VA Region, State Implementation Plan (SIP) for the Washington, DC-MD-VA Ozone Nonattainment Area. February 19, Metropolitan Washington Council of Governments. Plan to Improve Air Quality in the Washington, DC-MD-VA Region, State Implementation Plan (SIP) for the Washington, DC-MD-VA Ozone Nonattainment Area, Appendices. February 19, Metropolitan Washington Council of Governments. Air Quality Trends in the Washington Metropolitan Area: National Capital Region Transportation Planning Board. Air Quality Conformity Determination of the Constrained Long Range Plan and the FY Transportation Improvement Program for the Washington Metropolitan Region. July 15, South Coast Air Quality Management District (AQMD), Multiple Air Toxics Exposure Study (MATES-II), March 2, Virginia Department of Environmental Quality, Office of Air Quality Assessment. Virginia Ambient Air Monitoring 1998 Data Report Virginia Department of Environmental Quality Office of Air Quality Assessment. Virginia Ambient Air Monitoring 1998 Data Report NOISE Anderson, Grant S., Cynthia S.Y. Lee, Gregg G. Fleming, and Christopher W. Menge. FHWA Traffic Noise Model, Version 1.0 User s Guide. Report Numbers FHWA-PD and DOT-VNTSC-FHWA Cambridge, MA: U.S. Department of Transportation, John A. Volpe National Transportation Systems Center, Acoustics Facility, January Federal Highway Administration. 23 CFR Part 772: Procedures for Abatement of Highway Traffic Noise and Construction Noise Final Rule. Federal Register, Vol. 47, No. 131, 8 July R-14
347 References Capital Beltway Study Federal Highway Administration, Office of Environment and Planning, Noise and Air Quality Branch. Highway Traffic Noise Analysis and Abatement Policy and Guidance. Washington DC, June FHWA Traffic Noise Model (FHWA TNM ) Validation Update, Presentation by Judith L. Rochart of the John A. Volpe National Transportation Systems Center at the Transportation Research Board A1F04 Committee on Noise and Vibration Summer Meeting, July Lee, Cynthia S.Y., Gregg G. Fleming, Joseph Burstein, FHWA Traffic Noise Model, Version 1.0 Look-Up Tables. Report Numbers FHWA-PD and DOT-VNTSC-FHWA Cambridge, MA: U.S. Department of Transportation, John A. Volpe National Transportation Systems Center, Acoustics Facility, July Menge, Christopher W., Christopher F. Rossano, Grant S. Anderson, Christopher J. Bajdek, FHWA Traffic Noise Model, Version 1.0: Technical Manual. Report Numbers FHWA- PD and DOT-VNTSC-FHWA Cambridge, MA: U.S. Department of Transportation, Research and Special Programs Administration, John A. Volpe National Transportation Systems Center, Acoustics Facility, February Virginia Department of Transportation. State Noise Abatement Policy. Adopted Pursuant to the Authority of Section of the Code of Virginia, January Virginia Department of Transportation, Metric Road and Bridge Specifications, Section (b) 3 Noise. January CULTURAL RESOURCES Advisory Council for Historic Preservation (ACHP) 36 CFR 800: Part Protection of Historic and Cultural Properties. Federal Register, September 2, 1986, as amended. Washington, D.C Barnosky, A.P., C.W. Barnosky, R.J. Nickman, A.C. Ashworth, D.P. Schwert, and S.W. Lantz. Late Quaternary Paleoecology at the Newton Site, Bradford County, Northeastern Pennsylvania: Mammuthus Columbi, Palynology and Fossil Insects. In Late Pleistocene and Early Holocene Paleoecology and Archeology of the Eastern Great Lakes Region, edited by R.S. Laub, N.G. Miller, and D.W. Steadman, pp Bulletin of the Buffalo Society of Natural Sciences No Binford, L.R. Willow Smoke and Dogs Tails: Hunter-Gatherer Settlement Systems and Archaeological Site Formation. American Antiquity 45: Brockman, C.F. Trees of North America. Golden Press, New York Carbone, V. Environment and Prehistory in the Shenandoah Valley. Ph.D. dissertation, Department of Anthropology, Catholic University of America, Washington, D.C Cheek, C.D. and G.D. Robinson. A Phase I Archaeological Survey in Association with Section 4(f) Statements for the Springfield Bypass, Fairfax County, Virginia. John Milner Associates, Inc R-15
348 Capital Beltway Study References Cheek, C.D., M.J. Wuellner, and J.S. Stevens. Phase Ia Historical and Archaeological Survey for the I-95/I-395/I-495 Interchange Improvement Springfield, Fairfax County, Virginia. John Milner Associates, Inc Chittenden, Betsy, Elizabeth S. David, Susan L. Henry, Michael F. Johnson, and Martha R. Williams. Fairfax County Heritage Resource Management Plan. Heritage Resources Branch, Office of Comprehensive Planning, County of Fairfax, Virginia Coe, Joffre Lanning. The Formative Cultures of the Carolina Piedmont. Transactions of the American Philosophical Society 54:5. Philadelphia Custer, Jay F. Settlement-Subsistence Systems in Augusta County, Virginia. Quarterly Bulletin of the Archaeological Society of Virginia 35: Delcourt, Hazel R., and Paul A. Delcourt. Quaternary Palynology and Vegetational History of the Southeastern United States. In Pollen Records of Late-Quaternary North American Sediments, edited by V.M. Bryant, Jr. and R.G. Holloway, pp American Association of Stratigraphic Palynologists Foundation, Dallas Delcourt, Paul A., and Hazel R. Delcourt. Long-Term Forest Dynamics of the Temperate Zone: A Case Study of Late-Quaternary Forests in Eastern North America. Springer- Verlag, New York. Dent, Richard J. Amerind Society and the Environment: Evidence from the Upper Delaware Valley. In Anthropological Careers: Perspectives on Research, Employment, and Training. Ruth H. Landman, et al., editors. Anthropological Society of Washington, Washington, D.C Dietsch, Deborah K. Washington s Hidden Contemporaries. (Washington Post. online Accessed at on September 23, 2000.) Elder, J.H., Jr. Soil Survey of Prince William County, Virginia. United States Department of Agriculture, Soil Conservation Service, Richmond Fairfax County Office of Comprehensive Planning. Fairfax Plan Monitoring. Heritage Resources: Existing Conditions and Trends Report. July Fairfax County Office of Comprehensive Planning, Heritage Resources Branch. Fairfax County Heritage Management Plan Fine, Marilyn. Personal communication. December 17, 1999, real estate agent. Gardner, William M. The Flint Run Complex: Pattern and Process during the Paleo-Indian to Early Archaic. In the Flint Run Paleo-Indian Complex: A Preliminary Report Seasons, edited by W.M. Gardner. Occasional Publication 1, Catholic University of America, Archeology Library, Washington, D.C Gardner, W.M. An Examination of Cultural Change in the Late Pleistocene and Early Holocene (Circa 9200 to 6800 B.C.). In Paleoindian Research in Virginia: A Synthesis, edited by J.M. Wittkofski and T.R. Reinhart, pp Special Publication No. 19. Archaeological Society of Virginia, Richmond R-16
349 References Capital Beltway Study Gleach, Frederic W. A Working Projectile Point Classification for Central Virginia. In Archaeology in Henrico Volume 2, Introduction to Phase 2 and 3 Archaeological Investigations of Henrico County Regional Wastewater System, edited by Daniel L. Mouer, pp , Virginia Commonwealth University, Archaeological Research Center, Richmond. Submitted to Henrico County, Virginia. On file at the VDHR, Richmond Graham, R.W. Paleoclimates and late Pleistocene Faunal Provinces in North America. In Pre-Plano Cultures of the Americas: Paradoxes and Possibilities, edited by R.L. Humphrey and D. Stanford, pp Anthropological Society of Washington, D.C Historic American Building Survey. HABS Inventory #119: Ravensworth. Virginia Department of Historic Resources Hodges, C., L. Boyd, and C. Egghart. Phase I Cultural Resources Survey of Proposed Road Improvements on Route 29 in Fairfax County, Virginia. Virginia Commonwealth University Archaeological Research Center Hoffman, M.A. and R.W. Foss. Man in the Blue Ridge An Archaeological and Environmental Perspective. Paper presented at the 1977 Annual Meeting of the Society for American Archaeology, New Orleans Hranicky, W. Jack and Floyd Painter. A Guide to the Identification of Virginia Projectile Points. Archaeological Society of Virginia Special Publications Number 17, Courtland, Virginia Hranicky, W. Jack. Middle Atlantic Projectile Point Typology and Nomenclature. Archaeological Society of Virginia Special Publications Number 33. Courtland, Virginia Jacobsen, G.L., Jr., and E.C. Grimm. Synchrony of Rapid Change in Late-Glacial Vegetation South of the Laurentide Ice Sheet. In Late Pleistocene and Early Holocene Paleoecology and Archeology of the Eastern Great Lakes Region, edited by R.S. Laub, N.G. Miller, and D.W. Steadman, pp Bulletin of the Buffalo Society of Natural Sciences No Jones, Olive, and Catherine Sullivan. The Parks Canada Glass Glossary. Studies in Archaeology, Architecture, and History. National Parks and Sites Branch, Parks Canada, Ottawa Justice, Noel D. Stone Age Spear and Arrow Points of the Midcontinental and Eastern United States. Indiana University Press, Bloomington Koski-Karell, Daniel. Phase I Cultural Resources Reconnaissance Survey of Improvements at I-495 and Arlington Boulevard Interchange. Karell Archaeological Services, Washington, D.C. Prepared for BKI Associates, McLean, Virginia. On file at the VDHR, Richmond Koski-Karell, Daniel. Phase II Cultural Resources Investigation of a Portion of Spanish- American War Camp Alger (Sites 44FX550 and 44FX551), Fairfax County, Virginia. R-17
350 Capital Beltway Study References Karell Archaeological Services, Washington, D.C. Prepared for BKI Associates, McLean, Virginia. On file at the VDHR, Richmond Kozarek, Sue Ellen. A Hopewellian Homestead in the Ohio River Valley. Unpublished Master s Thesis. Department of Anthropology, University of Cincinnati Kneberg, Madeline. Some Important Projectile Point Types Found in the Tennessee Area. Tennessee Archaeologist XII, No.1: Knepper, Dennis. The Lobate Point in Northern Virginia: Comparable Morphological Considerations. The Quarterly Bulletin of the Archaeological Society of Virginia 50(2): Louis Berger and Associates, Inc., Cultural Resource Group. Phase I Cultural Resource Investigation of Proposed Improvements to State Route 123/Ox Road McAvoy, J.M. and L.D. McAvoy. Archaeological Investigations of Site 44SX202, Cactus Hill, Sussex County, Virginia. Virginia Department of Historic Resources Research Report Series No McDonals, J.N. and S.O. Bird, ed. Late Quaternary Vegetational Change in the Central Atlantic States. In Quaternary of Virginia - A Symposium Volume, pp Publication No. 75. Virginia Division of Mineral Resources, Charlottesville Miller, George L. Classification and Economic Scaling of 19th Century Ceramics. Historical Archaeology 14: Monk, C. D., D. W. Imm, R. L. Potter, and G. G. Parker. A Classification of the Deciduous Forest in Eastern North America. Vegetation 80: Mouer, L. Daniel. The Formative Transition in Virginia. In Late Archaic and Early Woodland Research in Virginia, edited by Theodore R. Reinhart and Mary Ellen N. Hodges. Council of Virginia Archaeologists and the Archaeological Society of Virginia. The Dietz Press, Richmond Munsell Color. Munsell Soil Color Charts. Macbeth Division of Kollomorgan Instruments Corporation, New Windsor, New York. Munsey, Cecil. The Illustrated Guide to Collecting Bottles. Hawthorn Books, Inc., New York. Netherton, N., D. Sweig, J. Artemel, P. Hickin, and P. Reed. Fairfax County, A History Noel Hume, Ivor. A Guide to Artifacts of Colonial America. Alfred A. Knopf, New York. Porter, H.C., J.F. Derting, J.H. Elder, E.F. Henry, and R.F. Pendelton. Soil Survey of Fairfax County, Virginia. United States Department of Agriculture, Soil Conservation Service. Washington, D.C Potter, Stephen R. Commoners, Tribute, and Chiefs: The Development of Algonquian Culture in the Potomac Valley. The University Press of Virginia, Charlottesville R-18
351 References Capital Beltway Study Prices and Index Values for English Ceramics from 1787 to Department of Archaeological Research, Colonial Williamsburg Quarterman, E., and C. Keever. Southern Mixed Hardwood Forest: Climax in the Southeastern Coastal Plain: U.S.A. Ecological Monographs 32: Rickard, D.L. A Phase I Archaeological Evaluation of a Section of Route 495 in Fairfax County, Virginia. James Madison University Archaeological Research Center Ritchie, William A. A Typology and Nomenclature for New York Projectile Points. New York State Museum and Science Service, Albany Seidel, John L. "China Glaze" Wares on Sites from the American Revolution: Pearlware Before Wedgewood? Historical Archaeology 24: Sirkin, L. Late Pleistocene Vegetation and Environments in the Middle Atlantic Region. New York Academy of Science Annals 288: South, Stanley A. Methods and Theory in Historical Archeology. Academic Press, New York Stephenson, R.L., L.L. Ferguson, and G.H. Ferguson. The Accokeek Creek Site: A Middle Atlantic Seaboard Culture Sequence. Museum of Anthropology, University of Michigan, Ann Arbor Anthropological Papers No. 20, Ann Arbor Steponaitis, Vincas P. Prehistoric Archaeology in the Southeastern United States, Annual Review of Anthropology 15: Taylor, Randolph, and Brad Koldehoff. A Guide to LITHICA: An R-Base Lithic Analysis System. Manuscript on file with Louis Berger & Associates, Inc., East Orange, New Jersey. Thunderbird Archaeological Associates, Inc. Phase I Archaeological Investigations at the 11+ Acre Morgan Chase Tract Fairfax County, Virginia. Report prepared for The Christopher Companies, McLean, Virginia. Copies available at the VDHR, Richmond Toulouse, Julian H. Bottle Makes and Their Marks. Thomas Nelson, Inc., New York and Camden Turner, E. Randolph and Antony F. Opperman. Archaeological Manifestations of the Virginia Company Period: A Summary of Surviving Powhatan and English Settlements in Tidewater Virginia, Circa In The Archaeology of Seventeenth Century Virginia. A.S.V. Special Publication Number 30. Dietz Press, Richmond, Virginia United States Department of the Interior, Interagency Resources Division Department of the Interior s Regulations, 36 CFR Part 60: National Register of Historic Places. U.S. Department of the Interior, Washington, D.C United States Department of the Interior, Interagency Resources Division Archaeology and Historic Preservation: Secretary of the Interior s Standards and Guidelines. U.S. Department of the Interior, Washington, D.C R-19
352 Capital Beltway Study References United States Department of the Interior, Interagency Resources Division How to Apply the National Register Criteria for Evaluation. National Register Bulletin 15. Washington D.C U.S. Geological Survey. Annandale, Virginia Quadrangle Topographic Map. 7.5 Minute Series Revision. U.S. Geological Survey. Falls Church, Virginia Quadrangle Topographic Map. 7.5 Minute Series Revision. Virginia Department of Historic Resources (VDHR). Guidelines for Preparing Identification and Evaluation Reports for Submission pursuant to Sections 106 and 11, National Historic Preservation Act, Environmental Impact Reports of State Agencies. Virginia Appropriation Act, 1992 Session Amendments. VDHR, Richmond Virginia Department of Historic Resources. How to Use Historic Contexts in Virginia: A Guide for Survey, Registration, Protection, and Treatment Projects Virginia Department of Historic Resources. State Curation Standards. VDHR, Richmond Virginia Department of Historic Resources. Guidelines for Archaeological Investigations in Virginia, Additional Guidance for the Implementation of the Federal Standards Entitled Archaeology and Historic Preservation. Secretary of the Interior s Standards and Guidelines (48 FR , September 29, 1983). VDHR, Richmond Virginia Department of Mineral Resources. Geologic Map of Virginia. Virginia Department of Mineral Resources, Scale 1:500,000. Richmond, Virginia Watts, W.A. The Late Quarternary Vegetation History of the Southeastern United States. Annual Review of Ecology and Systematics 11: Whyte, Thomas R. A Review of Evidence of Human Subsistence During the Early and Middle Archaic Periods in Virginia. In Early and Middle Archaic Research in Virginia: A Synthesis, edited by Theodore R. Reinhart and Mary Ellen N. Hodges, pp Council of Virginia Archaeologists and the Archaeological Society of Virginia. The Dietz Press, Richmond Withrow, Randall and Maral Calbian. Phase I Cultural Resources Investigation of Proposed Improvements to State Route 123/Ox Road. Louis Berger and Associates, Inc., The Cultural Resources Group, Richmond. On file at the VDHR, Richmond Worthy, Linda H. Classification and Interpretation of Late-Nineteenth Century and Early- Twentieth century Ceramics. In Archaeology of Urban America: The Search for Pattern and Process, edited by Roy S. Dickens, Jr. Academic Press, New York HAZARDOUS MATERIALS American Society for Testing and Materials. Standard Practice for Environmental Site Assessments: Transaction Screen Process. E R-20
353 References Capital Beltway Study Black, J.M. Personal Communication regarding PCB Status of Virginia Power Equipment Drake, A.A. Jr. and Froelich, A.J. Geologic Map of the Falls Church Quadrangle, Fairfax and Arlington Counties and the City of Falls Church, Virginia, and Montgomery County, Maryland. U.S. Geological Survey, Geologic Quadrangle Map GQ Drake, A.A. and Froelich, A.J. Geologic Map of the Annandale Quadrangle, Fairfax and Arlington Counties, and Alexandria City, Virginia. U.S. Geological Survey, Geologic Quadrangle Map GQ Environmental Data Resources (EDR). EDR-Environmental Atlas, Area/Corridor Study, Capital Beltway Corridor, Fairfax County, Virginia. Inquiry number s Fairfax County Department of Fire and Rescue. List of Tier II Reporting Facilities Froelich, A.J. and Langer, W.H., Maps Showing Geologic Provinces, Landforms, Drainage Basin Characteristics, and Flooding in Fairfax County and Vicinity, Virginia. United States Geological Survey, Miscellaneous Field Investigation Map I Froelich, A.J. and Zenone, C. Maps Showing Geologic Terrain, Drainage Basins, Overburden, and Low Flow of Streams in Fairfax County and Vicinity, Virginia. United States Geological Survey, Miscellaneous Field Investigation Map I Porter, C.H., J.F. Dertling, J.H. Elder, and E.S. Henry. Soil Survey Fairfax County, Virginia. United States Department of Agriculture, Soil Conservation Service, Washington, D.C. 87pp plus plates Rader, E.K. and Evans, N.H., editors. Geologic Map of Virginia Expanded Explanation. Virginia Division of Mineral Resources U.S. Geological Survey. Annandale, Virginia Quadrangle Topographic Map. 7.5 Minute Series Revision U.S. Geological Survey. Falls Church, Virginia Quadrangle Topographic Map. 7.5 Minute Series Revision Virginia Department of Environmental Quality. Environmental Information Database Search Program (EIDSP). Zip Codes: 22003, 22027, 22031, 22042, 22043, 22101, 22103, 22151, 22180, and Zenone, C. and Larson, J.D. Ground-water Resources of Fairfax County and Vicinity, Virginia, and Some Aspects of Their Development. United States Geological Survey, Miscellaneous Field Investigation Map I OTHER TRANSPORTATION STUDIES Federal Highway Administration. Route 66: Final Supplemental Environmental/ Section 4(f) Statement. December 20, Maryland State Office of Comprehensive Planning. MD 210 HOV Feasibility Study Summary. March R-21
354 Capital Beltway Study References Metropolitan Washington Council of Governments. The Potential for Circumferential Transit in the Washington Region. August Tysons Transportation Association. Tysons Corner Commuter Shuttle Feasibility Study. November 14, Virginia Department of Rail and Public Transportation. Dulles Corridor Transportation Study: Final Report. June Virginia Department of Rail and Public Transportation. I-66 Corridor Major Investment Study: Summary Report of Findings and Recommendations. January Virginia Department of Rail and Public Transportation. Report of the Dulles Corridor Task Force. Supplement to the Dulles Corridor Transportation Study. July Virginia Department of Rail and Public Transportation. Capital Beltway Corridor Rail Feasibility Study: Final Report. March Virginia Department of Rail and Public Transportation. Dulles Corridor Rapid Transit Project and Section 4(f) Evaluation. December Virginia Department of Transportation. Clermont Avenue Interchange with Interstate 95: Final Environmental Assessment. November Virginia Department of Transportation. Dulles Toll Road Widening Project : HOV Lane Implementation Study. August Virginia Department of Transportation. I-95/ I-395/I-495 Interchange Improvements: Final Environmental Assessment Section 4(f) Evaluation. September Virginia Department of Transportation. Northern Virginia 2010 Transportation Plan: Summary Report. January Virginia Department of Transportation. Northern Virginia 2010 Transportation Plan: Technical Report. January Virginia Department of Transportation. Route 1 Corridor Study: Fairfax and Prince William Counties. November R-22
355 INDEX Accidents , 2-43, 2-50 Affected Environment Agency Coordination Air Quality , 4-11, 4-63, 4-71 Alternatives Build Considered and Eliminated... S-10, 2-51 Mass Transit... S-10 No-Build Preferred Transportation System Management... S-10, 2-65 Aquatic Ecology , 4-60 Archaeological Resources , 4-69 Benthic Communities , 4-60, 4-62 Bicycle Trails , 3-71, 4-6, 4-9 Business Displacements , 4-5, 4-6 Capacity , 1-12, 2-30 Chesapeake Bay Preservation Act , 4-55 Citizen Involvement see Public Involvement Clean Water Act Section 404(b)(1) Evaluation , 4-58 Coastal Zone Management , 7-5 Comments and Coordination Commonwealth Transportation Board...1-6, 2-2, 2-11, 2-31, 2-47, 7-20, 8-4 Community Facilities and Services Construction Impacts Corridor Description Costs Criteria Pollutants Cultural Resources see Historic Sites and Archaeological Resources , 4-61 Demographics see also Population , 3-11 Displacements Distribution of FEIS Draft EIS/Section 4(f) Evaluation I-1
356 Capital Beltway Study Index Economic Setting Employment Environmental Justice , 4-6 Existing Conditions see Affected Environment Federal Actions And Permits Required... S-19 Floodplains , 4-56 Geology Groundwater , 4-53 Hazardous Materials , 4-10 Historic Sites and Archaeological Resources , 4-61 Housing Interagency Coordination Meetings , 7-9 Intermodal Relationships Irreversible and Irretrievable Commitments Issues Identification Land Use , 3-1, 4-1, 4-62 Level of Service...2-9, 2-37, 2-47, 2-49, 4-20, 4-21 List of Preparers Local and Regional Plans and Policies Major Investment Study , 2-2, 7-9 Mass Transit , 1-13, 2-4 Master Plans , 3-3 Minority Communities Natural Environment National Environmental Policy Act No-Build Alternative Noise , 4-23, 4-63 Operational Characteristics Parks and Recreation , 4-8 Pedestrian/Bicycle Facilities , 3-34, 3-36 Population , 1-18, 3-11, 3-18, 3-19, 8-4 Preferred Alternative...S-11, 2-11, 2-22, 2-23, 2-29, 2-43, 2-50, 2-52, 2-57,2-63, 4-1, 4-2, 4-3, 4-4, 4-5, 4-6, 4-7, 4-8, 4-9, 4-10, 4-11, 4-12, 4-15, 4-16, 4-20, 4-23, 4-24, 4-30, 4-33, 4-34, 4-35, 4-36, 4-37, 4-38, 4-40, 4-41, 4-46, 4-47, 4-48, 4-49, 4-50, 4-51, 4-52, 4-53, 4-54, 4-56, 4-57, 4-59, 4-60,4-61, 4-62, 4-64, 4-65, 4-66, 4-68, 4-69, 4-70, 4-72, 7-20, 8-4, 8-10, 8-11, 8-13, 8-15, 8-17, 8-19, 8-21, 8-23, 8-24, 8-25, 8-26, 8-28, 8-28 I-2
357 Index Capital Beltway Study Project Description Project History Project Need Project Setting Project Status Project Termini Public Involvement Purpose and Need Rail Transit... S-10, 1-5, 1-13, 1-15, 2-64 Reevaluation...S-20, C-1 Relocations Residential Displacements Revised Candidate Build Alternatives Right-of-Way Requirements , 8-22 Roadway Design , 2-50 Safety , 2-50 Screening Process...2-1, 2-8, 2-9, 2-10, 2-11 Section 4(f) Evaluation Section Section Section Secondary and Cumulative Effects Short-Term Impact vs. Long-Term Productivity Socioeconomics , 4-4 Soils , 4-53 Special Jurisdictions Summary...S-1 Surface Waters , 4-54 System Linkage Tax Revenues and Impacts , 4-4 Terrestrial Ecology , 4-60 Threatened and Endangered Species , 4-61 Travel Demand Trip Patterns Visual Impacts , 4-52 Waters of the U.S , 4-55, 4-62 Water Quality , 4-62 Wetlands , 4-55, 4-62 Wetland Mitigation Wildlife and Habitats , 4-60, 4-62 I-3
358 Capital Beltway Study Index I-4
359 A AGENCY COMMENT LETTERS AND RESPONSES Written comments on the Draft EIS were received from fourteen government agencies and officials. The comment letters from each are presented in the following appendix along with responses as appropriate. Federal Emergency Management Agency...A-2 US Coast Guard Fifth District...A-3 US Army Corps of Engineers Norfolk District...A-4 Virginia Department of Conservation and Recreation...A-6 Virginia Department of Health Division of Drinking Water...A-8 Virginia Department of Environmental Quality Water Division...A-9 Virginia Department of Environmental Quality Air Division...A-11 Virginia State Delegate James F. Almand...A-27 Virginia State Delegate James M. Scott...A-28 Metropolitan Washington Airports Authority...A-12 Northern Virginia Regional Commission...A-15 Washington Metropolitan Area Transit Authority...A-16 Fairfax County Board of Supervisors...A-25 Fairfax County Non-Motorized Transportation Committee...A-29 A-1
360 Capital Beltway Study Appendix A 1. Figure 3-13 in the Final EIS depicts all floodplains within the project area subject to the one percent annual chance (100 year) flood. Section 4.11 quantifies the anticipated floodplain encroachments calculated in a conservative manner. Most of the expected floodplain fills are for longitudinal roadbed fill extensions and cannot be avoided by bridging. During final design, detailed engineering and hydraulic studies, and any stream capacity maintenance analyses required by Fairfax County would be performed. Since almost all floodplains lie within mapped Resource Preservation Area (RPA) resources, avoidance, minimization, and mitigation for floodplain impacts will be documented to ensure compliance with Chesapeake Bay Preservation Area (CBPA) exemption conditions. 2. As stated in Section 4.11 of the Final EIS, preliminary project designs sought to minimize and avoid impacts to floodplains by including floodplains as an evaluation criteria in the alternatives development process. As stated above and in Section 4.11 of the Final EIS, the expected fills are a result of longitudinal roadbed fill extensions. Since circulation of the Draft EIS, floodplain impacts have been reduced substantially. 3. VDOT will coordinate with all applicable floodplain management officers, or their equivalents, in order to comply with NFIP stipulations as part of Executive Order requirements. In addition, VDOT s specifications require the use of stormwater management practices to address concerns such as post development stormflows and to prevent increases in flooding risks associated with the proposed improvements. During final design, a detailed hydraulic survey and study would evaluate the effect of the proposed improvements on stormwater discharge. A-2
361 Agency Comment Letters and Responses Capital Beltway Study 1. Comment noted. A-3
362 Capital Beltway Study Appendix A 1. Proposed changes to the alternatives have reduced wetland impacts by approximately 24% and stream impacts by approximately 47% 2. VDOT routinely incorporates minimization practices including bridging, retaining walls, and countersinking of culverts in its final designs. Table 4-18 in Section of the Final EIS presents preliminary documentation of minimization procedures to reduce wetland impacts. In order to implement the least environmentally damaging practicable alternative, VDOT will conduct all stream and wetland crossings in such a manner as to maintain hydrology. As documented in the Final EIS (Section ), VDOT will avoid stream relocations and implement perpendicular stream crossings as much as practicable to minimize construction impacts. VDOT acknowledges that compensation will be required for unavoidable impacts to wetlands, as documented in the Final EIS (Section ). Specific language contained in your letter will be added to this Section as follows: Compensation mitigation may be required for stream impacts, depending on the extent and nature of the impacts. Unavoidable stream relocations will incorporate natural stream designs that replicate stream length, meanders, and riparian features. The clearing of stream banks and riparian zones will be minimized to the maximum extent practicable. 3. Comment noted. A-4

, inclusion of a")
363 Agency Comment Letters and Responses Capital Beltway Study 3. The geographic boundary for cumulative effects was determined by using a series of overlay mapping. As noted in Section of the Final EIS, overlays of the traffic, influence, census tracts, and subwatersheds were created. Geographic boundaries for cumulative effects analysis varies depending on the resource evaluated. Because of the differences in geographic boundaries for different resources (e.g. air quality impacts are considered for the entire region and beyond, while water quality is assessed for streams and watersheds), inclusion of a single map would not be useful for communicative or illustrative purposes. The temporal boundary for past cumulative affects analysis was based, in part, on the availability of data and therefore tends to be addressed in a qualitative manner rather than being quantitatively assessed for a set past time period. 4. Table 4-23 has been revised as part of the Final EIS to make its meaning clear (new table number 4-22). Unavoidable impacts to aquatic resources from this study and others will be compensated for through the creation or restoration of both wetland and stream habitats. These impacts would be compensated for within the same HUC either in advance of or during the projects construction. 5. The referenced statement was included in the Final EIS to let the reader know that the improvements being studied for Route 123 would work with any of the Beltway alternatives studied and that the Preferred Alternative selected for the Beltway would not influence the type and degree of improvements made to Route 123. The proposed Route 123 improvements likely will have impacts to some of the resources studied as part of the cumulative effects analysis for this project. However, those impacts when viewed in combination with the impacts from the Capital Beltway Study are unlikely to be significant within the geographic and temporal boundaries. A-5

364 Capital Beltway Study Appendix A 1. Comment noted. However, to date such areas have not been observed within the project area. 2. Comment noted. 3. Comment noted. 4. Comment noted. A-6
365 Agency Comment Letters and Responses Capital Beltway Study 5. As noted in Section of the Final EIS, the Washington & Old Dominion Railroad Regional Park was developed with such funds and conversion of lands within the park to highway right-of-way would be subject to approval by approval of the U.S. Department of Interior under Section 6(f) of the L&WC Act. Coordination with both the Northern Virginia Regional Park Authority and Fairfax County Park Authority is ongoing. A-7
366 Capital Beltway Study Appendix A 1. Comment noted. A-8
367 Agency Comment Letters and Responses Capital Beltway Study 1. Potential impacts resulting from the Preferred Alternative have been reduced during the planning and design process as shown in Table 4-19 presented in Section of the Final EIS. 2. The impacts to state waters and measures to mitigate those impacts are presented in Section 4.10 of the Final EIS. 3. As stated in Section of the Final EIS, temporary and permanent stormwater management measures, including detention basins, vegetative controls, and other measures would be implemented to minimize potential degradation of water quality. The requirements and special conditions of any required permits for work in and around surface waters would be incorporated into construction contract documents. The construction contractor would be required to comply with those conditions and with the pollution control measures specified in VDOT s Road and Bridge Specifications. A-9
368 Capital Beltway Study Appendix A 4. Comment noted. A-10
369 Agency Comment Letters and Responses Capital Beltway Study 1. Comment noted. A-11
370 Capital Beltway Study Appendix A 1. Access to and from the Dulles International Airport Access Highway (DIAAH) from the Capital Beltway will be improved as part of the Preferred Alternative. Additional flyover ramps will be added to facilitate movement of non- HOV traffic to and from the right at the interchange with the Dulles Toll Road on the Capital Beltway. The existing left exit would be for HOV or HOT traffic. The Preferred Alternative documented in the Final EIS is the 12-Lane HOT Alternative, which was developed in response to public and local government comments about the costs and impacts of the alternatives included in the Draft EIS. This alternative would add two HOT lanes to the Capital Beltway in each direction and modify, improve and reconfigure the interchanges to increase capacity, reduce congestion and improve safety. The far two left lanes would be designated HOT lanes and separated from the general-purpose lanes with a buffer strip. The HOT lanes would be used by HOVs, buses, and tolled single occupancy vehicles. Direct HOV access to the Dulles Toll Road would be included as part of the Preferred Alternative. Direct access to the DIAAH from the Capital Beltway for airport users only is not included as part of the Preferred Alternative. Such ramps cannot be added to the Preferred Alternative without also adding significant impacts to the neighborhoods adjacent to the interchange and significant additional capital costs. The Preferred Alternative was designed to balance the transportation needs in the corridor with a level of acceptable impacts and costs. A-12

371 Agency Comment Letters and Responses Capital Beltway Study A-13
372 Capital Beltway Study Appendix A 2. The interchange improvements planned for the Capital Beltway at the DIAAH and Dulles Toll Road would not preclude widening the DIAAH to 6 lanes in the future. Preliminary engineering of the Dulles Corridor Rapid Transit Project is underway and the Final EIS is complete. The Locally Preferred Alternative, endorsed by local and state boards, including MWAA s Board of Directors, is an extension of Metrorail through Tysons Corner on Alignment T6 through Dulles Airport to eastern Loudoun County. Currently VDOT knows of no other rail improvements that would utilize the land in the interchange previously reserved for rail transit. A-14

373 Agency Comment Letters and Responses Capital Beltway Study 1. VDOT is committed to construction activities that result in no-net increase in phosphorous loadings and all other applicable post-development water quality requirements through the implementation of best management practices, including stormwater management facilities. VDOT will provide quantitative and qualitative stormwater management facilities designed to meet treatment requirements established by VDOT and the VDCR through the VDOT Drainage Manual and the VDOT Erosion Sediment Control and Stormwater Management Manual. Implementation methods are described in Section of the Natural Resources Technical Report. 2. To the extent practicable, VDOT s final design will consider opportunities for retrofitting existing stormwater management facilities within VDOT s right-of-way (See Section 4.11 of the Final EIS). A-15
374 Capital Beltway Study Appendix A 1. The Capital Beltway Corridor Rail Feasibility Study, completed in March 2001, concluded with four major recommendations for advancing transit within the Corridor. Two of the four are relevant to the Capital Beltway Study and are as follows: The effect of introducing rail transit in the Beltway Corridor does not remove the need for highway improvements It is not desirable to use the Beltway right-of-way to implement rail transit in the corridor. However, any widening of the Beltway should be conducted so as to not preclude rail transit in the corridor. VDOT will continue coordination with DRPT and WMATA to ensure that the Preferred Alternative is designed so that it won t preclude piers or structures to carry transit over I The Preferred Alternative would not affect the existing Metrorail bridge for the Orange Line at the I-66 interchange (See Section of the Final EIS). Construction would be planned and staged so that there will not be service interruptions on the Orange Line. Coordination with WMATA staff will continue throughout final design and construction. 3. The Preferred Alternative would have minor impacts to the walkway connecting the parking to the Dunn Loring Metrorail Station. However it would not affect the Dunn Loring Metrorail Station itself. The preferred interchange concept for I-66 has been reduced in size and scale to eliminate the impacts to the station on the southside of I-66 and to Stenwood Elementary School on the northside. A new walkway would be constructed adjacent to the current walkway location. The existing structure would provide access until the new structure is complete so that there would be no disruption to Metrorail access. A traction power substation (TPSS) located along I-66 to the west of the Dunn Loring Metrorail Station. This TPSS would need to be relocated to accommodate the redesigned ramp to travel from I-66 eastbound to I-495 westbound. A-16
375 Agency Comment Letters and Responses Capital Beltway Study 4. The Preferred Alternative would accommodate the Dulles Corridor Rapid Transit Project which is planned to cross the Capital Beltway on Alignment T6 at Route 123 (See Section in the Final EIS). VDOT will continue coordination with the Department of Rail and Public Transportation (DRPT) as the preliminary engineering of the rail transit improvements proceeds to ensure that the improvements planned by both study teams can be accommodated within the Route 123 interchange. A-17
376 Capital Beltway Study Appendix A 5. This EIS like all EISs is focused on a specific set of problems and alternatives to address those problems and concerns. The broader questions raised by WMATA have been/are being addressed by a variety of studies that are part of the continuous regional planning process. The Capital Beltway Improvement Study focused on developing alternatives to address safety concerns, improve traffic operations, and to a limited extent increase capacity. Initially, the Beltway studies placed more emphasis on increasing capacity. However, based on the comments received from the public and political leaders alternatives considered were limited to those that could fit generally within the right-of-way. 6. Comment noted. A-18

377 Agency Comment Letters and Responses Capital Beltway Study 7. The review of more ambitious and/or alternative projects was limited to an assessment of the ability of other projects, if implemented, to reduce the demand on the Beltway and postpone or eliminate the need altogether for highway improvements. This study and others found that even when projects such as circumferential rail were implemented the concerns and problem areas on the Beltway needed to be addressed. Inreponse to the identified need alternatives that would allow for the implementation of HOV/HOT lanes were developed. Each of the build alternatives have sufficient capacity to carry the projected HOV demand. Thus the person throughput is similar for each of the build alternatives. Criteria that distinguished each alternative were chosen to compare the alternatives. This EIS identifies and evaluates alternatives for addressing the highway needs in the Corridor and the implementation of HOV/HOT lanes. It does not address whether or not widening of the Beltway should proceed before, in conjuction with, or following other major transportation projects such as rail. It does assume that if this project is implemented first that it will accommodate a future rail project. 8. Comment noted. A-19

378 Capital Beltway Study Appendix A 9. The revised build alternatives do not have enough additional capacity (e.g., additional lanes) to provide substantial reduction of congestion during the peak periods. This reflects the trade-off between reduced right-of-way requirements and increased operational benefits. 10. The analysis was not trying to assess the relative merits of transit improvements vs highway improvements, rather simply to assess whether or not transit improvements could postpone or eliminate the need for highway improvements. It is true that the transit improvements as assumed could serve more individuals than the highway improvement to the Beltway, however, the cost of implementing the transit system would be significantly higher and the right-of-way requirements would cause substantially higher impacts. A-20
. 12.")
379 Agency Comment Letters and Responses Capital Beltway Study 11. The text notes that depending on the roadway configuration up to two HOV lanes were considered for the Express/Local alternatives (See Section 2.1.2). 12. Direct access to and from HOV lanes would only provided at arterials where HOV lanes are existing or planned (See Section in the Final EIS). In the case of an express/local system, vehicles are able to merge out the concurrent flow HOV lanes and use any exit. In the case of a barrier-separated system, vehicles are more limited in terms of where they can exit or enter the system. However, it is this limitation that also provides benefits in terms of the operation of the HOV system in that the HOV lanes are physically separated from the general purpose lanes (See Sections and in the Final EIS) 1. See response No. 1 above. A-21

380 Capital Beltway Study Appendix A 1. See response No. 1 above. 2. See response No. 2 above. 4. See response No. 4 above. A-22
381 Agency Comment Letters and Responses Capital Beltway Study 13. Comment noted. 14. This statement has been omitted from the Final EIS. 3. See response No. 3 above. 15. The description of the Dulles Corridor Rapid Transit Project has been updated as appropriate throughout the Final EIS. A-23
382 Capital Beltway Study Appendix A A-24
383 Agency Comment Letters and Responses Capital Beltway Study 1. The Preferred Alternative documented in the Final EIS is the 12-Lane HOT Alternative, which was developed in response to public and local government comments about the costs and impacts of the alternatives included in the Draft EIS. This alternative would add two HOT lanes to the Capital Beltway in each direction and modify, improve and reconfigure the interchanges to increase capacity, reduce congestion and improve safety. The far two left lanes would be designated HOT lanes and separated from the general-purpose lanes with a buffer strip. The HOT lanes would be used by HOVs, buses, and tolled single occupancy vehicles. Direct HOV access to the Dulles Toll Road would be included as part of the Preferred Alternative. In summary, the Preferred Alternative was designed to balance the transportation needs in the corridor with a level of acceptable impacts and costs. 2. Throughout the EIS process, alternatives were modified to minimize environmental impacts and provide mitigation where impacts are unavoidable. The revised alternatives presented in the Final EIS represent a substantial reduction in environmental impacts from what was presented in the Draft EIS. All of the build alternatives include the addition of HOT lanes that would provide priority use for single occupant vehicles paying a toll, carpools, and express busses. 3. All of the build alternatives would have positive effects on highway and traffic safety. The higher capacity would result in improved travel times for all vehicles including those involved in emergency and disaster response. 4. The Capital Beltway Corridor Rail Feasibility Study, completed in March 2001, concluded with two recommendations for advancing transit within the Corridor relevant to the Capital Beltway Study: The effect of introducing rail transit in the Beltway Corridor does not remove the need for highway improvements It is not desirable to use the Beltway right-of-way to implement rail transit in the corridor. However, any widening of the Beltway should be conducted so as to not preclude rail transit in the corridor. VDOT will continue coordination with DRPT and WMATA to ensure that the Preferred Alternative is designed so that it won t preclude piers or structures to carry transit over I-495. A-25
384 Capital Beltway Study Appendix A A-26
385 Agency Comment Letters and Responses Capital Beltway Study 1. Comment noted. 2. The Fairfax Countywide Trails plan was consulted to ensure that potential impacts to planned and existing trails would be avoided in the design of the alternatives. Currently, Fairfax County s plan does show the trails running parallel to the Beltway. The plans for the Preferred Alternative would not impact these trails. However, planning the location and design of such trails would fall under the jurisdiction of Fairfax County. One existing trail, the W&OD Railroad Regional Park crosses the Capital Beltway near the I-66 interchange. During the construction of the Preferred Alternative, it will be necessary to replace the bridge. The replacement bridge will be designed to meet the Northern Virginia Regional Park Authority s current standards for bridges and to ensure appropriate access and maintenance of traffic during and after construction. A-27
386 Capital Beltway Study Appendix A 1. The Preferred Alternative documented in the Final EIS is the 12-Lane HOT Alternative, which was developed in response to public and local government comments about the costs and impacts of the alternatives included in the Draft EIS. The Preferred Alternative would add two HOT lanes to the Capital Beltway in each direction and modify, improve and reconfigure the interchanges to increase capacity, reduce congestion and improve safety. The far two left lanes would be designated HOT lanes and separated from the general-purpose lanes with a buffer strip. The HOT lanes would be used by HOVs, buses, and tolled single occupancy vehicles. This alternative was designed to balance the transportation needs in the corridor with a level of acceptable impacts and costs. Consequently, the natural and social environmental impacts reported in the Draft EIS have been reduced substantially. A-28
387 Agency Comment Letters and Responses Capital Beltway Study 1. The Existing Trails Map and Countywide Trails Plan were reviewed to ensure that none of the existing or planned trails within the study area would be affected by the project. Section 3.4 of the Final EIS has been revised to specifically cite these sources and the trails planned to parallel the Capital Beltway. In addition, Section 4.4 of the Final EIS has been revised to more specifically indicate that none of the existing or proposed trails in the Plan would be affected by the Preferred Alternative. The provision of protected bikeways and pedestrian paths would be addressed during the final design phase of the project. With respect to crossings of the Beltway for bicycles and pedestrians, Fairfax County's position is that access will be provided at each location, and crossings that currently exist (including all existing free and low traffic crossings) will be maintained during and after construction. Currently there are no dedicated facilities for pedestrians and bicyclists along the Beltway. The primary purpose of the Capital Beltway Study is to improve traffic conditions on the Capital Beltway, a limited access freeway facility. The location of future trails, planning access to those trails from surrounding developments and assessments of how the future trails and their access would improve pedestrian and bicycle access and mobility falls under the jurisdiction of Fairfax County. A-29
388 Capital Beltway Study Appendix A A-30
389 Agency Comment Letters and Responses Capital Beltway Study 1. Accommodations for trails and non-motorized transportation are discussed in Section 4.4 of the Final EIS. The engineering designs completed to date are preliminary in nature and do not yet contain enough detail to show sidewalks on overpasses. The provision of protected bikeways and pedestrian paths would be addressed during the final design phase of the project. The W&OD Railroad Regional Park crosses the Capital Beltway near the I-66 interchange. During the construction of the Preferred Alternative, a new bridge for the W&OD trail would be built. Staged construction of the bridge would ensure that pedestrian and bicycle crossings are maintained at all times. The replacement bridge will be designed to meet the Northern Virginia Regional Park Authority s current standards for bridges. With respect to crossings of the Beltway for bicycles and pedestrians, Fairfax County's position is that access will be provided at each location, and crossings that currently exist will be maintained during and after construction. 2. Section 3.4 of the Final EIS was revised to cite this study and include a discussion of its recommendations. The recommendations made in the final report currently do not match the Countywide Trails Plan. A-31
390 Capital Beltway Study Appendix A 3. Modifications to the interchange at the George Washington Memorial Parkway are not planned as part of the Capital Beltway Study. Development of the Potomac Heritage National Scenic Trail would not be affected by this project. A-32
391 Agency Comment Letters and Responses Capital Beltway Study A-33
392 Capital Beltway Study Appendix A A-34
393 B PUBLIC COMMENTS AND RESPONSES Public agencies, elected officials, businesses, civic association representatives, interest groups, and the general public submitted comments regarding the Capital Beltway Study during the formal comment period that followed publication of the Draft EIS. The comments were submitted through testimony at the hearings, comment cards, letters, s, post card campaigns, petitions, written statements, or a combination thereof. Copies of the statements submitted can be found in the Summary Report for the Location Public Hearing. All of the comments were carefully reviewed and summarized and then compiled into the categories listed below. The comments received as well as responses to those comments are presented after the list of categories. B.1 Study Process General Purpose and Need Alternatives Development Agency Coordination Other Projects or Studies B.2 Draft EIS Alternatives General No-Build Concurrent HOV Express/Local with HOV Barrier-Separated HOV B.3 Other Alternatives Suggested Rail Transit Tolls or High Occupancy Toll (HOT) Outer Beltway New Potomac River Crossing Other B.4 Interchange Concepts General Braddock Road B-1
394 Appendix B Capital Beltway Study Little River Turnpike Gallows Road Arlington Boulevard Interstate 66 Leesburg Pike Chain Bridge Road Dulles Airport Access and Toll Road Georgetown Pike George Washington Memorial Parkway B.5. Traffic and Transportation Traffic Forecasts Traffic Operations Safety HOV Lanes and Access Transit Bicycle and Pedestrian Issues Regional Transportation Planning System Connectivity B.6 Environmental Impacts General Environmental Land Use Right-of-Way/Displacements/Property Values Air Quality Water Quality Historic and Archeological Hazardous Materials Noise B.7 Funding and Implementation Project Costs and Funding Construction Schedule and Phasing Tolls/HOT Lanes B.8 Public Involvement B-2
395 Capital Beltway Study Public Comments and Responses B.1 STUDY PROCESS General 1. The potential highway work precludes the ability to operate businesses and affects not just the property owners, but the lenders and the tenants involved as well. We ask that a definitive timetable be presented and that the correct set of facts be presented to ensure an educated and prudent decision. (1 commentor) The study of improvements for the Capital Beltway should not preclude normal operations for property owners or businesses in the Corridor. The best available information regarding the Capital Beltway Study has been made publicly available through a series of public workshops and public hearings, a project newsletter, and an interactive web site. The project schedule has been published on the project web site and in the newsletters. The preparation of the study is subject to the requirements of the National Environmental Policy Act (NEPA). The NEPA process requires that several alternatives be considered prior to the determination of a selected alternative and typically takes 2 to 3 years to complete. The Draft EIS included several alternatives for the project that were presented at three public hearings in May At the public hearings, VDOT representatives were available to answer questions and provide information and maps on the proposed road construction so that owners should be able to get an idea about how the project might affect their property. This Final EIS presents the Preferred Alternative and the reasons for its selection. After a Record of Decision is published by the Federal Highway Administration, final design and funding will be programmed. Purpose and Need 2. The alternatives in the Draft EIS do not solve the goals established to relieve congestion, fully analyze HOV benefits, or consider rail as an alternative. (1 commentor) Each of the final Candidate Build Alternatives would result in significant improvement in congestion when compared to future no-build conditions. Section 2.6 of the Final EIS includes a description of the periods of congestion, delays and travel times for each of the alternatives. The analysis does acknowledge that in the year 2020 the levels of congestion on the Beltway with the proposed improvements are comparable to those experienced today. However, the no-build conditions are significantly worse with up to 16 hours of congestion per day being forecasted. The evaluation of HOV lanes demonstrated several benefits, including: (1) completion of the regional HOV system, (2) improved express bus operation, (3) consistency with state, regional, and local transportation plans, (4) provision of 25% more person-capacity than general purpose lanes, and (5) consistency with regional plans to reduce emissions and improve air quality. See Section B.3 below for a detailed discussion of the rail transit studies conducted in the Beltway Corridor. B-3
396 Appendix B Capital Beltway Study Alternatives Development 3. The Draft EIS is a highway study that was completed in isolation instead of being a transportation system analysis. Not all reasonable alternatives were considered. (4 commentors) The Capital Beltway Study analyzed a specific corridor for a full range of transportation alternatives. The range of alternatives evaluated in detail included No-Build Alternative, a Transportation System Management alternative, and several build alternatives. The initial set of alternative concepts also included express bus service, non-hov roadway concepts, rail transit, and HOV roadway concepts. Some of these alternatives were not carried forward for further analyses in the Draft EIS because of specific inadequacies that reduced their ability to meet the purpose and need for the project. See Section 2.5 in the Final EIS for a more detailed description of the alternatives considered and eliminated from further study. Agency Coordination 4. The study does not adequately coordinate with Maryland s plan for the Beltway or involve regional coordination. (4 commentors + 1 post card campaign with 53 submissions) Chapter 7 of this Final EIS documents the extensive agency and public coordination that occurred during this study. A list of agencies and officials contacted during early coordination is included on page 7-2. Federal, state, regional, and local agencies were initially contacted in June 1998 as part of the study s scoping process and then continuously throughout the duration of the study. In addition, a multi-jurisdictional study team was formed at the beginning of the environmental review process and met on a regular basis. This study team included representatives from the Maryland State Highway Administration (the agency responsible for improvements to the Maryland portion of the Beltway) and the Metropolitan Washington Council of Governments (the agency responsible for regional planning). Enhancing mobility in the Beltway Corridor and adding capacity to the roadway has long been recommended in a number of long-range transportation and land use plans prepared by various local, regional, state, and Federal agencies. Current plans that generally endorse or recommend continuing improvements to the Beltway include the following: Fairfax County s Policy Plan, Fairfax County s Comprehensive Plan, the National Capital Region Transportation Planning Board s Transportation Vision Plan, and the National Capital Planning Commission s Comprehensive Plan for the National Capital. Long-range transportation and land use plans that specifically recommend implementing the Beltway improvements include Fairfax County s Comprehensive Plan, Fairfax County s Transportation Plan, B-4
397 Capital Beltway Study Public Comments and Responses the National Capital Region Transportation Planning Board s Update to the Financially Constrained Long-Range Transportation Plan for the National Capital Region, and the Northern Virginia Transportation Coordinating Council s Northern Virginia 2020 Transportation Plan. The Maryland State Highway Administration (MSHA) is currently studying transportation improvements to the Beltway in Maryland. Potential improvement options include the addition of HOV or express toll lanes to the Beltway, new transit alignments, and transportation system management/transportation demand management (TSM/TDM) strategies. Representatives from VDOT and MSHA continue to maintain close coordination to ensure compatible studies and designs. MSHA is currently in the alternatives analysis phase of the study. The terminus for the Virginia improvements at the American Legion Bridge allows for sufficient transition to any improvements the MSHA may advance. Other Projects or Studies 5. Support for Metrorail extensions to Lorton, Manassas, Dulles, and Tysons Corner. Support for the planning and building of a rail/mass transit system for Northern Virginia, including improvements and additions to Metrorail, VRE, MARC, and AMTRAK. (55 commentors) Comment noted. Currently, studies are underway for the extension of rail along the I-66 Corridor and the Dulles Corridor, which includes service to Tysons Corner. Rail service to Lorton and other communities in the region is under consideration and planning studies will continue in an effort to improve the rail/mass transit system in the metropolitan Washington area. 6. Virginia has conducted rapid rail studies that have shown its feasibility, but these are not mentioned in the Draft EIS. The studies concluded that rapid rail would move twice the people as a 12 lane beltway, at 1/6th of the cost. Maryland is going to build circumferential rail. (1 commentor) The feasibility of circumferential rail was studied in the Capital Beltway MIS (1997) and the Capital Beltway Corridor Rail Feasibility Study (May 2000). The findings of these studies were summarized in the Draft EIS (Section 2.2) and the Final EIS (Section 2.5). The findings of these studies indicate that there would be enough ridership to warrant inclusion of rail transit in the Corridor, but that the need for rail transit did not cause enough of a shift from vehicles to rail use to eliminate the need for roadway improvements. In addition, the Rail Feasibility Study noted that rail transit was not best suited within the right-of-way for the Beltway. Rather, the system needed to connect activity centers, such as Annandale, which are several miles distant from the Beltway. Maryland and Virginia are both now proceeding with planning level studies of rail transit in the Beltway Corridor. The projects would likely be two separate lines that would connect across the Potomac River. These independent studies are planned to continue at the planning level and more study is warranted to assess the feasibility of such a system. The Maryland State Highway Administration (MSHA) is currently studying transportation improvements to the Beltway in Maryland. Potential improvement options include the addition of HOV or express toll lanes to the Beltway, new transit alignments, and B-5
398 Appendix B Capital Beltway Study transportation system management/transportation demand management (TSM/TDM) strategies. Representatives from VDOT and MSHA continue to maintain close coordination to ensure compatible studies and designs. MSHA is currently in the alternatives analysis phase of the study. A Draft EIS may be issued in There are inconsistencies between this study and the Beltway Corridor Rail Feasibility Study. The Draft EIS underestimates rail ridership and the dynamic impacts of ridership when operated with a feeder system. (1 commentor) The Draft EIS and the Capital Beltway Rail Feasibility Study are two separate studies that assumed different base networks for the estimation of rail ridership. Despite these differences, both study teams concluded that a similar percentage of traffic would be taken off the Beltway. The Rail Feasibility Study assumed that there were billions of dollars more in transit improvements in the region compared to the Draft EIS, including rail to Tysons, Centreville, and Lorton. Even with the more aggressive assumptions, the Rail Feasibility Study still calculated only a six percent reduction in traffic on the Beltway with the expanded transit service in place. The Draft EIS reported a three percent reduction in Beltway traffic with a base network that included only the Purple Line, the rail improvements in the Constrained Long Range Plan, and an enhanced bus network. While this percentage represents ridership sufficient to support rail transit in the Corridor, it does not indicate that rail transit should be implemented instead of highway improvements. 8. What is the status of rail to Tysons? (1 commentor) The Virginia Department of Rail and Public Transportation (DRPT), in cooperation with the Washington Metropolitan Area Transit Authority (WMATA), Fairfax and Loudoun counties, and the Metropolitan Washington Airports Authority (MWAA), is planning to construct a 23.1-mile transit system in Fairfax and Loudoun counties, Virginia. A Final Environmental Impact Statement (Final EIS) for the project was issued by FTA in December The Project would extend the existing Metrorail system from the Orange Line (between the East and West Falls Church stations) in Fairfax County through Tysons Corner to Washington Dulles International Airport and beyond the airport to Route 772 in Loudoun County. Most of the extension would be constructed in the median of the Dulles International Airport Access Highway and Dulles Connector Road, but the alignment would also directly serve Tysons Corner and Dulles Airport. The extension would include 11 new Metrorail stations, a new rail yard on Dulles Airport property, and improvements to an existing rail yard at West Falls Church. This alignment was selected because it offers the highest ridership potential with the fewest impacts on residential areas and the natural environment. Because of federal funding limitations and the timing of local funding availability, DRPT intends to construct the LPA in two major phases. Phase 1 of the Project will complete the first 11.6 miles of the planned extension and include five new stations (Tysons East, Tysons Central 123, Tysons Central 7, Tysons West, and Wiehle Avenue). Metrorail service to Wiehle Avenue is scheduled to begin in DRPT began Preliminary Engineering on B-6
399 Capital Beltway Study Public Comments and Responses Phase 1 of the Project in October Phase 2 of the Project will complete the remainder of the LPA from Wiehle Avenue to Route 772 in Loudoun County. 9. The Draft EIS misstates the statistics on the impact of rail in the Beltway Corridor, by saying that rail would reduce Beltway traffic by less than 3% because daily traffic includes the period from 11pm to 6am, when rail would be shut down. Beltway rail could carry up to 72% of the people that travel on the Beltway in peak hour direction. (1 commentor) The MIS and Capital Beltway Rail Feasibility Study both show that if a rail system were built within the Corridor only 3 to 6 percent of persons driving on the Beltway would switch to rail. The MIS stated that the small reduction in Beltway traffic reflects latent demand and multiple link trips in current use. For each trip that is shifted to transit, others who desire to travel the Corridor would fill the offset. In addition, many trips that occur on the Beltway could not be served by transit because the Beltway is only one link in the trip. Similarly, the Capital Beltway Rail Feasibility Study found that 6 percent of drivers would switch to rail. Therefore, it is not a matter of what rail can carry but what it will carry. The findings of these studies indicate that both highway and rail transit improvements are warranted in the Corridor. However, an important conclusion of the Capital Beltway Rail Feasibility Study was that rail transit improvements would be more appropriate outside the right-of-way for the Capital Beltway so that activity centers could be directly connected. B.2 DRAFT EIS ALTERNATIVES General 1. Support widening or improving the Beltway. (18 commentors) Comment noted. 2. All of the alternatives studied in the Draft EIS are variations of the same alternative. (9 commentors). The Capital Beltway Study analyzed a specific corridor for a full range of transportation alternatives. The range of alternatives evaluated in detail included a No-Build Alternative, a Transportation System Management alternative, and several build alternatives. The initial set of alternative concepts also included express bus service, non-hov roadway concepts, rail transit, and HOV roadway concepts. Some of these alternatives were not carried forward for further analyses in the Draft EIS because of specific inadequacies that reduced their ability to meet the purpose and need for the project. See Section 2.5 in the Final EIS for a more detailed description of the alternatives considered and eliminated from further study. 3. Supports widening, but is opposed to any type of HOV. (4 commentors) Comment noted. To be consistent with regional, state and local transportation plans, as well as the purpose and need, all of the build alternatives included HOV lanes. The Preferred Alternative includes HOT lanes that can be used by high occupancy vehicles or vehicles paying a toll. The Washington, DC region has one of the nation s most extensive HOV roadway networks, and HOV B-7
400 Appendix B Capital Beltway Study facilities have been in operation in Northern Virginia since the 1960s. All of the radial freeways in Northern Virginia now have lanes dedicated to HOV use during peak periods. As a result, the region has the highest percentage of workers who carpool (16 percent) of any metropolitan area in the United States, and the second lowest percentage of residents who travel to work by singleoccupancy vehicle. Completion of the HOV lanes on the Beltway would connect the HOV elements already in place (I-95/I-395, I-66 and the Dulles Access / Toll Road), improve HOV access to major regional activity centers, and allow high-occupancy vehicles (carpools, vanpools, buses) to operate through the region without mixing with general-purpose traffic. 4. Four lanes should be added to the Beltway. (1 commentor). Comment noted. Traffic forecasts conducted in the initial phases of the study indicated that the Beltway would have to be expanded to 14 to 16 lanes to satisfy projected vehicle demand for the design year of Recognizing the significant right-of-way requirements and associated impacts associated with such a widening, Federal, state and local officials decided early in the study process, that the total number of lanes to be considered would be capped at 12 (or 4 more than the existing Beltway). 5. Opposed to alternatives because the data is inadequate (non-specific). (1 commentor) Comment noted. The data used to develop and analyze the various alternatives for their ability to meet the purpose and need and their social, environmental, and transportation effects was collected from standard sources used throughout the transportation, engineering, and planning professions. 6. Opposed to alternatives in general. (1 commentor) Comment noted. 7. Supports Beltway Improvements, but is opposed to all of the build alternatives. (1 commentor) Comment noted. In response to the comments from the general public and local governments, VDOT conducted additional study of the build alternatives presented in the Draft EIS to minimize impacts and reduce costs. Right-of-way impacts were reduced by minimizing shoulders and replacing physical barriers with painted stripes. In addition, high occupancy toll lanes were studied in response to a proposal submitted to VDOT under the Public Private Transportation Act. As a result VDOT developed six modified alternatives (each of the three original mainline concepts with and without HOT lanes). Two of the six were identified as the most promising, the 10-Lane Concurrent HOV and the 12-Lane HOT Managed Lanes. The Preferred Alternative documented in the Final EIS is the 12-Lane HOT Alternative. No-Build Alternative 8. Supports No-Build Alternative because: a. Of general support for No-Build Alternative. (45 commentors and 1 campaign with 52 signatures). Comment noted. B-8
401 Capital Beltway Study Public Comments and Responses b. Other alternatives will impact homes, personal property, and disrupt communities. (52 commentors). In response to the comments from the general public and local governments, VDOT conducted additional study of the build alternatives presented in the Draft EIS to minimize impacts and reduce costs. Right-of-way impacts were reduced by minimizing shoulders and replacing physical barriers with painted stripes. In addition, high occupancy toll lanes were studied in response to a proposal submitted to VDOT under the Public Private Transportation Act. As a result VDOT developed six modified alternatives (each of the three original mainline concepts with and without HOT lanes). Two of the six were identified as the most promising, the 10-Lane Concurrent HOV and the 12-Lane HOT Managed Lanes. These alternatives substantially reduced the natural and environmental impacts of the proposed improvements The Preferred Alternative documented in the Final EIS is the 12-Lane HOT Alternative. c. Other alternatives won t reduce congestion. (49 commentors) As shown in Section 2.6 of the Final EIS the No-Build Alternative would result in the highest amount of congestion (between 8 to 16 hours). All of the other alternatives studied, including the Preferred Alternative, would result in fewer hours of congestion than the No-Build Alternative. d. Other alternatives would cost too much. (14 commentors) In response to the comments from the public and local governments, VDOT conducted additional study of the build alternatives presented in the Draft EIS to minimize impacts and reduce costs. The Preferred Alternative documented in the Final EIS, the 12-Lane HOT Alternative, would cost significantly less than those studied as part of the Draft EIS (See Sections 2.2 and 2.5 of the Final EIS). e. Maryland is not planning for improvements to the Beltway. (13 commentors) The Maryland State Highway Administration (MSHA) is currently studying transportation improvements to the Beltway in Maryland. Potential improvement options include the addition of HOV or express toll lanes to the Beltway, new transit alignments, and transportation system management/transportation demand management (TSM/TDM) strategies. Representatives from VDOT and MSHA continue to maintain close coordination to ensure compatible studies and designs. MSHA is currently in the alternatives analysis phase of the study. A Draft EIS may be issued in f. Bottlenecks will be created at existing bridges. (13 commentors) The bridges at each of the ten Beltway interchanges between I-495/I-395/I-95 interchange and the American Legion Bridge will be modified to accommodate improvements to the Beltway mainline. In addition, new ramp connections will be incorporated to avoid queuing of traffic from the interchanges back on to the Beltway, as often occurs today. Potential bottlenecks at the American Legion Bridge (crossing of the Potomac River) will be minimized. Improvements are being coordinated with the MSHA and designed to provide a seamless connection with Maryland. B-9
402 Appendix B Capital Beltway Study g. HOV alternatives are not effective. (12 commentors) High Occupancy Vehicle (HOV) lanes have been demonstrated to be very successful in many urban areas across the country. In fact, the Washington DC region boasts some of the most successful HOV systems, including Shirley Highway (I-95/I-395) and Interstate 66. In congested corridors such as these, the HOV facilities provide 25% more personcapacity than general purpose lanes. h. Other alternatives would result in impacts to the natural environment. (13 commentors) Despite being located in a heavily urbanized area, the Beltway Corridor does contain natural resources and parklands. Alternatives were designed to avoid and/or minimize impacts to natural resources and parklands. Commitments to compensate for unavoidable impacts to natural resources and parkland are included in this Final EIS and will be incorporated into the Record of Decision and construction permits. i. Increasing capacity on the Beltway discourages other modes of transportation. (1 commentor) Improvements to the Capital Beltway are only one element in the solution to the region s transportation problems. In addition to improving safety and operation on the Beltway, the proposed improvements will also benefit other modes of travel. The addition of dedicated HOV lanes on the Beltway would improve express bus service by separating buses from the congested general-purpose lanes that they travel in today. Improved travel times would make the express bus service currently provided on the Beltway more attractive, encourage the initiation of new service on other suburb-to-suburb links, and promote transit connections among the I-95/I-66 and Dulles corridors. The Beltway is also an important highway link to other transportation modes, including three major airports (Reagan National, Dulles International, and Baltimore-Washington International) and two rail systems (Metrorail and Virginia Railway Express). Congestion on the Beltway increases travel times to these other facilities, which in turn decreases, traveler confidence in being able to travel to these facilities in a timely manor. Furthermore, Beltway congestion causes traffic diversions to other local roads, further compounding the overall reduction in regional mobility. Concurrent HOV Alternative 9. Supports Concurrent HOV Alternative because: a. General support for Concurrent HOV Alternative. (7 commentors) b. This alternative minimizes impacts. (5 commentors) c. Supports Concurrent HOV Alternative because barriers would make access to and from HOV lanes too restrictive. (1 commentor) d. Lanes could be converted to Non-HOV during off-peak use. (1 commentor) Comments noted. B-10
403 Capital Beltway Study Public Comments and Responses 10. Supports combination of Concurrent HOV Alternative with transit improvements. (1 commentor). Comment noted. Express / Local with HOV Alternative 11. Supports Express/Local with HOV alternative because: a. General support. (10 commentors) b. It appears to work on I-270 in Maryland. (5 commentors) c. It appears safer than other alternatives. (1 commentor) d. It matches the trip type. (1 commentor) e. Main line flow is better. (1 commentor) f. It could be used 24 hours a day/7 days a week. (1 commentor) Comments noted. 12. Opposes Express/Local with HOV alternative because: a. No reason. (1 commentor) b. Too expensive. (1 commentor) Comments noted. Barrier-Separated HOV Alternative 13. Supports Barrier-Separated HOV Alternative because: a. General support. (11 commentors) b. It appears safer. (6 commentors) c. It would make HOV enforcement easier. (2 commentors) d. It maximizes capacity. (1 commentor) Comments noted. 14. Opposed to Barrier-Separated HOV Alternative because: a. General opposition. (1 commentor) b. Barrier would make HOV access too restrictive. (1 commentor) Comments noted. B.3. OTHER ALTERNATIVES SUGGESTED Rail Transit 1. Support transit in Beltway Corridor a. Supports a Beltway rail line in the Corridor. (104 commentors, 1 campaign with 774 signatures 1 campaign with 89 signatures, and 1 campaign with 8 signatures) b. Supports Metro or Light Rail in Annandale, as well as along Gallows Road and/or Backlick Road. (4 commentors) B-11
404 Appendix B Capital Beltway Study c. Supports light rail in the Beltway Corridor. (19 commentors). d. Supports monorail in the Beltway Corridor. (5 commentors) e. Build circumferential rail underground. (4 commentors) Comments noted. The feasibility of rail transit was studied in the Capital Beltway MIS (January 1997) and the Capital Beltway Corridor Rail Feasibility Study (May 2000). The findings of these studies were summarized in the Draft EIS (Section 2.2) and the Final EIS (See Section 2.5). Several transit modes were studied on various alignments. The later study concluded four major recommendations for advancing transit within the Corridor. Two of the four are relevant to the Capital Beltway Study and are as follows: The effect of introducing rail transit in the Beltway Corridor does not remove the need for highway improvements, and It is not desirable to use the Beltway right-of-way to implement rail transit in the Corridor. However, any widening of the Beltway should be conducted so as to not preclude rail transit in the Corridor. VDOT will continue coordination with DRPT and WMATA to ensure that the Preferred Alternative is designed so that it won t preclude piers or structures to carry transit over the Beltway. 2. Supports Beltway light rail in combination with peak HOV left lane. (2 commentors) See response to Comment #1 above with respect to rail transit. Comment noted regarding the preference for the Concurrent HOV Alternative that was studied in the Draft EIS. 3. The Draft EIS does little to describe how VDOT will avoid precluding future rail in the Corridor or how impact to planned or existing transit alignments will be avoided. (1 commentor) Both the Draft EIS and the Capital Beltway Rail Feasibility Study were undertaken with the direction that any improvements to the Capital Beltway should be constructed so as not to preclude transit in the Corridor nor should the development of transit prevent widening of the Beltway. However, at this time, the designs completed for the Capital Beltway Rail Feasibility Study are only at a conceptual level. While the preliminary engineering has generally taken the concepts into consideration, specific details will not be available until more information is available. The Preferred Alternative would accommodate the Dulles Corridor Rapid Transit Project which is planned to cross the Capital Beltway on Alignment T6 at Route 123. VDOT will continue coordination with the Department of Rail and Public Transportation (DRPT) as the preliminary engineering of the rail transit improvements proceeds to ensure that the improvements planned by both study teams can be accommodated within the Route 123 interchange. In addition, the Preferred Alternative would not affect the existing Metrorail bridge for the Orange Line at the I-66 interchange. Construction would be planned and staged so that there will not be service interruptions on the Orange Line. Coordination with WMATA staff will continue throughout final design and construction. 4. Opposes Beltway rail line. (1 commentor) Comment noted. B-12
405 Capital Beltway Study Public Comments and Responses Tolls or High Occupancy Toll (HOT) Lanes 5. Supports conversion of general-purpose lane to HOT or HOV. (5 commentors) Based on the current and projected travel demand in the corridor, a reduction in the number of general purpose lanes is not recommended. In addition, conversion of an existing general purpose lane of traffic to HOV use has been attempted at various locations throughout the country and has always met with severe public protest. While it is true that either an HOV or HOT lane could increase the person throughput of the corridor and that some level of peak period congestion in the general purpose lanes is desirable in order to achieve effective utilization of the HOV or HOT lanes, a severe capacity constraint will only increase an already high level of cut-through traffic in neighborhoods adjacent to the Capital Beltway, contrary to the stated purpose and need of the project. Lane utilization (the percentage of vehicles in each lane) on a roadway can be significantly affected when lane use is designated by vehicle type or purpose. For example, on a freeway such as the Capital Beltway, which is a four-lane highway with no lane designations or barriers separating traffic flows, the lane utilization is approximately 25 percent in each of the four lanes under congested conditions. However, if one of these lanes was converted to an HOV lane, leaving only three general purpose lanes on the Beltway, then the lane utilization would not be evenly divided and the three general purpose lanes would probably carry the majority of the vehicles. Projections for HOV volumes on the Capital Beltway for the proposed alternatives during peak periods range between 750 and 1,400 vehicles per hour (vph). While the HOV lane is successful in the sense that it moves more people at free flow speed than the congested general purpose lanes, the vehicular capacity of a lane of traffic on a freeway is higher (for our studies we assumed a capacity of 1,700 vph at free flow speeds). Thus, HOT lanes are being proposed as a means to take advantage of the unused vehicular capacity to achieve additional throughput. There are significant challenges to implementing HOT lanes. From a travel demand and operations perspective, utilizing the surplus capacity without reducing the HOV volumes will be difficult. To achieve satisfactory operations, the lanes will require some form of separation from general purpose lanes, either with pavement striping or physical barriers. In some situations, HOT lanes can be accessed by simply changing lanes. However, in the case of the Capital Beltway, with interchanges spaced less than a mile apart and the high percentage of short trips (1 to 3 interchanges), access to the HOT lanes would be provided via direct access ramps or along the corridor at key locations. The design and location of access to and from either an HOV or HOT lane will be critical; insufficient access will leave the lanes underutilized. Too many access points may make it almost impossible to ensure free flow traffic and some locations will favor HOV over tolled users or the opposite. The lanes would be managed through pricing to maintain free flow conditions throughout the day, even during the peak periods, by using traffic information systems, such as variable message signs, to communicate travel conditions and price levels to non-hov vehicles. Thus, in the case of both HOV and HOT lanes, the simple conversion of a general purpose lane would not provide the direct access ramps and additional treatments necessary to safely enter and exit the system, particularly given the number of closely spaced interchanges within the 14-mile corridor, or to operate the system given the requirements of a HOT lane facility. In addition, the conversion would not correct the current safety and design deficiencies with the corridor. B-13
406 Appendix B Capital Beltway Study Outer Beltway 6. Supports study of outer Beltway or regional bypass. (59 comments, 1 campaign with 53 signatures). Since the circulation of the Draft EIS, VDOT has cancelled the Western Transportation Corridor Study (also referred to as the Outer Beltway). In addition, no responses were received to VDOT s recent request for interest in procuring the project through a Public-Private partnership. New Potomac River Crossing 7. Supports the study of or construction of a new Potomac River crossing northwest of the American Legion Bridge. (21 commentors and 1 campaign with 53 signatures.) Other At this time, no new Potomac River crossing or connection to similar roadways in Maryland is planned. New crossings that would be associated with bypasses around the D.C. metropolitan area would primarily serve through trips that do not begin or end in Fairfax County. 8. Supports building and/or improving other roads instead. (45 commentors, 1 Campaign with 113 signatures, and 1 Campaign with 53 signatures) Improvements to the Capital Beltway do not preclude other roadway improvements in the study area. However, the purpose and need for this study is to consider improvements specifically for the 14-mile portion of the Beltway between the Springfield Interchange and the American Legion Bridge. 9. Support for more bus and bus rapid transit along the Beltway. (20 commentors) Comment noted. The Preferred Alternative features HOT lanes which would also be used by HOVs and express buses. These lanes could also potentially be used by bus rapid transit vehicles in the future as well. 10. Supports package of multi-modal improvements to include with this project. (15 commentors) The recommended improvements to the Beltway would not preclude improvements to other modes in the study area or region. Multi-modal transportation will be improved based on the HOV improvements to the Beltway. 11. Supports truck lanes or truck bypass. (8 commentors) Alternatives that would provide designated lanes for trucks only were not considered to be a feasible or cost-effective alternative that would be capable of meeting the purpose and need for this study. 12. A balance of roads and transit should be considered. Build alternatives, plus rail or monorail - coupled with mass transit incentives would increase the maximum roadway capacity and extend the lifespan of the facility for several years. (6 commentors) B-14
407 Capital Beltway Study Public Comments and Responses Both rail and highway improvements have been studied as a part of this and other studies. The conclusion of the most recent study, the Capital Beltway Corridor Rail Feasibility Study (May 2000), indicate that both highway and rail improvements are warranted. The study also found that the rail transit was not best suited within the right-of-way for the Beltway. Rather, the system needed to connect activity centers, such as Annandale, which are several miles distant from the Beltway. Rail transit improvements would be provided in the Beltway Corridor as part of separate study as funding permits. 13. Supports improving other roads in addition to the Beltway. (6 commentors). This study focused only on improvements to the Beltway itself and interchanges that provide access to the Beltway. Improvements to the Capital Beltway do not preclude other roadway improvements in the study area and other improvements do not obviate the needs to improve the Beltway. 14. Supports smaller scale or focused improvements only. (6 commentors) A Transportation System Management (TSM) alternative was developed that would involve smaller scale actions such as upgrading existing arterial roadways, providing new or additional turning lanes, optimizing traffic signal timing, and enhancing the regional bus system. The evaluation of traffic, operational, safety, and environmental factors showed that the TSM alternative alone would not meet the project s purpose and need. Specifically, the TSM alternative would not reduce cut-through traffic on local roadways, fail to improve peak hour traffic volumes, and not address the Beltway s safety and design deficiencies. The revised alternatives contained in the Final EIS do represent substantial scaling back of the alternatives presented in the Draft EIS. 15. Supports elevated Beltway rather than widening. (6 commentors) An elevated Beltway would cost significantly more to construct and impose significantly greater noise and visual impacts than any of the alternatives studied in the EIS. 16. Supports improvements combining both mass transit and roads at "hot spots" including extending Metro down I-66 and to Tysons Corner and extending express buses from Metro rail terminal stations. (3 commentors) Comment noted. Studies are on-going for extension of Metrorail along I-66 from the Vienna Metrorail Station and into Tysons Corner, along the Dulles Toll Road and into Loudoun County from the West Falls Church Metrorail Station. Express bus service has also been implemented the Dulles and Beltway corridors. 17. Supports signal optimization / synchronization. (2 commentors) Signal optimization and/or synchronization are a part of the selected alternative. The level of service at any intersection has a significant effect on the overall operating performance of the roadway; thus, the existing signals and any new signals located along the crossing roadways within the study area would be optimized in order to achieve the most efficient traffic flow along the corridor. B-15
408 Appendix B Capital Beltway Study 18. Supports improvements to arterial and collector roads. (2 commentors) This study focused only on improvements to the Beltway itself and interchanges that provide access to the Beltway. Improvements to the Capital Beltway do not preclude other roadway improvements in the study area. 19. More emphasis should be given to Intelligent Transportation Systems on the Beltway, such as variable message signs on feeder roads. (2 commentors) Intelligent Transportation System (ITS) solutions, such as variable message signs (VMS), Highway Advisory Radio (HAR), closed-circuit television (CCTV) cameras for traffic management/vehicle detection/incident management, and vehicle detection capability (i.e. radar, video imaging, and loops), will be reviewed during the design and construction stage for possible implementation. These solutions will complement the proposed improvements but not obviate the need for them. 20. Supports ramp metering (2 commentors) Ramp metering is effective in regulating the number of vehicles entering a highway from on-ramps. This method queues vehicles on the ramps and back onto the local roadways and keeps the highway flowing as the merge points do not become severe bottlenecks. Currently, ramp metering is used in the I-395 and I-66 corridors during the peak periods in the peak direction of travel. Ramp metering has not been implemented on the existing Beltway, primarily due to the lack of space available for queued vehicles on the ramps, which are tight loop ramps in many locations, and because there is no one peak direction of travel in the morning or evening. The directional split of traffic on the Inner and Outer Loops is approximately 45/55% during the peak periods. In the morning, traffic is heaviest northbound on the Inner Loop from Springfield to Tysons and southbound on the Outer Loop from the American Legion Bridge to Tysons. In the evening, the situation is reversed. 21. The use of high-speed passenger boats for transport should be considered. (1 commentor) High-speed or other types of passenger boats were not identified as a reasonable alternative that would be capable of meeting the purpose and need for this study. However, VDOT received a grant from Congress in 1999 to study the feasibility of a high-speed passenger ferry service on the Potomac River. The study was completed in February More detailed information on the study can be viewed on VDOT s website ( 22. The speed limit should be increased or one lane with an unlimited speed allowance should be added to the Beltway. (1 commentor) The maximum design speed for the Beltway was determined based on safety and design criteria established by the American Association of State and Highway Transportation Officials (AASHTO). In general, the criteria are based on characteristics of the surrounding area, the functional class of the roadway, geography and terrain, and the total number of roadway lanes. In addition, a study of the 85 th percentile speed of drivers on the roadway B-16
409 Capital Beltway Study Public Comments and Responses helps to determine the appropriate speed limit. Selection of the 85 th percentile speed as the speed limit is recommended in order to match the desired safe speed of the majority of drivers so as to minimize the speed differential and the amount of lane changing on the roadway, which can lead to more accidents. Based on these criteria, a speed limit of 55 mph was recommended for this section of the Beltway. This speed is consistent with other similar roadways in the area. Based on AASHTO design criteria discussed above, safety concerns, and legality, an unlimited speed allowance on one or more lanes was not recommended. Speed variance is a leading cause of roadway accidents. Some speed variation may be acceptable on barrier-separated roadways, but without physical barriers, varying speed limits would pose operational (signing and enforcement) and safety (lane changing and confusion) problems within the Corridor. In addition, the maximum allowable speed limit in Virginia is 65 mph (see Code of Virginia Chapters through and for more information). 23. Supports non-hov reversible lanes. (1 commentor) Reversible lanes are used primarily in locations where the directional split of traffic is such that the majority, i.e., 70 to 80 percent, of vehicles are traveling in one direction, thereby justifying the additional capacity. For example, if traffic is traveling into a central business district, reversible lanes could be provided to increase the number of lanes inbound in the morning and outbound in the evening. On the Capital Beltway, however, there is no one peak direction in the morning or evening and the directional split of traffic on the two loops is approximately 45/55 during the peak periods. In the morning, traffic is slightly heavier in the northbound direction on the Inner Loop from Springfield to Tysons and in the southbound direction on the Outer Loop from the American Legion Bridge to Tysons. In the evening, the situation is reversed. 24. Supports recessed roadways and tunnels to reduce impacts. (1 commentor) During final design, revisions will be made to roadway designs intended to minimize any impacts from the project. During the development of alternatives, no locations or situations were identified that would necessitate or support the construction of recessed roadways or tunnels as a part of improvements to the Beltway. B.4 INTERCHANGE CONCEPTS General 1. Separate protected bikeways along the Beltway and safe bikeway crossings are needed. (40 commentors) The provision of protected bikeways and pedestrian paths would be addressed during the design phase of the project when the options are further defined and refined. With regard to crossings of the Beltway for bicycles and pedestrians, Fairfax County's position is that access will be provided at each location, and crossings that currently exist will be maintained during and after construction. Currently there are no dedicated facilities for pedestrians and bicyclists along the Beltway. B-17
410 Appendix B Capital Beltway Study 2. Existing pedestrian and bike crossings must be maintained during and after construction, including the W&OD Trail bridge and the Wakefield Americana bike bridge. (15 commentors) As part of the proposed improvements to the I-66 interchange, a new bridge carrying the W&OD Trail across the Beltway would be built. Staged construction of the bridge would ensure that pedestrian and bicycle crossings would be maintained at all times. The widening of the Beltway near Wakefield Park will require the reconfiguration and approach to the Wakefield Americana pedestrian/bicycle bridge. This crossing would be shut down for a short period during construction of the new park-side approach. Staged construction activities will be used at other locations as well so as not to completely disrupt pedestrian and bicycle movements during construction. 3. Interchange improvements are important. (5 commentors) Comment noted. 4. Supports smaller, less complicated designs. (2 commentors) While the plan views (footprint) of some of the proposed interchange concepts appear large and complicated, operationally, they are fully functional and very easy to navigate. Proper geometric designs as required by AASHTO guide lines including lane width, shoulder width, curve radii, grades, vertical clearance, transition lengths, auxiliary lanes, lane continuity and lane balance, as well as adequate signing and lighting have been proposed to improve safety and operational efficiency of the interchanges. Braddock Road (Route 620) 5. Northbound exit to Braddock Road should be a loop instead of a traffic light. (2 commentors) The traffic analysis indicates that a signalized intersection is the best option at this location. A review of the traffic volumes and a planning level analysis of the proposed intersection s operations suggests that a traffic signal would operate at acceptable levels of service. On the other hand, a loop ramp for this movement would create a weave section on the collector-distributor roadways and hence reduce the effectiveness of the entire interchange. 6. Traffic signals should be located further away from the Beltway. (1 commentor) The traffic signals at the intersections within the Beltway interchanges are required and recommended at those locations by the designers through their professional judgment and experience and are guided by the Manual on Uniform Traffic Control Devices, the industry standard used in the design of traffic signals that describes the requirements that must be met before an intersection is signalized. Generally speaking, the use of traffic signals is one of the most effective ways of controlling traffic at an intersection. They eliminate conflict by allocating time among conflicting movements of vehicles and pedestrians at an intersection. Since the use of traffic signals adds delay to all vehicles in the traffic stream, they are used only when necessary. And since the level of service at any intersection has a significant effect on the overall operating performance of the roadway, all existing signals and any new B-18
411 Capital Beltway Study Public Comments and Responses signals located along the crossing roadways within the study area would be optimized in order to achieve the most efficient traffic flow along the corridor. 7. Opposed to Interchange Concept E. (1 commentor) Comment noted. Little River Turnpike (Route 236) 8. Opposed to Interchange Concept B. (1 commentor) Comment noted. 9. Move traffic signals further from the Beltway. (1 commentor) The traffic signals at the intersections within the Beltway interchanges are required and recommended at those locations by the designers through their professional judgment and experience and are guided by the Manual on Uniform Traffic Control Devices, the industry standard used in the design of traffic signals that describes the requirements that must be met before an intersection is signalized. Generally speaking, the use of traffic signals is one of the most effective ways of controlling traffic at an intersection. They eliminate conflict by allocating time among conflicting movements of vehicles and pedestrians at an intersection. Since the use of traffic signals adds delay to all vehicles in the traffic stream, they are used only when necessary. And since the level of service at any intersection has a significant effect on the overall operating performance of the roadway, all existing signals and any new signals located along the crossing roadways within the study area would be optimized in order to achieve the most efficient traffic flow along the corridor. 10. Improve merge lane between Beltway and westbound Little River Parkway. (1 commentor) The merge lanes on the proposed designs have been improved to meet or exceed required AASHTO safety and operational standards. Gallows Road (Route 650) 11. Opposed to widening Gallows Road because of community impact. (9 commentors) This study does not propose the widening of the Gallows Road. Gallows Road widening is proposed as part of the Fairfax County Transportation Plan. The Capital Beltway Study only provides for a wider bridge for Gallows Road Bridge over I-495 to accommodate a possible future widening of the road as well as for the interchange ramps to transition to the existing roadway width. Since the Public Hearings a revised interchange concept was developed for the Gallows Road/I-495 Interchange to eliminate property impacts to the Holmes Run Acres neighborhood. B-19
412 Appendix B Capital Beltway Study 12. Concerned with confining and unsightly sound barrier proposed near Gallows Road interchange. Impacts access. (4 commentors) The revised design for the Gallows Road interchange does not include the sound barrier walls originally proposed along Gallows Road. Sound barrier walls are still proposed for areas adjacent to the Beltway, but the walls will not travel up Gallows Road as previously proposed. 13. Supports improvements to Gallows Road interchange including a longer entrance to 495 East. (1 commentor) The Candidate Build Alternatives meet or exceed the current minimum AASHTO and VDOT safety requirements. Long auxiliary lanes are provided to accommodate exiting, merging and weaving traffic. The number of exiting and merging movements has been minimized to the extent possible along the mainline. At this location, the auxiliary lane continues to meet the next interchange, rather than dropping off after the merge onto I Opposed to changes at Gallows Road intersection due to proximity to Woodburn Elementary for safety reasons. (1 commentor) Woodburn Elementary is located approximately 1,500 feet away from the Gallows Road interchange and thus will not be directly affected by the interchange construction. The Beltway project only includes improvements to Gallows Road where it connects with the Beltway. Modifications would properly integrate the proposed Beltway and interchange improvements with existing or planned designs and traffic patterns on Gallows Road. Arlington Boulevard (US 50) No comments. Interstate Supports Interchange Concept E. (32 comments) Comments noted. 16. Opposes Draft EIS proposals for Barbour Road Bridge. Supports other alternatives for Barbour Road bridge over I-66. (26 commentors and 1 Petition with 282 signatures) Since publication of the Draft EIS, design revisions have been made to each of the I-66 interchange concepts. Under the original design concepts, the Barbour Road bridge was to be replaced to accommodate the widening of I-66 beneath it. As a result, five residences on Barbour Road would be displaced. Under the interchange design selected as part of the Preferred Alternative, widening of I-66 transitions down to the existing roadway width before reaching the Barbour Road bridge alleviating the need for widening of the bridge structure. Under the Preferred Alternative the residences along Barbour Road would no longer be displaced. 17. Oppose improvements to I-66 interchange due to community impacts. (7 commentors) B-20
413 Capital Beltway Study Public Comments and Responses Comment noted. In response to the comments from the general public and local governments, VDOT conducted additional study of the build alternatives presented in the Draft EIS to minimize impacts and reduce costs. Right-of-way impacts were reduced by minimizing shoulders, replacing physical barriers with painted stripes, and reducing the scale of interchange improvements. 18. Improve badly designed merge areas and limited visibility/decision time at road signs. (1 commentor) The Preferred Alternative addresses many of the problems with the merge areas that currently exist along this section of the Beltway. Auxiliary lanes have been lengthened and in some locations, weaving movements have been eliminated to improve merging conditions. Locations of roadway signs will be reviewed in detail during the final design phase of the project. 19. Improve I-66 interchange. (1 commentor). Comment noted. The Preferred Alternative will include improvements to the I-66 interchange. 20. Do not build HOV-only ramps between Beltway and I-66 inside the Beltway. (1 commentor). Comment noted. HOV-only ramps encourage carpooling, which reduces the number of vehicles on the road. HOV-only ramps improve safety and congestion by eliminating the dangerous weaving movement that HOV traffic must make when crossing the generalpurpose lanes to access the general-purpose ramps. 21. Improve connections between I-66 East and I-66 West with Beltway. Eliminate the weaving which occurs between I-66 and Beltway exits at Tysons Corner. Reduce the size of the proposed connections at I-66 East interchange to minimize environmental impacts. (1 commentor) The proposed interchange has improved connections between the beltway and I-66 in both directions. Under the Preferred Alternative, the left hand exit ramps would be eliminated from the general-purpose lanes of the Beltway to address the weaving movements which currently take place. In addition, the scale of the interchange improvements has been reduced in response to public and agency comments to minimize impacts to the surrounding neighborhoods and environment. Leesburg Pike (Route 7) 22. Opposed to Interchange Concept B. (1 commentor). Comment noted. Chain Bridge Road (Route 123) No comments. B-21
414 Appendix B Capital Beltway Study Dulles Access/Toll Road (Route 267) 23. Widen the Lewinsville Road bridge over Beltway from 2 to 4 lanes. (1 commentor) The scope of the Capital Beltway Study included improvements to the Beltway itself and interchanges that provide access to the Beltway. Other structures, such as overpasses, that do not provide direct access to the Beltway were not considered for widening as a part of this study unless they were slated for widening as part of Fairfax County s Transportation Plan. 24. Improve exit from Beltway to Dulles Access/Toll Road. (3 commentors) Under the Preferred Alternative the exit from I-495 General Lanes (SB) to the Dulles Access/Toll Road (WB) will be similar to what exists today, including the addition of the second exit lane that is currently under construction. The exit from the general lanes (NB) to the Dulles Access/Toll Road (WB) will be modified to include a right exit lane from I-495. Access is also being provided from the HOT lanes in both directions to Dulles Access/Toll Road (WB). The I- 495 General Lanes (SB) exit to Dulles Access/Toll Road (EB) is also being revised to a right exit lane from I-495 and the alignment has been improved by increasing the radius of the ramp alignment. Access to Dulles Access/Toll Road (EB) from the I-495 Hot Lanes (SB) will be provided in approximately the same location of the current exit lane from I-495 (SB). 25. Opposed to Interchange Concept C. (2 commentors) Comment noted. 26. Opposed to Interchange Concept E. (1 commentor) Comment noted. 27. Discourage lane jumpers. (1 commentor) Comment noted. 28. Improve Toll Road/Route 236 interchange first. (1 commentor). The priorities and phasing of construction would be decided during final design. The phasing of construction would depend on a number of factors including but not limited to the extent of congestion at the particular interchange, safety problems, and funding availability. 29. Do not build the flyover ramp to Dulles Access Road East (northwest quadrant of interchange) because of impact on property values. (1 commentor) The fly-over ramp in question, provides access from the I-495 SB to the Dulles Toll Road EB for non-hot/hov traffic. The interchange will not be functional without this ramp. Georgetown Pike (Route 193) 30. Supports new exit at Old Dominion Drive and/or Lewinsville Road to redirect Georgetown Pike traffic. (1 commentor) B-22
415 Capital Beltway Study Public Comments and Responses The proximity of these two roads with the interchanges to Georgetown Pike and the Dulles Access/Toll Road would create an unsafe weaving condition on the Beltway. In addition, a new interchange at either location would require additional right-of-way that is not justified by the improvements that would be gained in terms of safety, traffic operations, and cost. George Washington Memorial Parkway No comments. B.5 TRAFFIC AND TRANSPORTATION Traffic Forecasts 1. The methodology for the study is flawed because it is based on non-peak hour traffic. (5 commentors). During preparation of the Capital Beltway Study it was acknowledged that congestion would be similar during peak hour traffic for any of the proposed alternatives. During the AM and PM peak hours, the mainline operates at Level of Service F throughout most of the Corridor for every alternative, and comparing them during these two hours of the day would not provide enough information to differentiate their effectiveness in handling traffic efficiently and safely. Given the high volumes in the Corridor, queues form, which triggers changes in demand and service volumes in the hours leading up to and following the peak hour. Therefore, demand volumes for five hours in each of the morning (5 AM to 10 AM) and evening (3 PM to 8 PM) peak periods were studied to sufficiently evaluate Beltway traffic. Operational performance was described for the AM peak period, PM peak period, and midday (10 AM to 3 PM) for each of the alternatives. Measures such as hours of congestion, queues and operating speeds, delay and travel times, and daily throughput were used to compare the alternatives. During the grouped five-hour periods, the measures were different enough to allow for reasonable comparison. 2. The Draft EIS misstates the impact of rail. The Draft EIS says rail will reduce traffic on beltway by less than 3%. They mean of course, includes the period from 11pm to 6am when rail would not be operating. Light rail could carry up to 72% of people that travel on beltway in peak hour direction. (2 commentors) On the Beltway, vehicular traffic demand on a daily basis, which includes the peak periods, would be reduced by less than 3 percent with the implementation of rail transit. The circumferential rail line showed a potential ridership of about 60,000 home-based work trips per day when forecasts were made using the approved regional transportation model and several assumptions meant to help identify maximum potential. This service would have a low impact on peak period traffic volumes and congestion on the Beltway lanes would be reduced by about one-quarter hour. It is important to recognize that even if the ridership on the rail line at the highest load point (most likely during the peak periods) may be higher than the equivalent of 3 or 30 percent B-23
416 Appendix B Capital Beltway Study of vehicular traffic, only a portion of these rail trips would be diverted from the Beltway. In other words, one rail trip does not mean one less Beltway trip. 3. A 10 or 12-lane highway only maintains the current level of service. Need to develop alternatives that allows for future needs. (2 commentors) Improvements to the Beltway would serve not only to increase the Beltway s capacity to remedy current congestion and accommodate expected growth, albeit not through the year 2020, but also to address design deficiencies of the roadway and operational and safety problems within the Corridor. As a secondary function, the additional capacity would serve to draw back diverted traffic that ordinarily would cut through local roadways in an attempt to avoid the Beltway. Today, many of the parallel routes along the Beltway experience severe congestion during the peak periods as commuters attempt to find alternate pathways to their destinations. These local roadways were not designed to carry the increased traffic, leading to safety and operational problems on those facilities. The maximum of 12 lanes on the highway was established to minimize the environmental impacts of the Beltway widening. Widening any more than 12 lanes would involve acquiring a significant amount of additional right-of-way to accommodate the lanes, thus drastically changing the existing character of the Corridor. 4. The study should have addressed the impacts of induced travel on the beltway because if you build more lanes, more traffic will result. (2 commentors) The possible impact of induced travel was considered and included within the study process and methodologies used to develop traffic projections. Induced travel is generally considered to be additional travel on a roadway caused by additional capacity improvements. Induced travel effects may include route switches made by drivers, additional travel generated by new developments facilitated by the roadway improvements, or by drivers choosing to make more trips because of decreased congestion. For this study, the impacts caused by route switching were factored into the traffic modeling process. The traffic model recognizes that some drivers would choose to divert trips that would use other adjacent streets onto the Beltway. Likewise, if planned improvements to the Beltway are not completed, drivers may seek alternate routes to the Beltway due to congested conditions resulting in induced travel on other roadways within the study area, including cut-through routes in neighborhoods located along the Beltway. The potential for additional adjacent development on the Beltway as a result of capacity improvements is lower than would be expected for relatively undeveloped areas. Forecasts for future development in the study area were based on regional land use planning efforts by local jurisdictions and data produced by the Metropolitan Washington Council of Governments (MWCOG) and is included in the forecasting process. MWCOG s travel demand model is based on several land use factors, such as employment and population levels and includes planned roadway expansions in the region, including widening the Beltway to 10 lanes from the Dulles Toll Road to the American Legion Bridge and HOV improvements the entire section of the Beltway included in this project. Specific improvements to the Beltway that were included in the transportation demand model are listed in Table 2-6 in the Final EIS. B-24
417 Capital Beltway Study Public Comments and Responses Induced demand based on other types of travel behavior, such as making additional trips due to lower congestion is more difficult to estimate due to lack of available data and has not been conclusively proven to occur. 5. The Draft EIS states that Beltway traffic would only be reduced by 3% but this did not include peak traffic, which may be reduced up to 30%. There are different data methodologies used with modes. (1 commentor) On the Beltway, vehicular traffic demand on a daily basis, which includes the peak periods, would be reduced by less than 3 percent with the implementation of rail transit. The circumferential rail line showed a potential ridership of about 60,000 home-based work trips per day when forecasts were made using the approved regional transportation model and several assumptions meant to help identify maximum potential. This service would have a low impact on peak period traffic volumes and congestion on the Beltway lanes would be reduced by about one-quarter hour. It is important to recognize that even if the ridership on the rail line at the highest load point (most likely during the peak periods) may be higher than the equivalent of 3 or 30 percent of vehicular traffic, only a portion of these rail trips would be diverted from the Beltway. In other words, one rail trip does not mean one less Beltway trip. 6. How much traffic per day was the Beltway designed to handle when it was built and how much does it actually hold today. (1 commentor) The capacity of a single freeway lane is approximately 2,200 vehicles per hour. The Capital Beltway was first opened to traffic in 1964 and originally consisted of 2 lanes in each direction. Between 1974 and 1977, the Beltway was expanded to 4 lanes in each direction. Therefore the capacity of the original Beltway was approximately 4,400 vehicles per hour in each direction. The capacity of the existing beltway, with four lanes in each direction is approximately 8,800 vehicles per hour in each direction. Existing demand volumes on the Beltway often exceed 9,000 vehicles in one hour, resulting in congestion and backup of vehicles over time. Forecasts for the year 2020 indicate a 30 to 40 percent increase. Traffic Operations 7. The EIS must address impacts on feeder roads to the Beltway. (6 commentors) The impact of Beltway improvements on feeder roads was taken into consideration in three ways during the study process: physically, operationally, and based on travel demand. Physically, the project would include improving portions of the 10 roadways that connect to the Beltway via the existing interchanges. Modifications to these roadways would properly integrate the proposed Beltway and interchange improvements with existing or planned designs and traffic patterns on these other roadways. Operationally, the build alternatives would improve traffic conditions on feeder roads by reducing the amount of cut-through traffic. Feeder roads serve several purposes, including providing access and egress for beltway traffic, accommodating non-beltway trips, and B-25
418 Appendix B Capital Beltway Study accommodating traffic trying to avoid the Beltway in certain locations (cut-through traffic). Widening the Beltway will improve traffic flow on the Beltway, which would reduce the need for alternative or cut-through routes serving the same travel purposes as the Beltway. Finally, in terms of travel demand, the impact of the feeder roads was considered by constraining demand forecasts to reflect the ability of the local roadway network to feed the Beltway. The analysis found that peak hour travel demand exceeds the ability of the highway system to process the peak hour volumes of traffic. While capacity on the Beltway would increase as a result of improvements, there is little opportunity for additional capacity on the crossing arterials. Thus, in 2020, the hourly volumes reaching are Beltway are constrained, or limited, by the arterials and the existing road network feeding the interchanges within the study corridor. Initially, peak hour forecasts were prepared to represent demand in the corridor (i.e., any vehicles desiring to use the roadway were given the ability to do so). Then, to account for the network constraints, the demand forecasts were modified based on the capacities of the crossing arterials east and west of the Beltway. In other words, constrained forecasts were prepared to more realistically represent the volume of traffic that would be able to get to the Beltway during the peak hour. These forecasts of constrained demand were then used to develop the Candidate Build Alternatives and proposed interchange improvements. 8. There is no discussion on the width of travel lanes, breakdown lanes, clearing snow on elevated ramps, and emergency evacuation (incident management). Lanes shouldn't be less than 12 feet. (6 commentors) The Preferred Alternative would be built to meet current design standards, which dictate that travel lanes will be no less than the standard width of 12 feet on the Beltway. Shoulders will also be provided at the standard widths of 10 to 12 feet. In addition to serving as refuge areas for vehicles, the shoulders also provide access to incidents for emergency vehicles. Higher capacity on the Beltway will result in improved response time for emergency service providers in the case of the Preferred Alternative. Resources are available to clear snow on elevated ramps as necessary. 9. Barrier-separated roadways may cause more congestion and safety problems because people are not familiar with them. (1 commentor) The number of weaving and merging maneuvers, which contribute to congestion, will be decreased through the selective use of direct connections at high-volume entrances and exits (or for special purposes, such as HOV connections). In addition, vehicles that generally make discretionary road changes (changing lanes due to slowing traffic) would be reduced because the Beltway would have a smoother flow. The nearby I-95/I-395 Corridor currently has a 27-mile reversible barrier-separated roadway from Route 234 in Prince William County to between Route 27 and Eads Street in Arlington. North of the Route 27/Eads Street area, there are separate lanes for northbound and southbound traffic up to the Rocheambeau Bridge. Unlike the section of the Beltway currently under study, this highway serves regular northern Virginia traffic, commuters, and interstate traffic not familiar with the system. However, with the use of appropriate signage B-26
419 Capital Beltway Study Public Comments and Responses and standard design, it has proven to be a successful barrier-separated system, serving to reduce congestion and increase the person-carrying capacity of the roadway. 10. We need to know something about why people are choosing to use the Beltway as distinct from other alternatives if they were made available (1 commentor) Safety The travel forecasting and screening process for all alternatives was based on extensive data and evidence on travel decisions known to affect mode choice and route selection that included population and employment densities, trip lengths, and travel times. The Draft EIS analyzed the existing trips on the Beltway, which showed that most of the trips are locally oriented and thus, much of the use of the Beltway is for local trips. 11. Statistically rail is safer than highway travel. Highway accident numbers will increase because of more vehicles on bigger highway. Should conduct cost/benefit analysis on reduced accidents from rail use, compared with additional highway lanes. (1 commentor) While it is true that travel demand forecasts indicate that there will be more vehicles on the highway by the year 2020, the number of accidents per 100 million vehicle miles of travel, or the accident rate, is expected to be lower because the factors that contribute to a large majority of the accidents on the Beltway today will be mitigated or eliminated altogether. The accident rate on this portion of the Beltway has increased steadily in recent years, primarily due to increases in congestion, and will continue to rise as long as congestion becomes more severe. In addition, crashes are caused by ramps with entrances and exits on the left, substandard acceleration and deceleration lanes, tight loop ramps, and closely spaced interchanges. The Preferred Alternative would both reduce congestion and eliminate most of the existing substandard design issues The project is supposed to increase safety but increasing speed on Gallows Road won't do this. (1 commentor) This project does not involve plans to increase speed limits on Gallows Road. Physically, the project would include improving portions of the ten roadways that connect to the Beltway via the existing interchanges. Modifications to these roadways would properly integrate the proposed Beltway and interchange improvements with existing or planned designs and traffic patterns on these other roadways. 13. Driving on Beltway is stressful with confusing signs and lane complexity, increasing number of rules and restrictions, large number of cars changing lanes, and cars entering from either side. (1 commentor) Construction of the Preferred Alternative would improve traffic operations and eliminate substandard design issues, which largely contribute to the confusion on the roadway. Currently there are exits and entrances on the left, substandard acceleration and deceleration lanes, tight loop ramps, and closely spaced interchanges. B-27
420 Appendix B Capital Beltway Study HOV Lanes and Access 14. The HOV to non-beltway intersections at Braddock Road appear to generate gridlock. (2 commentors) Both intersections within the Braddock Road interchange, just east and west of the Beltway, will require detailed planning/signal timing to ensure smooth traffic progression along eastbound and westbound Braddock Road and to prevent congestion on the ramps and ramp spurs where left turn movements are provided. 15. Have access and egress issues for emergency vehicles and school busses, which serve the Iliff Nursing and Rehabilitation Center been taken into consideration? Would the facility be impacted? (1 commentor) The Preferred Alternative would improve access and egress to the Iliff Nursing and Rehabilitation Center. However, temporary detours may be required for limited periods during construction. 16. The Draft EIS should address emergency vehicle access. (1 commentor) Transit Emergency vehicle access and response time would be substantially improved due to construction of any of the Preferred Alternative. In congested corridors, emergency vehicles responding to incidents must navigate through the traffic queue formed following the incident. 17. HOV is not equivalent to mass transit. (1 commentor) Comment noted. High Occupancy Vehicle (HOV) lanes are lanes with restrictions based on the number of occupants per vehicle (e.g. vehicles with only one or two persons can generally not use HOV lanes, unless the restriction is lifted during certain times). Mass transit is generally public transportation that includes such modes as local bus, express bus, bus rapid transit, streetcars, light rail transit, rail rapid transit, and commuter rail. HOV lanes do however provide priority conditions for many mass transit vehicles, such as express busses. Bicycle and Pedestrian Issues 18. Pedestrian & Non-Motorized Issues are not discussed. (1 commentor) Section of the Final EIS includes a discussion of recreational trails located in parklands along the Beltway that are used for pedestrian, bicycle, or other forms of non-motorized travel. Regional Transportation Planning 19. Need a regional transportation authority (DC, MD, VA) for decisions, in order to develop a balanced system of transportation, including roads, transit, railroads, and air. (7 commentors) B-28
421 Capital Beltway Study Public Comments and Responses The National Capital Region Transportation Planning Board (TPB) is the designated Metropolitan Planning Organization responsible for coordinating, planning, and prioritizing transportation improvements in the metropolitan Washington region, which includes local governments and agencies in Virginia, Maryland, and Washington, D.C. The TPB annually updates a Financially Constrained Long-Range Transportation Plan for the National Capital Region, which includes major highway projects, major transit projects, HOV projects, transportation related studies, and bicycle/pedestrian projects. The Plan is constrained to include only those projects that can be funded and operated by revenues that are "reasonably expected to be available", as required by Federal law and regulations during a 25 year period. 20. We need an adequate transportation plan for the area, which includes this section of the Beltway, parts of Maryland and the District before we attempt to study the Beltway (1 commentor) The official long-range transportation plan for the National Capital Region or the Constrained Long Range Plan (CLRP) is prepared by member jurisdictions, which include the District of Columbia and surrounding areas of both Virginia and Maryland. The CLRP identifies the capital improvements, studies, actions, and strategies that the region proposes to carry out by the year It is financially constrained to include only projects that the region can afford to build and operate during the period. The plan is updated at least every three years. Widening the Beltway to 10 lanes from the Dulles Toll Road to the American Legion Bridge and HOV improvements for the entire section of the Beltway included in this project are both included in the CLRP. Additionally, several jurisdictions, including Fairfax County, coordinate to prepare a transportation plan for Northern Virginia. The Northern Virginia 2020 Transportation Plan identifies many of the projects that are later adopted into the CLRP for the National Capital Region. Both of these plans are developed through processes involving the public. 21. Northern VA needs a year urban plan. The Northern Virginia Transportation Coordinating Council s Northern Virginia 2020 Transportation Plan is one of a number of long-range transportation and land use plans that guide the development of the region s transportation infrastructure. The Council is an advisory group of locally elected officials from 13 northern Virginia jurisdictions and the Virginia General Assembly that serves as a caucus on recommending regional transportation priorities and funding allocations. The recommendations in the Plan, endorsed by resolutions from 13 localities within the region, call for 10 general-purpose lanes and 2 HOV lanes on the Beltway and reconstruction of all 10 interchanges within the project limits. System Connectivity 22. How will the project connect to Maryland, where rail is planned for the Maryland section of the beltway? Will there be a transfer? (1 commentor) In order to maintain lane continuity and achieve proper lane balance between the improvement alternatives and the existing American Legion Bridge, the improvement B-29
422 Appendix B Capital Beltway Study alternatives begin the transition north of Route 267/I-495 Interchange. Transitions are designed such that lane drops and or pickups meet current AASHTO and VDOT geometric design guidelines and traffic operation requirements. The Maryland State Highway Administration (MSHA) is currently studying transportation improvements to the Beltway in Maryland. Potential improvement options include the addition of HOV or express toll lanes to the Beltway, new transit alignments, and transportation system management/transportation demand management (TSM/TDM) strategies. Representatives from VDOT and MSHA continue to maintain close coordination to ensure compatible studies and designs. MSHA is currently in the alternatives analysis phase of the study. A Draft EIS may be issued in The project does not consider the connection to the mixing bowl (Springfield Interchange). (1 commentor) Connection to the Springfield Interchange, the logical terminus for this project, was considered during this study. The purpose and need for the Capital Beltway Study included improving system linkage, primarily by improving regional HOV connectivity. All of the build alternatives for the Capital Beltway would connect to HOV elements proposed as part of Phase VIII of the Springfield Interchange. Upon the completion of the Springfield Interchange project, all the merges will have been finished and the new interchange would meet or exceed current minimum AASHTO and VDOT standards. B.6 ENVIRONMENTAL IMPACTS General Environmental 1. The project should minimize environmental impacts. (8 commentors and 1 petition with 282 signatures) In response to the comments from the public and local governments, VDOT conducted additional study of the build alternatives presented in the Draft EIS to minimize impacts and reduce costs. As shown in Table 2-5 in the Final EIS, implementation of the Preferred Alternative would result in far fewer environmental effects than the Candidate Build Alternatives studied in the Draft EIS. 2. Will the expansion of the Beltway lead to increased air pollution and negative health effects? (5 commentors) Land Use Expansion of the Beltway will not lead to increased air pollution or negative health effects. As illustrated in Section 4.6 of the Final EIS, overall air quality will be improved under any of the build alternatives in comparison with a no-build scenario. Likewise, the project cannot be approved by FHWA until it is part of a CLRP that has been found to conform to the State Implementation Plan for the region, which has been developed to address the regional air quality problems. 4. Changes to existing land use at transit stops, which include higher density mixed-use land use concentrated around transit stations with pedestrian and bicycle design elements are needed to solve regional transportation problems. (8 commentors) B-30
423 Capital Beltway Study Public Comments and Responses Fairfax County implemented such changes to its Comprehensive Plan in support of the planned transit stations in Tysons Corner and along the Dulles Toll Road for Dulles Corridor Rapid Transit Project. 5. Secondary development or sprawl needs to be contained by local jurisdictions through control of land use development that is better coordinated with transportation decisions (e.g. forcing developers to provide transportation infrastructure with developments and selectively prohibiting new development). (5 commentors) Control of land development is within the authority of local governments and generally is accomplished through land use planning and zoning functions. Local governments have authority over development approval and in some cases may require developers to provide additional infrastructure or funding for improvements as a condition of approval for new development. 6. Widening the Beltway will lead to more sprawl (low-density, single use) development. (4 commentors) The Beltway Corridor is already very heavily developed. In fact, complete build out is expected by 2020 with or without the project. Because most Beltway traffic is locally generated, improvements to the Capital Beltway would likely promote reinvestment in already developed areas currently planned for growth, such as Merrifield and Tysons Corner. 7. Aerial photography of the study area is not current. Recent developments are not shown in the photography and were not considered due to the date of the photography. (2 commentors) Aerial photography for the study area reflects conditions in the Fall of 1998 when the study initiated. Additional development that occurred after the aerial photographs were prepared was accounted for in the analysis presented in the Draft EIS. Recent developments were identified and considered based on review of approved developments available from Fairfax County. These developments were verified by field inspections to fully assess the existing development status. These updates were included in the project plan sheets which were used for the engineering design and impact assessment. Plans for future development in the study area were also considered through a review of the County s comprehensive plans, as well as meetings with local property owners and developers. 8. Each of the build alternatives in the Draft EIS would diminish the prospects for achieving the mixed-use environment near the potential Tysons Central Rail Station by taking away some of the areas closest to that station that are available for pedestrian friendly development and redevelopment. (1 commentor) The proposed site for the Tysons Central Rail Station is located on the north side of Route 123, between Tysons Corner and Tysons Galleria malls. It would be located on parcels that are currently undeveloped. The area that would be required for Beltway improvements from these parcels is very small and would have a minor effect on the proposed station design. B-31
424 Appendix B Capital Beltway Study 9. The EIS needs to include an analysis of the interrelated effects of combining road improvement scenarios with alternative transportation modes and alternative land use patterns. (1 commentor) The Draft EIS was prepared using the best analysis of existing and future land use patterns available. Local comprehensive plans and projections for future population and employment growth, based on data produced by Fairfax County and the Metropolitan Washington Council of Governments (MWCOG), was used to predict future land use. To avoid limitless future land use alternatives, VDOT has only considered the approved land use plans provided by MWCOG and Fairfax County. Alternatives involving alternate land use patterns are beyond the ability of FHWA and VDOT to implement and as such are not considered reasonable. The Transportation Coordinating Council (TCC) of Northern Virginia and the Virginia Department of Transportation (VDOT) published a study entitled, Alternative Transportation and Land Use Activity Strategies Study in March That study includes an analysis of the relationship between land use and transportation in northern Virginia and discusses several methods for coordinating land use and transportation decisions. Right-of-way / Displacements / Property Values 10. The Draft EIS involves the replacement of the Barbour Road bridge at a new location that would displace several homes. Please explain why the bridge is proposed on a new location and cannot be built in the same location. (8 commentors + 1 petition with 282 signatures) Since publication of the Draft EIS, design revisions have been made to each of the I-66 interchange concepts. Under the original design concepts, the Barbour Road bridge was to be replaced to accommodate the widening of I-66 beneath it. As a result, five residences on Barbour Road would be displaced. Under the interchange design selected as part of the Preferred Alternative, widening of I-66 transitions down to the existing roadway width before reaching the Barbour Road bridge alleviating the need for widening of the bridge structure. Under the Preferred Alternative the residences along Barbour Road would no longer be displaced. 11. The Draft EIS specifically identifies the Gannett headquarters property on page 4-77 and states that new development is not expected to contribute to the cumulative effects of the project. The project, specifically concepts B and E result in additional ROW requirements that have a number of negative impacts, including impacting the existing service drive between the parking structure and Dulles Toll Road, the fire lane, existing landscaping that provides a barrier to the beltway, and a storm water management pond owned by the West Group. (3 commentors) The Preferred Alternative does not impact the service drive, the fire lane, or the storm water management pond and the impact on the landscaping has been significantly reduced. However, a small sliver of the property will need to be acquired (less than 500 square feet). 12. The Capital One Corporation s headquarters is currently under development and under construction. The building is worth approximately 150 million dollars. Interchanges, which affect these buildings, would drive up Beltway project acquisition costs considerably. (2 commentors) B-32
425 Capital Beltway Study Public Comments and Responses The Preferred Alternative will not affect this building or the parcel it sits on. 13. If the project negatively impacts my property, through increased noise or visual impact and doesn t involve a taking will I be compensated in some way? (2 commentors) The noise and visual effects of the Preferred Alternative and any necessary mitigation measures are identified in Sections 4.7 and 4.8 of the Final EIS. If it is determined that noise or visual impacts will result from implementation of a specific alternative, mitigation or enhancement measures such as sound barriers ("noise walls") will be considered to reduce or avoid adverse environmental impacts. 14. Has the study team considered the effect of the project on removing low cost housing and how those people displaced will find affordable housing? (2 commentors) In response to the comments from the public and local governments, VDOT conducted additional study of the build alternatives presented in the Draft EIS to minimize impacts and reduce costs. As a result, several apartment buildings with moderately priced rents will no longer be impacted by the project. VDOT tries to minimize any inconveniences caused by relocation. VDOT s goal is to offer displaced people the opportunity to relocate to a comparable replacement home. The replacement house must meet certain standards including state and local building, plumbing, electric, housing, and occupancy codes. VDOT appraises the property to be acquired at market value. If replacement housing cannot be found for that value, then additional money (a Relocation Housing Payment) is made available, provided it is spent in the acquisition of replacement housing. Based on a review of real estate advertisements, observation of for-sale signs, and the ongoing construction of new homes in the area, replacement housing is available that is similar to the housing stock which would be displaced if the Preferred Alternative is implemented. 15. The proposed connection and exit ramps from I-495 to I-66 would take property affecting the Iliff Nursing and Rehab Center and the Renaissance Pediatric Unit. Have access and egress for emergency vehicles and County school buses, both of which come into the facility on a daily basis been considered? (1 commentor) Access to the property is provided by Iliff Drive to Ithaca or Sanburg Street, all of which are located north or west of the property. Access and egress to the Iliff Nursing and Rehabilitation Center and Renaissance Pediatric Unit will not be affected under the Preferred Alternative. The impacts to this property were eliminated as a result of public comments regarding the degree of impacts to the social environment. 16. Table 4.2 of the Draft EIS shows 39 residences being lost in the Tysons Corner area. It is not clear where the affected residences are. The EIS should state the location of these residences. (1 commentor) The Draft EIS consisted of two volumes. The second volume contained plan sheets (on aerial photographs) which reflected the engineering designs for each alternative. The Volume II sheets indicated the proposed right-of-way lines for each of the Candidate Build Alternatives and thus B-33
426 Appendix B Capital Beltway Study provided the reader with an indication of which properties are directly affected. The actual calculation of direct impacts such as residences lost were determined from the detailed engineering plans and reported in the Draft EIS. Detailed right-of-way plans with potentially displaced residences indicated were available at the public hearings. These plans were accompanied by an index of actual street addresses. Following the public hearings, these large scale maps were available for review at VDOT s Northern Virginia District Right-of-Way office. 17. If my house is condemned, will I be able to stay in that area so my kids can attend the same school? (1 commentor) VDOT tries to minimize any inconveniences caused by relocation. VDOT s goal is to offer displaced people the opportunity to relocate to a comparable replacement home. The replacement house must meet certain standards including state and local building, plumbing, electric, housing, and occupancy codes. VDOT appraises the property to be acquired at market value. If replacement housing cannot be found for that value, then additional money (a Relocation Housing Payment) is made available, provided it is spent in the acquisition of replacement housing. Since the Draft EIS, relocation impacts have been substantially reduced. 18. What will happen to the power station and power lines off Gallows Road if 495 is widened? (1 commentor) Air Quality The substation and towers at the Gallows Road Interchange will not be affected under the Preferred Alternative. 19. The Draft EIS claims that the build alternatives will not worsen air quality. How is this possible, if capacity is increased while congestion remains the same? (5 commentors) In general terms, while a widened Beltway will have a higher volume of vehicles, it will not necessarily lead to more overall vehicles on the roadway network in the northern Virginia area. When widened, the Beltway will allow for shorter overall commutes for vehicles and a reduction in the number of vehicles accessing side streets to cut through neighborhoods. A wider Beltway would allow vehicles to reach destinations in a shorter amount of time, translating to lesser amounts of pollution. Likewise, an increase in vehicles in the corridor doesn t necessarily translate to more pollutants. With improvements in technology and increases in vehicle control the amount of pollutants being emitted by mobile sources is decreasing. More specifically, the project-specific atmospheric concentrations of carbon monoxide (CO), the predominant pollutant emitted from gasoline-powered motor vehicles, were determined for the ten closest worst-case roadside sites in the Beltway Corridor for the base (existing year) conditions, the No-Build Alternative, the three Candidate Build Alternatives, and the Preferred Alternative. Worst-case assumptions and inputs were used in the analysis, including peak hour traffic volumes. The estimated CO concentrations were found to be well below the National Ambient Air Quality Standards (NAAQS) 35 parts per million (ppm) for one-hour concentrations and 9 ppm for eight-hour concentrations. As demonstrated in Table 4-6b in the Final EIS, CO concentrations for the Preferred Alternative will improve at 9 of the 10 sites when compared to existing conditions. Future congestion under the Preferred Alternative (or any of the Candidate Build Alternatives studied as part of the Draft EIS) would be much less B-34
427 Capital Beltway Study Public Comments and Responses than in the No-Build Alternative although, as acknowledged, it would be similar when compared to existing conditions. Therefore, while congestion will remain the same and as such not worsen air quality, under the No-Build Alternative, congestion will be worse than existing conditions in the design year leading to worse air quality. 20. All three of the build alternatives would have enormous effects on air pollution with minimal improvement to capacity. (1 commentor) See the previous response. The vehicle and person-carrying capacity of the Beltway will increase substantially with the implementation of the Preferred Alternative. Although a wider Beltway will have a higher volume of vehicles, it will not necessarily lead to more overall vehicles on the roadway network in the northern Virginia area. When widened, the Beltway will allow for shorter overall commutes for vehicles and a reduction in the number of vehicles accessing side streets to cut through neighborhoods. A wider Beltway would allow vehicles to reach destinations in a shorter amount of time, translating to lesser amounts of pollution. 21. The project does not conform to the SIP particularly the new 8-hour ozone and PM2.5 SIP. Which configuration is included in which conforming air quality control plan? (1 commentor) The Preferred Alternative (the addition of two lanes in each direction on the Capital Beltway for HOT and HOV use) has been included in the current CLRP (FY 2005) and TIP (FY ) and the Capital Region's Transportation Planning Board (the MPO for the Washington, D.C. Metropolitan Area) conducted a conformity assessment for the 8-hour ozone standard. TPB's conformity determination was reviewed by the EPA in accordance with the procedures and criteria of the Transportation Conformity Rule. Based on their review, EPA determined that TPB's 8-hour ozone conformity assessment meets the requirements of the Clean Air Act and the applicable regulations promulgated under 40 CFR Part 93. On December 21, 2005, FHWA and FTA jointly found the 2005 CLRP and FY TIP for the Washington, D.C. Metropolitan Area to be in conformance with the Transportation Conformity Rule for the 8-hour ozone standard. The TPB also recently completed a conformity assessment of the 2005 CLRP and FY for fine particles (PM2.5 direct and precursor NOx emissions). Their assessment demonstrates that the estimated levels of fine particles for the 2010, 2020, and 2030 analysis years of the CLRP and TIP will be well below the 2002 base year levels of PM2.5 and NOx emissions. EPA has determined that TPB s PM2.5 conformity assessment meets the requirements of the Clean Air Act and the applicable regulations promulgated under 40 CFR Part 93. On February 21, 2006, FHWA and FTA jointly found the 2005 CLRP and FY TIP for the Washington, D.C. Metropolitan Area to be in conformance with the Transportation Conformity Rule for the PM2.5 standard. On February 23, 2006, EPA signed the Final Rule on PM2.5 and PM10 Hot-Spot Analyses in Project-level Transportation Conformity Determinations for the New PM2.5 and Existing PM10 National Ambient Air Quality Standards and submitted it for publication in the Federal Register. The new rule requires a hot-spot analysis for projects in PM2.5 nonattainment areas that are of air quality concern, effective April 5, Quantitative analyses are not required for projects of air quality concern until EPA releases the next B-35
428 Appendix B Capital Beltway Study version of their motor vehicle emissions factor model, MOVES, which will provide the level of detail needed for credible and meaningful hot-spot analysis. However, in the interim, qualitative analyses will be required. A PM2.5 qualitative analysis will be prepared for this project pending the release of guidance on PM2.5 qualitative analyses and the opportunity to review and incorporate those requirements into the project development process. Since a Record of Decision will not be issued by April 5, 2006 for this project, a hot-spot analysis will need to be prepared and a project-level conformity determination made before FHWA can take any approval action on the project. The proposed improvements are not expected to interfere with attainment or maintenance of the NAAQS. Additional details on the air quality analysis are provided in the Air Quality Technical Report. 22. Contrary to the statement on page 4-78 of the Draft EIS, air quality is not improving. Since 1990, the Washington metropolitan region has exceeded the one-hour ozone standard six days every summer. Federal law permits an average of one exceedance per summer at a monitor location. The EPA s Air Quality Index (AQI) reports that the region s air quality has degraded as measured by the number of unhealthful air days. The fluctuations of the AQI can hardly be shown as a trend. The study does not discuss how any options will move the metropolitan area into attainment status and achieve cleaner air. (1 commentor) Nationwide, atmospheric levels of all four pollutants to which motor vehicles contribute significantly ozone, carbon monoxide, airborne Pb, and nitrous oxides have declined consistently for almost two decades, and violations of the NAAQS for airborne lead, carbon monoxide, and nitrogen dioxide have been virtually eliminated. Controlling ground-level ozone has proven more challenging, but violations of the federal ozone standard have also been sharply reduced. Most of the reduction in atmospheric concentrations of these pollutants can be attributed to tighter emissions standards for cars and trucks, point source controls, federal programs to reduce pollution such as Tier I and II controls, the use of reformulated gasoline and other cleaner burning fuels, etc. These reductions have occurred despite the increasing population, gross domestic product, and vehicle miles traveled. A similar trend has occurred at the regional level. Air quality in the metropolitan Washington region is improving for each of the criteria pollutants listed above. Today, the region is meeting five of the six standards with ample margins. Ground-level ozone is the one pollutant for which the region has not yet reached the federal health standard, although the number of days exceeding the standard each year has been decreasing over the past two decades. This trend reflects the underlying direction of improving ozone air quality and is not due only to some favorable change in weather conditions that can also influence ozone levels. Although a wider Beltway will have a higher volume of vehicles, it will not necessarily lead to more overall vehicles on the roadway network in the northern Virginia area. When widened, the Beltway will allow for shorter overall commutes for vehicles and a reduction in the number of vehicles accessing side streets to cut through neighborhoods. A wider Beltway would allow vehicles to reach destinations in a shorter amount of time, translating to lesser amounts of pollution. B-36
429 Capital Beltway Study Public Comments and Responses 23. The effects of hazardous air toxics were not considered, and are likely to expose children at Stenwood Elementary School to unhealthy air quality, due to the removal of 120 feet of buffer. (1 commentor) Under the revised designs for the Preferred Alternative, no land will be taken from Stenwood Elementary School. However, to address the larger issue of exposure to hazardous air toxics, the following is provided the reader should note that most of this information is extracted directly from Chapters 3 and 4 of the Final EIS. The discussion is applicable to all developed sections along the existing Beltway, as well as adjoining roadways (I-66 in the case of Stenwood Elementary) where sensitive receptors are present. As described in Sections and 4.6.3, motor vehicles emit several pollutants that the EPA classifies as probable human carcinogens. Some toxic compounds are present in gasoline and are emitted to the air when gasoline evaporates or passes through the engine unburned. Other toxic compounds are formed as a by-product of incomplete combustion or through secondary reactions in the atmosphere. The emissions that come from mobile sources (e.g., cars, trucks, buses) are highly dependent on the fuel that powers them. Therefore, the EPA implemented regulations for mobile sources that are aimed at controlling the emissions of air toxics through changes to fuel compositions and improving vehicle technology and performance. Examples of such changes include: reformulated gasoline and antidumping standards; national low emission vehicle (NLEV) program; Tier 2 motor vehicle emissions and gasoline sulfur control requirements; inspection and maintenance programs, on-board diagnostics, and heavy-duty engine and vehicle standards; and on-highway diesel fuel sulfur control requirements. In developing the March 29, 2001 final rule, Control of Emissions of Hazardous Air Pollutants from Mobile Sources, EPA found that refineries were producing gasolines that were cleaner than required by prior gasoline toxic emissions standards (i.e., they were overcomplying ). EPA issued new gasoline toxic emissions standards designed to perpetuate this overcompliance. Now, the annual average toxics performance level of gasoline produced or imported beginning in 2002 must be at least as clean as the average performance level of the gasoline produced during the baseline period Since the draft Environmental Impact Statement was approved for public availability in 2002, FHWA, through consultation with the EPA, has issued interim guidance on addressing mobile source air toxics in NEPA documents. This guidance, released on February 3, 2006, establishes a three-tiered approach to addressing mobile source air toxics in NEPA documents depending upon the scope of the project and its stage of development. In accordance with this guidance, this EIS includes a basic qualitative analysis of the likely mobile source air toxic emission impacts of the alternatives compared to the no-build scenario. However, available technical tools do not enable us to predict the project-specific health impacts of the emissions associated with each alternative in this EIS. Although EPA has established a list of mobile source air toxics, it has not established that emissions of these compounds present health risks, nor has it established standards or measures of concentrations B-37
430 Appendix B Capital Beltway Study of these compounds such that one could conclude that a particular project will have an adverse health effect on the public. Due to these limitations, the following discussion is included in the EIS while acknowledging CEQ s regulations (40 CFR (b)) regarding incomplete or unavailable information. There are six air toxics that are of primary concern when it comes to mobile source air toxic emissions, and they are commonly referred to as the six priority mobile source air toxics. These six priority mobile source air toxics include acetaldehyde, acrolein, benzene, 1,3-butadiene, diesel particulate matter, and formaldehyde. Effectively evaluating the environmental and health impacts from the six priority mobile source air toxics on a highway project such that the information could be used to make an informed decision would involve several key elements, including emissions modeling, dispersion modeling in order to estimate ambient concentrations resulting from the estimated emissions, exposure modeling in order to estimate human exposure to the estimated concentrations, and then final determination of health impacts based on the estimated exposure. Each of these steps is encumbered by technical shortcomings or uncertain science that prevents a more complete determination of the mobile source air toxic health impacts of this project and in turn, prevents FHWA from considering this information with any degree of confidence when making a decision on the project. Emissions. The EPA tools to estimate mobile source air toxic emissions from motor vehicles are not sensitive to key variables determining emissions of mobile source air toxics in the context of highway projects. While MOBILE 6.2 is used to predict emissions at a regional level, it has limited applicability at the project level. MOBILE 6.2 is a trip-based model--emission factors are projected based on a typical trip of 7.5 miles, and on average speeds for this typical trip. This means that MOBILE 6.2 does not have the ability to predict emission factors for a specific vehicle operating condition at a specific location at a specific time. For particulate matter, the model results are not sensitive to average trip speed, although the other mobile source air toxic emission rates do change with changes in trip speed. Also, the emissions rates used in MOBILE 6.2 for both particulate matter and mobile source air toxics are based on a limited number of tests of mostly older-technology vehicles. Lastly, in its discussions of particulate matter under the conformity rule, EPA has identified problems with MOBILE6.2 as an obstacle to quantitative analysis. Consequently, these deficiencies compromise the capability of MOBILE 6.2 to estimate mobile source air toxic emissions. Dispersion. The tools to predict how mobile source air toxics disperse are also limited. The EPA s current regulatory models, CALINE3 and CAL3QHC, were developed and validated more than a decade ago for the purpose of predicting episodic concentrations of carbon monoxide to determine compliance with the NAAQS. The performance of dispersion models is more accurate for predicting maximum concentrations that can occur at some time at some location within a geographic area. This limitation makes it difficult to predict accurate exposure patterns at specific times at specific highway project locations across an urban area B-38
431 Capital Beltway Study Public Comments and Responses to assess potential health risk. The NCHRP is conducting research on best practices in applying models and other technical methods in the analysis of mobile source air toxics. This work also will focus on identifying appropriate and more effective methods of documenting and communicating mobile source air toxic impacts in the NEPA process and to the general public. Along with these general limitations of dispersion models, FHWA is also faced with a lack of monitoring data in most areas for use in establishing project-specific mobile source air toxic background concentrations. Exposure Levels and Health Effects. Finally and probably most important, even if emission levels and concentrations of mobile source air toxics could be accurately predicted, shortcomings in current techniques for exposure assessment and risk analysis preclude us from reaching meaningful conclusions about project-specific health impacts. Exposure assessments are difficult because it is difficult to accurately calculate annual concentrations of mobile source air toxics near roadways, and to determine the portion of a year that people are actually exposed to those concentrations at a specific location. These difficulties are magnified for 70- year cancer assessments, particularly because unsupportable assumptions would have to be made regarding changes in travel patterns and vehicle technology (which affects emissions rates) over a 70-year period. There are also considerable uncertainties associated with the existing estimates of toxicity of the various mobile source air toxics, because of factors such as low-dose extrapolation and translation of occupational exposure data to the general population. Because of these shortcomings, any calculated difference in health impacts between alternatives is likely to be much smaller than the uncertainties associated with calculating the impacts. Consequently, the results of such assessments would not be useful to decision makers, who would need to weigh this information against other project impacts that are better suited for quantitative analysis. Research into the health impacts of mobile source air toxics is ongoing. For different emission types, there are a variety of studies that show that some either are statistically associated with adverse health outcomes through epidemiological studies (frequently based on emissions levels found in occupational settings) or that animals demonstrate adverse health outcomes when exposed to large doses. Exposure to toxics has been a focus of a number of EPA efforts. Most notably, the agency conducted the National Air Toxics Assessment (NATA) in 1999 to evaluate modeled estimates of human exposure applicable to the county level. While not intended for use as a measure of or benchmark for local exposure, the modeled estimates in the NATA database best illustrate the levels of various toxics when aggregated to a national or State level. The EPA is in the process of assessing the risks of various kinds of exposures to these pollutants. The EPA Integrated Risk Information System (IRIS) is a database of human health effects that may result from exposure to various substances found in the environment. The IRIS database is located at The B-39
432 Appendix B Capital Beltway Study following toxicity information for the six priority mobile source air toxics was taken from the IRIS database Weight of Evidence Characterization summaries. This information is taken verbatim from EPA's IRIS database and represents the Agency's most current evaluations of the potential hazards and toxicology of these chemicals or mixtures. Benzene is characterized as a known human carcinogen. The potential carcinogenicity of acrolein cannot be determined because the existing data are inadequate for an assessment of human carcinogenic potential for either the oral or inhalation route of exposure. Formaldehyde is a probable human carcinogen, based on limited evidence in humans, and sufficient evidence in animals. 1,3-butadiene is characterized as carcinogenic to humans by inhalation. Acetaldehyde is a probable human carcinogen based on increased incidence of nasal tumors in male and female rats and laryngeal tumors in male and female hamsters after inhalation exposure. Diesel exhaust (DE) is likely to be carcinogenic to humans by inhalation from environmental exposures. Diesel exhaust as reviewed in this document is the combination of diesel particulate matter and diesel exhaust organic gases. Diesel exhaust also represents chronic respiratory effects, possibly the primary noncancer hazard from mobile source air toxics. Prolonged exposures may impair pulmonary function and could produce symptoms, such as cough, phlegm, and chronic bronchitis. Exposure relationships have not been developed from these studies. There have been other studies that address mobile source air toxic health impacts in proximity to roadways. The Health Effects Institute, a non-profit organization funded by EPA, FHWA, and industry, has undertaken a major series of studies to research near-roadway mobile source air toxics hot spots, the health implications of the entire mix of mobile source pollutants, and other topics. The final summary of this series is not expected for several years and as such, will not be available for use on this project. Some recent studies have reported that proximity to roadways is related to adverse health outcomes -- particularly respiratory problems. Much of this research is not specific to mobile source air toxics, instead surveying the full spectrum of both criteria and other pollutants. The FHWA cannot evaluate the validity of these studies, but more importantly, they do not provide information that would be useful to alleviate the uncertainties listed above and enable us to perform a more comprehensive evaluation of the health impacts specific to this project. B-40
433 Capital Beltway Study Public Comments and Responses Because of the uncertainties outlined above, a quantitative assessment of the effects of air toxic emissions impacts on human health has not been made for the project. While available tools do allow us to reasonably predict relative emissions changes between alternatives for large projects, the amount of mobile source air toxic emissions from each of the project alternatives and mobile source air toxic concentrations or exposures created by each of the project alternatives cannot be predicted with enough accuracy to be useful in estimating health impacts. Therefore, the relevance of the unavailable or incomplete information is that it is not possible to make a determination with any certainty whether any of the alternatives would have "significant adverse impacts on the human environment. In lieu of a quantitative assessment, a qualitative assessment of mobile source air toxic emissions relative to the various alternatives has been prepared. While FHWA acknowledges that the project alternatives may result in increased exposure to mobile source air toxic emissions in certain locations, the concentrations and duration of exposures are uncertain, and because of this uncertainty, the health effects from these emissions cannot be estimated. This qualitative mobile source air toxic analysis focuses on the differences between the two build alternatives for the Capital Beltway and the impact that these differences may have on mobile source air toxic levels in the vicinity of the Capital Beltway. The Final EIS addresses two alternatives, a 10-lane and a 12-lane alternative, which have been reduced substantially in scope in response to comments from the public and Fairfax County following the Location Public Hearings. With the exception of the number of lanes, both of these alternatives are very similar. Both involve widening the existing Capital Beltway for 14 miles in the median, are located on the same alignment, and have the same termini (Interstate I- 495 between the Springfield Interchange and the American Legion Bridge). Because of these similarities, the factors that may effect mobile source air toxic emissions and allow one to differentiate between alternatives will be operational characteristics such as vehicle miles traveled (VMT), average daily traffic (ADT) and the level of service which is a reflection of the congestion that each alternative will experience. In the Final EIS, Table 2-7, which shows the range of daily (peak) demand volumes (vehicles in one direction) in 2020, demonstrates that the daily demand volume for the 10-lane and 12-lane alternatives in the Final EIS will only be 6% and 8% higher, respectively, when compared to the No-Build Alternative while the difference in daily demand volume between the build alternatives themselves will be less than 2%. The increase in daily demand volume over the No-Build Alternative can be expected since the project would increase capacity on the Beltway and attract traffic from the adjacent and parallel arterial routes. This is also desirable since one of the components of the purpose and need for this project is to reduce congestion and increase throughput not only on the Beltway but the adjacent and parallel arterial routes as well, which are currently experiencing congestion due to cut-through traffic trying to avoid congestion on the Beltway. Therefore, to understand the total impact that the build alternatives may have on traffic and air toxics, one has to consider the adjacent road network as well as the mainline. In this case, the 12-lane alternative is the most effective at removing vehicles from the adjacent road network when compared to the 10-lane B-41
434 Appendix B Capital Beltway Study alternative. Likewise, the preferred alternative would intuitively be more effective than alternatives that would convert a general-purpose lane for use as a HOV or HOT lane. General speaking, alternatives that provide more capacity on the Beltway will be more effective at reducing congestion and increasing throughput on the Capital Beltway as well as the adjacent road network. When it comes to vehicle throughput, the mainline throughput of the 12-lane alternative is the greatest, accommodating over 20% more when compared to the No- Build Alternative. The 10-lane alternative will have a 13% increase in throughput when compared to the No-Build Alternative. At the on-ramps as well, the 12-lane alternative will have higher throughput since the additional capacity on the mainline will allow vehicles to gain faster entry onto the Beltway and minimize the backups that will form on the ramps and the queues that will form on adjacent streets. The capacity of both the 10-lane and 12-lane alternatives can handle the forecast demand on a daily basis with congestion limited to peak periods of between two and four hours each for the AM and PM peak periods. In contrast, the No-Build Alternative is unable to handle the forecast demand with congestion being experienced throughout the day. Approximately 10,000 vehicles that desire to use the Beltway under the no-build scenario would be forced to find other routes, increasing the amount of cut-through traffic on adjacent streets. This congestion, in turn, will be reflected in the peak hour travel speeds on the Beltway. According to Figure 2-7 in the Final EIS, both the 10-lane and 12-lane alternatives will allow for better travel speeds during peak periods than the No-Build Alternative; there are limited differences in travel speeds between the build alternatives themselves. In developing the Draft EIS, it was determined that 14 general-purpose lanes would be needed on the Beltway to reduce congestion (defined as non-free flow travel) and achieve an acceptable level of service throughout the day. However, this would have resulted in unacceptable impacts to the natural and human environment in the corridor. Therefore, it was decided that in order to achieve a tradeoff between impacts and benefits, the maximum number of lanes that would be considered for the build alternatives would be 12. Consequently, all of the alternatives that have been considered throughout the course of the EIS, including the two alternatives in the Final EIS, will experience several hours of congestion (see Figure 2-5 in the Final EIS). Compared to the No-Build Alternative, the 10-lane and 12-lane alternatives will have 3 and 5 hours of severe and moderate congestion less than the No-Build Alternative, respectively. Both the 10-lane and 12-lane alternatives will increase VMT on the Beltway compared to the No-Build Alternative. For example, there will be an 8% and 18% increase in AM peak hour VMT compared to the No-Build Alternative if the 10-lane and 12-lane alternatives are implemented, respectively. Likewise, there will be a 17% and 22% increase in PM peak hour VMT compared to the No-Build Alternative if the 10-lane and 12-lane alternatives are implemented, respectively. In comparing the 10 lane and the 12-lane alternatives, the VMT will be 11% higher for the 12- lane alternative compared to the 10-lane alternative for AM peak hour VMT and 6% B-42
435 Capital Beltway Study Public Comments and Responses higher for PM peak hour VMT. Although the additional lanes proposed under each of the build alternatives result in an increase in VMT, this increase would be offset by the reduction in VMT on adjacent roadways (see section 2.4.3). In determining the relevance of these operational characteristics with respect to mobile source air toxics, one must consider a few basic conclusions that a sensitivity analysis of EPA s Mobile6.2 model allows one to make. For example, the highest mobile source air toxic emission factors are associated with lower speeds while the emission factors associated with higher speeds decrease substantially, in comparison, before leveling out at 55 to 65 mph. Closely related to vehicle speed is the type of facility involved. All things being equal, higher emission factors are associated with local streets while lower emission factors are associated with arterial facilities and the lowest emission factors are associated with freeway facilities. The higher the vehicle miles traveled on a freeway, the lower the mobile source air toxic emission factors on a per vehicle mile traveled basis. When VMT is compared between a local road and an arterial facility, mobile source air toxic emission factors from local roads are significantly higher than those from an arterial facility. Finally, the further one goes into the future, the greater the reduction in mobile source air toxic levels that will be realized due to various control programs and improvements in technology. This is reflected in the fact that the highest emission factors in EPA s Mobile6.2 model are associated with the current year while the lowest emission factors are associated with years extending into the future. Applying these concepts to the Beltway improvements, alternatives that are more effective at reducing congestion and reducing the time that vehicles sit in traffic at lower speeds will produce lower levels of mobile source air toxic emissions than those alternatives that don t. Freeway alternatives that reduce congestion better than other freeway alternatives will produce less mobile source air toxic emissions. Likewise, those alternatives that are more effective at reducing congestion on local streets and the adjacent arterial network by redirecting that traffic to the freeway will produce lower levels of mobile source air toxic emissions. Finally, a forecasted increase in VMT in the design year does not translate to an overall increase in mobile source air toxic levels in the project corridor because it is expected that substantial reductions in air toxics will be achieved over time even with increases in VMT. This is reinforced by EPA s final rule on mobile source air toxics, which concluded that on-highway emissions of benzene, formaldehyde, 1,3-butadiene, and acetaldehyde will be reduced by 67 to 76 percent and on-highway emissions of diesel particulate matter will be reduced by 90 percent between 1990 and 2020 due to existing and proposed control programs. Because EPA has regulated heavy-duty truck emission standards, emissions for heavy-duty on-road trucks are expected to be reduced dramatically between 1998 and 2010 with allowable particulate matter being reduced 98 percent and allowable nitrogen oxide emissions being reduced 97 percent. Applying these trends to the Washington, D.C. region, one could reasonably conclude that if no improvements were made to the capital Beltway and congestion was allowed to worsen while VMT increased at the rate forecasted, it is expected that the region would still realize reductions in air toxics over time. B-43
436 Appendix B Capital Beltway Study While the potential exists for there to be localized areas where ambient concentrations of mobile source air toxics could be higher under certain conditions under the build alternatives when compared to the No-Build Alternative, this potential is considered low since the majority of the improvements will occur within the median. While the addition of two lanes in the median to the outer loop, for example, will have the effect of moving traffic closer to the receptors located adjacent to the inner loop, it will also have the converse effect of moving that same traffic further away from the receptors located along the outer loop. Therefore, the resulting effect is one where the potential for increases in mobile source air toxics is offset by potential reductions. The potential for localized impacts has also been made low by the decision to significantly reduce the scope of the project and limit the majority of construction to the existing right-of-way limits. As a result, the relocation impacts associated with the alternatives in the Draft EIS have been reduced from a maximum of 326 homes and businesses to a maximum of 3 homes and businesses for the alternatives in the Final EIS. Likewise, the amount of right-of-way needed has been reduced from a maximum 168 acres to a maximum of 10 acres. In conclusion and summary, the mobile source air toxic issue is a continuing area of research and a developing issue which at present, is not fully understood to the point that it would allow one to quantify the health effects that the proposed project would have on the surrounding environment. As documented above, the technical capability of quantifying such effects with any degree of confidence are years off. Consequently, the mobile source air toxic issue will not inform the decision makers for this project as it relates to the significance of this issue. Likewise, there are limited differences between the build alternatives included in the Final EIS based on the operational characteristics addressed above. Since mobile source air toxic emissions are sensitive to these operational issues, this limited difference and its impact on air toxics is not expected to have any influence on the selection of an alternative by FHWA. Despite the increase in VMT associated with the preferred alternative, the preferred alternative provides greater benefits in reducing congestion, increasing travel speeds during peak periods, and removing traffic from local streets. When these benefits are taken into account with the reductions in air toxics that are expected over time due to EPA s vehicle and fuel regulations coupled with fleet turnover, the potential of the project to increase mobile source air toxic emissions is low. 24. The Draft EIS does not include information comparing emissions generated by gridlock at peak hours, nor is there a comparison of emissions with that of a rail transit option. (1 commentor) Carbon monoxide is the only automotive-related pollutant emission that is modeled on a project-specific basis. The other pollutants, considered as regional pollutants, are studied by the Metropolitan Washington Council of Governments (MWCOG) for all regionally significant transportation projects included in the Constrained Long Range Plan (CLRP) for the Washington, DC-MD-VA air quality region. This plan includes improvements to the Capital Beltway and the various rail transit improvements programmed throughout the region. Both levels of analyses are based on worst-case conditions. B-44
437 Capital Beltway Study Public Comments and Responses 25. The Draft EIS only presents the results of the air quality modeling analysis without any explanation of the methodology or causes. The EIS should discuss the results and explain why the results come out the way they do. (1 commentor) The air quality modeling analysis methodology is summarized in the Draft EIS and described in more detail in the Air Quality Technical Report. As noted above, carbon monoxide is the only automotive-related pollutant that is modeled on a project-specific basis. The other pollutants are addressed on a regional level by the Metropolitan Washington Council of Governments. Section 4.6 of the Final EIS was revised to describe in more detail how an air quality analysis is conducted for transportation projects. Water Quality 26. The Draft EIS mentions the loss of wetlands, floodplains, and streambeds, but does not attempt to assess the magnitude of those impacts, particularly to water quality. The EIS should include a quantitative analysis of impacts to water quality so that water quality impacts can be considered in choosing an alternative, not just to help the Army Corps of Engineers levy compensation requirements. (1 commentor) Implementation of currently required quantitative and qualitative treatment techniques prescribed by the VDOT Drainage Manual and VDOT Erosion and Sedimentation Control and Stormwater Management (ESC & SWM) Manual will ensure that the proposed project meets the requirements established by both state and Federal water pollution prevention regulations. These features are designed and analyzed for effectiveness during the development of final roadway design plans. It is expected that quality and quantity treatment of runoff associated with the Preferred Alternative will result in an overall improvement in quantity management and more effective pollutant removal capabilities beyond what is presently occurring in the local watershed. The Natural Resources Technical Report provided a summary of the existing water quality in the project area from available sources. Existing water quality in most of the project area has been negatively affected by past discharges to receiving waters. Much of the proposed impacts to surface waters occur from currently untreated road runoff. With the required construction of both temporary and permanent stormwater controls in accordance with current BMPs, it is likely that water quality would actually improve over existing conditions. This is primarily due to the fact that much of the Beltway infrastructure was in place prior to enactment of the Chesapeake Bay Protection Act in The EIS does not discuss stormwater management from Beltway runoff. The EIS should be revised to discuss how stormwater runoff will change under the build alternatives and how stormwater will be managed. (1 commentor) See the response to Comment #26. In addition, stormwater management plans will be developed when roadway construction designs are refined and finalized. The Natural Resources Technical Report for the Draft EIS included reported existing water quality to serve as a reasonable assessment for stormwater runoff in existing receiving waters. B-45
438 Appendix B Capital Beltway Study 28. Concerned about the taking of a portion of the Scott s Run floodplain between Lewinsville Road and Old Dominion Drive. The EIS should describe mitigating designs that could reduce or eliminate this impact or mitigating measures. The EIS should discuss the effect of the build alternatives on flood height. If increased, the EIS should describe the impacts. (1 commentor) Figure 3-13 of the Final EIS depicts the 100 year floodplains as delineated by the Federal Emergency Management Agency (FEMA) as part of the National Flood Insurance Program. Approximately 5.5 acres of the Scotts Run floodplain would occur between Lewinsville Road and Old Dominion Drive. (A total of acres of the floodplain associated with Scotts Run would be affected by the project. See Section 4.11 in the Final EIS.) Most of this longitudinal encroachment is attributed to the fill outside the actual pavement area. These longitudinal encroachments cannot be minimized by bridging because the majority of the encroachment occurs where the floodplains run parallel to the existing roadway and the encroachment is the result of extending the roadbed fill. Sections 107 and 303 of VDOT s Road and Bridge Specifications require the use of stormwater management practices to address concerns such as post-development stormflows and downstream channel capacity and stability. By adhering to these specifications, changes in pre-existing flood elevations and velocity increases should be nonexistent or minimal. During final design, a detailed floodplain survey and study will be conducted to ensure that the Preferred Alternative poses no downstream flood effects in accordance with state law. Historic and Archaeological 29. Holmes Run Acres is eligible for the National Register of Historic Places as a Historic District. The Gallows Road improvements are opposed because they represent an adverse affect to this Historic District. The study should properly consider alternatives to adversely affecting this resource. (6 commentors) The Holmes Run Acres Historic District was surveyed and determined eligible for the National Register of Historic Places (NRHP) for the Capital Beltway Project. Under the Preferred Alternative, the impacts to this historic district were eliminated. Following the publication of the Draft EIS, revised concepts were studied which would avoid adverse effects to the properties along Gallows Road. The study concluded that encroachment on the Gallows Road historic district could be avoided by eliminating two elements of the proposed widening of Gallows Road. One of these elements is the proposed extension of the exit lane to serve westbound Beltway traffic along the edge of the district. The other is the right-of-way increase, also along the edge of the district. By eliminating these elements from the interchange improvements that are part of the Preferred Alternative, there would be no increase in the shoulder edge or the right-of-way along the district boundary. Likewise, no sound wall would be constructed along the edge of the historic district. Each of these recommendations has been included in the Preferred Alternative. Hazardous Materials 30. Any decision should consider the possible use of the Beltway for nuclear waste transport to the federal repository at Yucca Mountain that is under consideration. (1 commentor) B-46
439 Capital Beltway Study Public Comments and Responses The total number of shipments of nuclear waste nationally, of which a small percentage would travel through Virginia, is expected to increase from less than 100 shipments per year to between 300 and 400 shipments per year when the Yucca Mountain storage repository site becomes available. The EIS for the Yucca Mountain repository identified several possible routes for the transport of nuclear waste to Yucca Mountain. The northern Virginia section of the Beltway was not identified as a possible route in the Yucca Mountain EIS. Since 1964 there have been more than 3,000 shipments of nuclear waste with no injuries, fatalities, or environmental damage attributed to the radioactive nature of the cargo. Transport of materials with a high level of radioactivity, such as nuclear waste shipments, are identified as Highway Route Controlled Quantity and are required to use preferred routing. Preferred routes are interstate highways that take into account such factors as population density, transit time, time of day, and day of week. Densely populated areas, with high levels of congestion do not meet the criteria for designation as a preferred route. Noise 31. Concerns about the effectiveness of noise abatement recommendations for Holmes Run Acres. (4 commentors) Since publication of the Draft EIS, the property acquisitions in the Holmes Run Acres neighborhood have been eliminated. Holmes Run Acres has been determined to be eligible for the National Register of Historic Places. Minimal improvements to Gallows Road are included in the Preferred Alternative. As a result the replacement noise barrier would end before the first house along Gallows Road and it will not restrict access to any driveways. VDOT will conduct more detailed analysis of all of the proposed noise barriers during the project s final design phase. The final design of each noise wall will take into account both safety and engineering issues. Once the design of a noise wall has been finalized, the affected homeowners will be shown the results and have a chance to vote on whether they favor construction of the noise wall. 32. The Draft EIS contained no separate analysis of the noise impact due to the increase in projected traffic volumes on Gallows Road; the Draft EIS significantly underestimates the impact of noise on the neighborhood; the proposed widening will produce more noise in the neighborhood than the Draft EIS indicates; skeptical about how much protection such a barrier will give to Holmes Run Acres. (4 commentors) The effects on traffic noise levels due to the proposed improvements to Gallows Road east of the Beltway were evaluated in the noise analysis. The projected noise levels and the potential noise impact in the Holmes Run Acres community reflect the combined effects of the proposed improvements to the Beltway and Gallows Road. As summarized in Section 4.7 of the Final EIS, the potential noise impact of the proposed improvements for the Capital Beltway Project was assessed in accordance with FHWA and VDOT noise assessment guidelines. All traffic-noise computations for this study were conducted using the latest version of the FHWA Traffic Noise Model (FHWA TNM 1.1), which incorporates state-of-the-art sound emissions and sound-propagation algorithms. B-47
440 Appendix B Capital Beltway Study To determine the degree of impact from highway traffic noise on human activity, the Noise Abatement Criteria (NAC) established by the FHWA (23 CFR Part 772) were used. Chapter 2 of the Noise Technical Report provides a detailed summary of the impact criteria that were used, as well as a discussion of terminology used in the noise analysis. In the Holmes Run Acres neighborhood, traffic noise levels due to the Preferred Alternative approach or exceed the FHWA NAC at distances up to 170 meters (560 feet) from the centerline of the Beltway. Although traffic on the Beltway is now and would be noticeable at locations within the neighborhood that are at greater distances from the highway, noise impact is not expected to occur at these farther distances. Table 4-11 in the Final EIS indicates that 5 residences in Holmes Run Acres would be protected by Barrier 8A under the Preferred Alternative. In addition to these protected properties, another 50 residences would be benefited by the proposed noise barrier under the Preferred Alternative. As described in Section of the Final EIS, a residence is protected if it is exposed to design-year noise impact (without a barrier) and would receive at least 5 decibels of noise reduction from a barrier. A residence is benefited if it is not exposed to design-year noise impact, but still receives at least 5 decibels of noise reduction from a barrier designed to protect other homes. As shown in Appendix C of the Noise Technical Report, Barrier 8A provides 5 to 12 decibels of noise reduction at protected and benefited homes throughout the neighborhood. To understand the effects of noise reduction, a person with normal hearing would perceive a 5-decibel decrease in sound level as noticeable, while a 10-decibel decrease in sound level would be perceived as half as loud, and a 15-decibel decrease would be perceived as one-third as loud. 33. Opposed to project because there are no firm commitments to construct adequate noise barriers; construction of proper sound barriers for all affected dwellings is not assured (3 commentors) VDOT s State Noise Abatement Policy stated that when the abatement criteria contained within that document are satisfied, noise abatement must be provided in conjunction with a Type I highway project. The Capital Beltway Study is a Type I highway project. VDOT s policy is consistent with and based upon the Federal regulations, and includes criteria for evaluating the feasibility and reasonableness, or cost-effectiveness, of noise abatement measures. After a project s final design, but before the submittal of the project s the Plans, Specifications, and Estimates (P,S&E), any noise barriers that still exceed VDOT s cost-effectiveness criterion will receive further consideration only if a third party commits to funding the amount in excess of $30,000 per protected home. A firm commitment cannot be granted at this time because final design activities cannot commence until the Final EIS is completed and traffic will need to be updated in conjuction with final design. 34. Concerns about the design, appearance, and aesthetics of noise barrier walls (3 commentors) Decisions regarding the construction of noise barriers are made during the final design of the project, once the final roadway location has been determined. During the final design B-48
441 Capital Beltway Study Public Comments and Responses stage of the project, VDOT will hold design public hearings at which the details of the noise barrier design, appearance, and aesthetics will be communicated to the affected citizens. The final decision on potential noise barriers will take into account the opinions of the affected citizens. In regard to the design of noise barriers, VDOT utilizes a specially designed sound absorptive concrete material for ground-mounted noise walls and a lightweight material (typically perforated metal panels with sound absorptive filler) for structure-mounted noise walls, such as those mounted on bridges and retaining walls. VDOT specifications (Metric Road and Bridge Specifications, Section , January 1997) require that sound barrier panels provide a minimum transmission loss of 23 db(a) when tested in accordance with ASTM E90. This minimum requirement for the transmission loss, along with other requirements contained in the VDOT specifications, ensure that noise barrier walls are constructed in such a manner and with materials of sufficient quality, such that sound does not leak through the barrier. VDOT utilizes a standard aesthetic finish for noise barrier walls consisting of a raked finish on the residential side and a fluted finish on the highway side of the barrier. Very often, the residential side and highway side of the barrier are different in color. Specific colors used in the noise barrier wall are chosen in conjunction with the affected citizens and the locality during various citizen information meetings. If the affected citizens or the locality requests an aesthetic finish that varies significantly from the cost of the standard finish, VDOT allows these parties to fund the difference. Decisions about barrier aesthetics are made during the final design stage of the project. 35. Concerns about the number of trees that will be cut down to accommodate additional lanes and replacement noise barriers. (2 commentors) In response to the comments from the public and local governments, VDOT conducted additional study of the build alternatives presented in the Draft EIS to minimize impacts and reduce costs. The Preferred Alternative will result in much less right-of-way acquisition (10 acres versus up to 168 acres) and fewer effects to the surrounding vegetation. During construction, VDOT encourages contractors to minimize the number of trees that need to be removed to accommodate the improved highway, wherever possible. In general, any trees that need to be removed to accommodate the highway improvements would be limited to those trees that would be within the future right-of-way. Trees and other types of ground vegetation do have an effect on sound propagation, and in some circumstances may provide noticeable noise reductions. However, for a band of trees to provide a noticeable noise reduction, it would have to be at least 5 meters (15 feet) in height and at least 30 meters (100 feet) in depth. The band of trees also would have to be sufficiently dense such that the highway would not be visible through them from the receiver position. A band of trees such as this would provide approximately 5 decibels of noise reduction, which would be noticeable. People living near a highway often perceive a noise reduction benefit attributed to trees and foliage. This perception, however, may be more psychological than acoustical. Because trees often provide a visual barrier to a highway, they are perceived as providing an B-49
442 Appendix B Capital Beltway Study acoustical barrier as well, even when this may not be the case. As described above, a wide band of trees, approximately 30 meters (100 feet) deep, is required to provide a noticeable noise reduction. Although smaller bands of trees also reduce the level of the sound that propagates through them, the reduction is barely noticeable. The acoustical phenomenon that many people experience with smaller bands of trees is that the frequency characteristics of traffic noise are changed as sound propagates through the trees. The higher frequency components of traffic noise are scattered and absorbed by leaves, trunks, and branches, while the low frequency components of the traffic noise propagates nearly unimpeded. This scattering and absorption of the higher frequency components has the effect of making traffic noise seem less harsh, and therefore seemingly lower in level. 36. The impact is not sufficiently explained for Timberly and Timberly South communities and no noise barrier is provided for my neighborhood. (2 commentors) Noise measurements were conducted at a total of 39 sites throughout the entire study area. For the Timberly and Timberly South communities west of the Beltway, a representative noise measurement was conducted at a location referred to as Site No. M28 (see Figure 3-10b and Table 3-14 in the Final EIS). The noise measurements provide valuable information on existing noise conditions and the effects of terrain and shielding on sound propagation from the highway to noise-sensitive locations. However, they are not the only input to the model used to predict the noise levels. Because existing noise levels are not always measured during the loudest hour of the day, estimates of the existing loudest-hour noise levels were computed with an FHWAapproved noise prediction model using the appropriate traffic data as inputs. These computed existing noise levels are then used as the baseline against which probable future noise impact is assessed. Many additional receivers were added to the 39 measurement sites for the purposes of predicting future noise levels throughout the study area. These prediction sites provide a comprehensive basis for comparing the noise impact due to the three build alternatives. Following VDOT and FHWA-approved procedures, the FHWA s Traffic Noise Model (FHWA-TNM) was used for all noise level computations. The FHWA-TNM is a threedimensional computer model that incorporates state-of-the-art, reality based, sound emissions and sound propagation algorithms, which are based on well-established theory or accepted international standards. The noise modeling takes into account the design of the road, the topography of the surrounding area, the distance between the road and nearby properties, the acoustical shielding provided by rows of buildings and other structures, sound propagation over different types of ground, traffic volumes and speeds, and vehicle mix including the percent of medium and heavy trucks. Traffic noise levels were computed for the loudest hour of the day for existing conditions as well as the design-year No-Build and build alternatives. The numbers of residences exposed to noise impact along the Beltway between the Dulles Toll Road and Georgetown Pike are summarized in Table 4-9 in the Final EIS. Following VDOT and FHWA procedures, the feasibility and reasonableness of noise barriers was evaluated everywhere noise impact is expected to occur. Because noise impact is expected to occur in Timberly and Timberly South under the Preferred Alternative, Noise Barrier 13B was evaluated for this neighborhood. B-50
443 Capital Beltway Study Public Comments and Responses As described in Section of the Final EIS, the estimated cost per home for Barrier 13B exceeds VDOT s cost criterion. However, it should be noted that the results of this noise barrier evaluation are preliminary and are intended to indicate the need for abatement and the potential for constructing noise barriers for impacted properties. During the project s final design phase, this barrier area will be re-evaluated based on the latest roadway design and traffic data, and the barrier dimensions will be fine-tuned and finalized. Upon the completion of the final design, should the cost of Noise Barrier 13B still exceed VDOT s cost-effectiveness criterion, it will receive further consideration only if a third party funds the amount in excess of $30,000 per home protected. 37. Concerns that potential barriers cost more than VDOT limit (2 commentors) As described in the Federal regulations (FHWA, 23 CFR Part 772: Procedures for Abatement of Highway Traffic Noise and Construction Noise Final Rule, Federal Register, Vol. 47, No. 131, 8 July 1982), before the adoption of an Final EIS or a Finding of No Significant Impact (FONSI), noise abatement measures that are found to be reasonable and feasible and that are likely to be incorporated in the project must be identified. Federal funding is available for noise abatement provided a traffic noise impact has been identified; the noise abatement measures will reduce the traffic noise impact, and the overall noise abatement benefits are determined to outweigh the overall adverse social, economic, and environmental effects and the costs of the noise abatement measures. Reasonableness takes into account the cost of the noise abatement measure. If a noise abatement measure is found to meet VDOT s cost-effectiveness criterion of $30,000 per dwelling unit protected, project funds will be used for its construction. During the project s final design phase, this barrier area will be re-evaluated based on the latest roadway design and traffic data, and the barrier dimensions will be fine-tuned and finalized. Upon the completion of the final design, should the cost of Noise Barrier 13A still exceed VDOT s cost-effectiveness criterion, it will receive further consideration only if a third party funds the amount in excess of $30,000 per home protected. 38. Noise barriers should be built anywhere they have not been built (1 commentor) Section of the Final EIS describes the procedures which were used to identify the locations of potential noise barriers throughout the study area. FHWA and VDOT procedures require the evaluation of noise abatement measures wherever noise impact is expected to occur. Due to the extent of future noise impact along the Beltway, noise barriers were evaluated to mitigate these impacts. As shown in Figures 4-3a through 4-3d of the Final EIS, these barriers extend along nearly the entire length of the study area along both sides of the Beltway. These potential noise barriers, including barriers that exceed the cost-effectiveness criterion, would benefit over 5,000 residences and other noise-sensitive land uses. Note that during final design, any noise barriers that still exceed VDOT s cost-effectiveness criterion would receive further consideration only if a third party funds the amount above $30,000 per home protected. In addition, noise barriers were found to be infeasible at several locations (see Section of the Final EIS). No apparent solutions are available to mitigate these impacts. 39. Concerns about Noise Barrier 9A for the Merrifield area (1 commentor) B-51
444 Appendix B Capital Beltway Study Traffic noise impact is expected to extend as much as 150 meters (500 feet) into the area of Merrifield known as Dunn Loring Village, as a result of the proposed improvements to I-66 that are included as part of the Beltway study. Following FHWA and VDOT guidelines, noise abatement measures must be evaluated wherever noise impact is expected to occur. Consequently, Barrier 9A was evaluated to mitigate the potential noise impact in Dunn Loring Village. This new barrier would have a uniform height of approximately 3 meters (10 feet), would be approximately 712 meters (2,235 feet) long, and would protect 116 residences exposed to noise impact with each of the proposed build alternatives. Barrier 9A would be located within VDOT s proposed right-of-way for the Capital Beltway Study, which generally follows the existing right-of-way in this area. The existing right-ofway is approximately 10 to 35 meters (33 to 115 feet) from the first row of townhouses in Dunn Loring Village. 40. Why there is no noise abatement along the south side of the Beltway from Telegraph Road to the Richmond Highway. (1 commentor) The project limits for the Capital Beltway Study extend from Backlick Road in the south to the American Legion Bridge in the north. The Huntington community lies outside the project limits, and was not considered in this study. 41. Noise level now is great; can t imagine what it would be like with more lanes of traffic. (1 commentor) In general, traffic noise levels are expected to increase under the Preferred Alternative. Table 4-7 in the Final EIS summarizes the computed traffic noise levels at representative noise prediction sites. Design-year traffic-noise levels are expected to increase by 1 to 13 decibels with the Preferred Alternative. Appendix A in the Nose Technical Report includes a discussion of the fundamentals of acoustics, including a brief discussion on how human beings perceive changes in sound pressure levels. Human beings perceive a 3-decibel increase in sound level as barely perceptible, a 5-decibel increase as noticeable, and a 10-decibel increase as twice as loud. 42. Noise impact on surrounding areas will increase with additional lanes; light rail would have overall lower noise level (1 commentor) Design-year noise levels in areas surrounding the Beltway are expected to increase over existing noise levels as a result of the project. The amount of the sound level increase varies with location along the Beltway Corridor. Along the Corridor, different neighborhoods would experience different noise level increases because some neighborhoods have existing noise barriers that would be removed (and then replaced) as a result of the widening while other neighborhoods do not. Distance from the highway also affects the amount of increase a neighborhood would experience. In general, neighborhoods close to the highway, where noise from the Beltway is clearly the dominant source, would experience greater increases in noise levels than neighborhoods farther from the highway, where noise from sources other than the Beltway may dominate. Other factors that affect the amount of noise level increase that an area would experience include variations in the projected traffic volumes between alternatives, as well as variations in highway geometry and lane configuration between alternatives. The noise effects of light rail transit alternatives were not evaluated in this study; such an assessment was beyond the scope of the project as defined at the outset. Although not considered B-52
445 Capital Beltway Study Public Comments and Responses in this study, the addition of a light rail transit line in lieu of more highway lanes could result in lower noise levels along the project corridor. Note that this general statement includes an assumption that the light rail alternative would be located along the median of the highway. Based on this assumption and depending upon the projected operations data for the peak hour, light rail transit could have a negligible effect on hourly noise levels. Under certain circumstances, however, projected noise levels from a light rail alternative could have a greater effect on hourly noise levels, particularly if the light rail alternative were located outside the highway right-of-way. 43. Concerns about noise barrier for Falls Hill area (1 commentor) Existing barriers along I-66 east of the Beltway would not be removed under the Preferred Alternative. Noise barriers 9F, 10E, and 10F were evaluated to mitigate the projected noise impacts in neighborhoods along I-66 from Virginia Lane to Barbour Road that would result from several of the Candidate Build Alternatives considered in the Draft EIS. However, these homes are outside the project improvement area for the Preferred Alternative. 44. Adequate mitigation to extend down exit ramps (1 commentor) Following FHWA and VDOT guidelines, noise barriers were evaluated everywhere noise impact is expected to occur as a result of the proposed improvements to the Capital Beltway. Due to the extent of future noise impact along the Beltway, noise barriers were evaluated to mitigate these impacts. In some cases, noise barriers would extend down exit ramps, and in other cases noise barriers would be located on fly-over ramps and bridges. The height, length, and location of all potential noise barrier walls were determined with the goal of providing substantial noise reductions at noise-sensitive properties exposed to noise impact. 45. The $30,000 per dwelling is artificially low; the height of the sound barrier for the Timberly South neighborhood is inadequate. (1 commentor) FHWA regulations allow State highway agencies some flexibility in determining the reasonableness, or cost-effectiveness, of noise abatement measures. FHWA suggests that an acceptable cost per residence expenditure should be within the range of $15,000 to $50,000 per residence [Highway Traffic Noise Analysis and Abatement; Policy and Guidance, U.S. Department of Transportation, Federal Highway Administration, Office of Environment and Planning, Noise and Air Quality Branch, Washington, D.C., June 1995]. VDOT s cost-effectiveness criterion falls near the middle of the suggested range, and is based on VDOT s experience with noise barrier construction trends across the Commonwealth over the past 20 years. As a result of VDOT s policy, Virginia has historically ranked among the top five states in the country for the number of barriers constructed. As summarized in Section of the Final EIS, Barrier 13B was evaluated to mitigate the potential noise impact in the Timberly South neighborhood. Barrier 13B would range in height from 5 to 8 meters (16 to 26 feet), and would provide 5 to 13 decibels of noise reduction at 37 residences exposed to noise impact in this neighborhood. The heights, length and location of Barrier 13B were determined using the FHWA-TNM, which incorporates state-of-the-art sound emissions and sound-propagation algorithms. The noise modeling takes into account the design of the road, the topography of the surrounding area, the distance between the road and nearby properties, the acoustical shielding provided by rows of buildings and other structures, sound propagation over different types of ground, traffic volumes and speeds, and vehicle mix including the percent of medium and heavy trucks. B-53
446 Appendix B Capital Beltway Study 46. Have noise barriers been taken into consideration for the Iliff Rehabilitation Center? (1 commentor) Because several residences in the vicinity would be exposed to noise impact along with the Iliff Rehabilitation Center, a noise barrier was evaluated for the northwest quadrant of the I-66 interchange. As shown in Figure 4-3c of the Final EIS, Barrier 10C would extend along the west side of the Beltway from Idylwood Road to Gallows Road, replacing a wall between Gallows Road and the vicinity of Sandburg Court. Under the Preferred Alternative this barrier would range in height from 3 to 5 meters (10 feet), would be approximately 1,562 meters (5,120 feet) long, and would protect 48 residences exposed to noise. Details of the preliminary design for Barrier 10C are summarized in Section of the Final EIS. Wherever possible, noise barriers will be constructed as soon as possible to allow the barriers to protect noise-sensitive areas from construction noise. 47. Construct noise barrier between Georgetown Pike and the Toll Road (1 commentor) In the Final EIS, a total of five noise barriers (13A, 13B, 13C, 13D, and 13E) were evaluated along the Beltway between the Dulles Toll Road and Georgetown Pike. Between Lewinsville Road and Georgetown Pike, two noise barriers would be located along the northbound side of I-495, and two noise barriers would be located along the southbound side. One barrier would extend from Lewinsville Road along the northwest quadrant of the Dulles Toll Road interchange to the west along the Dulles Toll Road. These five potential noise barriers would protect 188 residences (net) plus four parks and two churches. While two of the potential barriers meet VDOT s cost-effectiveness criterion, three of the noise barriers exceed VDOT s criterion of $30,000 per home protected (See Section of the Final EIS for a more detailed discussion). 48. Concerned that with increased traffic because of expansion, noise level will increase and make sleeping with windows open or even closed perhaps impossible or difficult and to have outdoor leisure activities will become difficult (1 commentor) As described in the Final EIS, design-year noise levels in areas surrounding the Beltway are expected to increase over existing noise levels as a result of the project. The amount of the sound level increase would vary with location along the project corridor, and would vary according to differences in roadway geometry and projected traffic volumes. Following FHWA and VDOT noise assessment guidelines, traffic noise levels and potential noise impact were evaluated with respect to the FHWA Noise Abatement Criteria (NAC). The FHWA NAC are based on levels of noise associated with interference with speech communication, and represent a compromise between noise levels that are desirable and those that are achievable. The NAC are not intended to address the potential for sleep disturbance that might occur along a highway corridor. As described in Chapter 2 of the Noise Technical Report, noise impact occurs when project noise levels approach or exceed the NAC during the loudest hour of the day. Noise abatement measures must be considered wherever noise impact is expected to occur. Due to the extent of noise impact that would occur as a result of the project, noise barriers were evaluated along much of the project corridor. 49. No policy for making noise levels acceptable only for reducing noise levels (1 commentor) B-54
447 Capital Beltway Study Public Comments and Responses FHWA policy requires that every reasonable effort be made to obtain substantial noise reductions when noise abatement measures are being considered. FHWA encourages that an attempt should be made to achieve the greatest noise reduction possible. In general, a substantial noise reduction is considered to fall within the range of 5 to 10 decibels, while a practical upper limit for the noise reduction provided by an outdoor noise wall is approximately 15 decibels. A noise reduction of 20 decibels is nearly impossible to achieve with an outdoor noise barrier. To understand the effects of noise reduction, a person with normal hearing would perceive a sound level decreased by 5 decibels as noticeable, while a sound level decreased by 10 decibels would be perceived as half as loud, and a sound level decreased by 15 decibels would be perceived as one-third as loud. The minimum noise reduction goal of 5 decibels, as stated in VDOT s Noise Abatement Policy, is the minimum noise reduction at which an impacted property is considered protected by a noise barrier. Affected properties that receive at least 5 decibels of noise reduction are included in the calculation of the barrier s cost per home to determine the reasonableness, or cost-effectiveness, of the barrier. 50. Concerns about the cost-effectiveness of Barrier 13A, as related to the number of homes protected by the barrier (3 commentors) The feasibility and reasonableness of Barrier 13A will be re-evaluated during project final design. If additional noise-sensitive land uses were constructed prior to the Commonwealth Transportation Board s approval of a final design, those noise-sensitive land uses are eligible for noise abatement considerations and would be included in the noise analysis during project final design. Note that the results of the noise barrier evaluation in the Final EIS are preliminary, and are intended to indicate the need for abatement and the potential for constructing noise barriers for all impacted properties throughout the study area. Final decisions on the noise barrier walls will be based on more detailed modeling during project final design; a re-evaluation of barrier cost-effectiveness or reasonableness, which will be based on up-to-date land use information; and the views of the affected property owners. 51. Noise protection technology has moved far beyond where it was in the past, in pursuit of this project would hope that such technology would be used. (1 commentor) Although it is difficult to predict what noise abatement technologies will be available 20 years into the future, VDOT is committed to the construction of high quality noise barrier walls making use of the latest sound absorptive treatments and materials. VDOT specifications (Metric Road and Bridge Specifications, Section , January 1997) place stringent requirements on the materials that can be used for noise barrier construction. While alternative methods of noise barrier construction can provide a desired noise reduction effect, this effect is usually minimal, as in the case of a special barrier top or cap, or the desired effect can be achieved just as well with sound absorptive treatments, as in the case of tilting the noise barrier in the vertical plane to minimize reflections. Some research has shown that a special barrier top, such as a T-profile top or a Y-profile top, can increase the noise reduction provided by a noise barrier of the same height with a standard top. Usually this increase is small (approximately 1 to 3 decibels), and can be achieved just as easily and at a lower cost by increasing the height of the barrier by B-55
448 Appendix B Capital Beltway Study approximately 1 meter (3 feet). The method of tilting the noise barrier away from the highway (in the vertical plane, by roughly 10 degrees) has been shown to help minimize the effect of multiple reflections between parallel noise barriers along both sides of a highway. However, because tilted barriers can sometimes have a negative visual impact due to the perception that the tilted wall is falling down. The application of sound absorptive materials on the highway side of the barrier(s) is more oftentimes used to minimize the effect of multiple reflections. 52. How does VDOT compensate homeowners for potential devaluation of property due to huge walls? How does VDOT prevent hearing damage to residents during construction, and how is the situation remedied if construction noise exceeds acceptable limits? (1 commentor) VDOT policy does not allow for compensation paid to homeowners for potential devaluation of property due to the construction of noise barriers. Limited research on the subject has yielded no conclusive findings on the relationship between property values and noise barrier construction. Following VDOT and FHWA procedures, the FHWA Noise Abatement Criteria (NAC) were used to determine the extent of traffic noise impact due to the Preferred Alternative. The NAC are based upon traffic noise levels associated with speech interference and represent a balance between noise levels that are desirable and those that are achievable. In contrast, the OSHA standards are based on allowable limits for noise exposure in the workplace. Note that in general, the OSHA limits allow for higher noise levels than the FHWA NAC. Typically, individual pieces of heavy equipment used in highway construction have reference A-weighted noise levels that range from the low 80 s (db) to the mid 90 s (db) at a reference distance of 15 meters (50 feet). Based on these reference noise levels at the reference distance and the fact that sound levels decrease with distance from the source, it is unlikely that residents in the communities surrounding the Beltway would be exposed to highway construction noise levels in excess of 96 dba, because most of the loudest construction operations would generally take place at distances greater than 15 meters (50 feet) from nearby homes. To minimize the effects of construction noise, VDOT s Road and Bridge Specifications contain noise control provisions, which include a noise limit of 80 dba for contractor operations when measured at an exterior location of a noise-sensitive area. These provisions also state that VDOT reserves the right to prohibit or restrict to certain portions of the project any work that produces objectionable noise during normal sleeping hours. 53. Have been trying to get a noise barrier, but it is also needed to keep deer from running out onto the Beltway. (1 commentor) Thirty-four noise barriers were evaluated along nearly the entire length of the study area, including eleven noise barriers that were evaluated to mitigate the potential impact at noisesensitive land uses. Section of the Final EIS summarizes all of the potential noise barriers that were evaluated in the study. B-56
449 Capital Beltway Study Public Comments and Responses While the effect of the proposed noise barriers on deer movements and migration were not addressed explicitly, Section 4.12 of the Final EIS states that since the existing Beltway already constitutes a barrier to wildlife movements and a constant threat of mortality to wildlife wandering onto the highway, the proposed improvements would not substantially change this condition. 54. Has VDOT considered new technologies as far as road building techniques are concerned - such as the use of rubberized asphalt concrete (ROC) to reduce noise? This material has been used in sound barriers (2 commentors) Extensive research in the United States and Europe has shown a benefit in the use of noise-reducing pavements such as open-graded asphaltic concrete (OGAC) and rubberized asphalt. A number of studies have demonstrated that OGAC can reduce tire-pavement noise by approximately 5 decibels (on average) when compared to vehicle noise emissions on dense-graded asphaltic concrete (DGAC). However, over a period of just a few years, the noise reducing capabilities of OGAC diminish to the point where vehicle noise emissions on OGAC are not much improved over DGAC. This degradation in the noise-reducing benefits of OGAC occurs over time as the voids in the porous sound-absorbing surface become clogged with debris. Although rubberized asphalt performs fairly well, OGAC has been found to provide somewhat better results. VDOT has not identified noise-reducing pavements as a noise abatement measure because federal funding is not currently available for the use of these pavements as a mitigation measure. FHWA would like to see more research into the effects of aging on the noisereducing capabilities of various pavements before these pavements can be accepted as a feasible noise abatement measure. While recycled rubber has been used in the manufacture of some sound absorptive noise barrier panels, VDOT utilizes a specially designed sound absorptive concrete material for ground-mounted noise walls and a lightweight material (typically perforated metal panels with sound absorptive filler) for structure-mounted noise walls. 55. To live near the Beltway, as unbearable as it is, and then increase the Beltway would make it even more horrible. (1 commentor) As described in the Final EIS, design-year noise levels in areas surrounding the Beltway are expected to increase over existing noise levels as a result of the project. The amount of the sound level increase would vary with location along the project corridor, and would vary between the three build alternatives depending on factors such as differences in roadway geometry and projected traffic volumes. Due to the extent of future noise impact along the Beltway, a total of 34 noise barriers were evaluated to mitigate these impacts. Section of the Final EIS provides the locations of the potential noise barriers throughout the study area. B.7 FUNDING AND IMPLEMENTATION Project Costs and Funding 1. Is there any money earmarked to increase parking at any of the Metro stations that fill up before 8 AM? (1 commentor) B-57
450 Appendix B Capital Beltway Study The provision of parking at the Metrorail stations is the responsibility of the Washington Metropolitan Area Transit Authority (WMATA). Planned improvements to the Metrorail system are programmed by WMATA according to their Transit Service Expansion Plan. 2. Supports higher gasoline taxes. (3 commentors) Comment noted. Construction Schedule and Phasing 3. Segment corridor into prioritized discreet projects to expedite work. (1 commentor) Due to the size (14 miles), complexity (ten interchanges) and cost (more than $890 million), both the design and construction of the proposed improvements would be conducted in phases. Dividing the project into smaller, discreet projects would shorten the design and right-of-way acquisition phase, increase competitive bidding, and minimize traffic disruption to a localized area (such as one interchange) during construction. A schedule for the design and construction phases has not been developed. 4. Construction impacts on traffic are not analyzed. (1 commentor) If improvements to the Beltway are recommended and approved for construction, a traffic management plan would be developed to address construction-related traffic issues. This plan would deal with issues such as: maintaining traffic on the Beltway, alternative routes through or around the construction zone, and the availability of alternative transportation modes. Temporary restrictions on local streets (i.e., no through traffic during certain hours) and increased prohibition of cut-through traffic could also be implemented during the construction period. Tolls / HOT Lanes 5. Supports Tolls or HOT lanes. (16 commentors) Comment noted. The Preferred Alternative includes HOT lanes. B.8 PUBLIC INVOLVEMENT 1. The public meetings should have been held in public buildings rather than at privately owned hotels. (5 commentors) When making arrangements to hold a public hearing, VDOT secures facilities that will accommodate the necessary equipment and have the amount of space needed to meet the needs of the attending citizens. Citizen groups who requested an opportunity to present their own materials at the hearings were given prior access to the formal presentation area, were able to place materials on the chairs where the public was seated, and were allowed to hold signs in the meeting room as long as they did not disrupt the view of others. 2. VDOT did not provide adequate notice for public meetings. (4 commentors) B-58
451 Capital Beltway Study Public Comments and Responses The National Environmental Policy Act (NEPA) requires reasonable notice to the public of a public hearing and the Federal Highway Administration (FHWA) requires each state highway agency to have approved procedures for carrying out a public involvement program. VDOT s procedures are in the Policy Manual for Public Participation In Transportation Projects, which was approved by FHWA on March 15, These procedures define adequate notice in terms of time and method of notice, and have been followed for all public meetings for this project. For the public hearings held for the Draft EIS, more than 3,900 newsletters were mailed to the individuals, businesses, associations, and interest groups on the project mailing list. These newsletters, which were mailed approximately one month prior to the hearings, contained the dates, time, and locations of the three public hearings. At the same time, to reach stakeholders who had not previously expressed interest in the project, postcards were mailed to all addresses in the zip codes adjacent to the Beltway Corridor, comprising more than 250,000 residences and businesses. Formal advertisements announcing the hearings were placed in the Washington Post and Washington Times, as well as local newspapers, such as the Journal and Times Connection newspapers, that are distributed throughout Fairfax County. These advertisements were published twice -- approximately 30 and 15 days prior to the hearings. In addition, letters announcing the public hearings were mailed to each of the groups VDOT met with during the course of the study to help ensure that their members were notified. Finally, to generate more interest in the hearings and ensure that a consistent message was conveyed to the public, press releases were mailed to the local media before the hearings and a press briefing was held on May 28, 2002, immediately prior to the first hearing. 3. Deadline for comments should be extended 90 days. (1 post card campaign with 53 submissions) VDOT typically provides a minimum of 45 days for the receipt of comments on a Draft EIS. This comment period generally starts with the publication of the Draft EIS and closes ten days after the public hearing. Due to the complex and controversial nature of the Beltway Study, VDOT extended the comment period to 117 days (March 15 through July 10). This decision was made to ensure the full participation and feedback of the public. 4. Meetings should not have been scheduled during a holiday week (1 commentor) The meetings were scheduled as early as possible. Waiting until after the holiday week would have placed the date farther into the summer season when more people are vacationing. In addition, the Draft EIS was available for review at Fairfax County government offices, VDOT s Northern District office, and local area libraries and at the study consultant s office for fortyfive days prior to the hearing. Following the public hearings, all informational materials available at the hearing were made available for review at VDOT s Northern District office and the study consultant s office until the comment period ended. B-59
452 Appendix B Capital Beltway Study B-60
453 C REEVALUATION C-1
454
455
456 Capital Beltway Study Table 1. Issue Evaluation Checklist Issue or Area of Concern TRANSPORTATION New Resource Present Traffic Volumes/Patterns/Time Yes No Public Transportation Yes No Highways Yes No Transportation Plan Yes No Freight Yes No LAND USE Land Use Conversion Yes No Development Yes No Consistent with Area s Comprehensive Plan Yes POPULATIONS & SERVICES No Populations Yes No Emergency Services Yes No Method of Review Revised Candidate Build Alternatives analyzed using the same travel forecast and operations model employed for Draft EIS. Review of current aerial photography supplemented by field reviews. Review of Fairfax County comprehensive plans. Review of current Fairfax County planning documents. Have the Impacts Changed? No significant change in operational impacts. Substantial reduction in right-of-way requirements. No change in consistency with local plans. No new impacts. Comment Mainline operations are comparable to Candidate Build Alternatives contained in the Draft EIS. Some reduced capacity is experienced at interchanges with revised alternatives. 12-Lane alternative is capable of accommodating HOT and HOV operations. Direct HOV / HOT connections are consistent with transportation elements in Fairfax County s comprehensive plans. FHWA has advised that an update of traffic model is not required. There have been no significant land use conversions or developments within the study area since the Draft EIS. Right-of-way requirements have been dramatically reduced under the revised alternatives. DEIS Candidate Build Alternatives required 118 to 168 acres of new right-of-way. The revised Candidate Build Alternatives require 5 to 10 acres of new right-of-way. Comprehensive plans or zoning ordinances have not changed such that the proposed action is no longer consistent with local plans and zoning. There have been no significant changes in populations since the completion of the Draft EIS. The Revised Candidate Build Alternatives will allow for improved emergency service times. 1-1
457 Capital Beltway Study Issue or Area of Concern RELOCATION IMPACTS New Resource Present Potential Relocations Yes No Environmental Justice Populations ECONOMIC IMPACTS Yes No Business Relocations Yes No Construction & Operations Employment VISUAL & AESTHETICS Yes No Method of Review Review of revised engineering plans. Review of current Fairfax County planning documents and census reports. Review of revised engineering plans. Review of current Fairfax County planning documents and census reports. Visual & Aesthetics Yes No Field review of project corridor and review of revised engineering plans. FARMLANDS Have the Impacts Changed? Substantial reduction in relocation impacts. Substantial reduction in commercial relocation impacts. Reduction in visual impacts. Comment Reduced right-of-way requirements have substantially reduced the number of potential relocations. The DEIS Candidate Build Alternatives could potentially displace 217 to 294 homes. The revised Candidate Build Alternatives would potentially displace 1 to 3 homes. No disproportionate impacts to minority or low-income populations would occur. Reduced right-of-way requirements have substantially reduced the number of potential commercial relocations. The DEIS Candidate Build Alternatives could potentially displace 31 to 32 local businesses. The revised Candidate Build Alternatives would not require any commercial relocations. Projections for construction and operations employment created through project implementation remain valid. Interchange designs have been reduced dramatically. Multi-level ramps and bridges have been reduced and therefore limiting the amount of visual intrusion caused by these structures. There have been no major changes in the visual character of the landscape along the Beltway corridor. Farmlands Yes No Not Applicable. Not Applicable. There are no farmlands present in this urban corridor (as noted in the Draft EIS). 1-2
458 Capital Beltway Study Issue or Area of Concern New Resource Present Method of Review Have the Impacts Changed? Comment NOISE & VIBRATION Noise Criteria Yes No Existing Noise Conditions Yes No Acoustical analysis of Revised Candidate Build Alternatives. Reduction in the number of potentially affected receptors. Noise predictions based on FHWA s Traffic Noise Model indicated that 2,949 to 3,113 dwellings would experience noise levels that approach or exceed 67dBA or experience substantial increases of 10 dba over ambient. This is less than potential impacts from the DEIS Candidate Build Alternatives which would potentially impact 3,672 to 3,879 dwellings. AIR QUALITY Existing Conditions Yes No Regional Compliance with the Standards Yes No Review of the current Conformity Standards Review of CLRP, TIP. No new impacts. Since publication of the DEIS, the Washington DC Metropolitan Area has been classified as a Moderate nonattainment area for ozone and nonattainment for PM 2.5. The Transportation Planning Board (Metropolitan Washington MPO) is developing the FY CLRP and the FY TIP. In February 2005, VDOT submitted the proposed action for the Capital Beltway Study for inclusion in the CLRP and TIP. The air quality conformity determination of the CLRP and TIP will be conducted and then released for public comment in July It is anticipated that the Air Quality Conformity Determination, the 2005 CLRP, and the FY TIP will be approved by the TPB in September ECOSYSTEMS Native Wildlife Yes No Existing Vegetation Yes No Threatened & Endangered Species Yes No Critical Habitat Yes No Wildlife and Waterfowl Refuges Yes No Field review and updated data search. Reduced impacts. The affected environment for the resources listed has not changed substantially since the completion of the Draft EIS. However, reduction in right-of-way requirements have resulted in reduced impacts to natural resources. There are no new reported sightings of threatened and endangered species in the project corridor or identification of new areas of critical habitat. 1-3
459 Capital Beltway Study Issue or Area of Concern WATER RESOURCES New Resource Present Surface Waters Yes No Dredging Requirements Yes No Public Water Supply Yes No AQUATIC RESOURCES Fish Yes No Submerged Aquatic Vegetation Yes No Benthos Yes No Other Flora and Fauna Yes No FLOODPLAINS Method of Review Field review and updated data search. Field review and updated data search. Floodplains Yes No Review of current FIRM mapping. WETLANDS Wetlands Yes No Field review and updated data search. Have the Impacts Changed? Reduced impacts.. Reduced impacts. Reduced impacts. Reduced impacts. Comment The affected environment for the resources listed has not changed substantially since the completion of the Draft EIS. However, reduction in right-of-way requirements for the Revised Candidate Build Alternatives have resulted in reduced impacts to water resources. Encroachment impacts to streams in the corridor have been reduced from 8,000 linear feet of impact to approximately 4,000 linear feet. There have been no changes to the public water supply in the project areas. The affected environment for aquatic resources has not changed substantially since the completion of the Draft EIS. However, reductions in the size of the Candidate Build Alternatives right-ofway requirements have resulted in reduced impacts to aquatic resources. The affected environment for floodplains has not changed substantially since the completion of the Draft EIS. However, reductions in the size of the Candidate Build Alternatives have resulted in reduced impacts to floodplains by approximately 4 to 5 acres. The affected environment for the resources listed has not changed substantially since the completion of the Draft EIS. However, reductions in the size of the Candidate Build Alternatives have resulted in reduced impacts to wetlands by approximately 0.8 acres. 1-4
460 Capital Beltway Study Issue or Area of Concern ENERGY New Resource Present Method of Review Energy Yes No Review of Draft EIS. HAZARDOUS WASTE SITES Hazardous Waste Sites Yes No Review of the Draft EIS and updated data search. COASTAL BARRIERS & COASTAL ZONE Coastal Barriers & Coastal Zone PUBLIC PARKLANDS Yes No Review of the FEIS. Public Parklands Yes No Review of mapping of new park boundaries for the expanded Accotink Stream Valley Park. Have the Impacts Changed? No new impacts. No impacts. Reduced impacts. Reduction to the total number of parks impacted. One new park effected. Comment The affected environment has not changed substantially since the completion of Draft EIS. In addition, revisions to the Candidate Build Alternatives would not alter the energy analysis that was recorded in the findings of the Draft EIS. No new hazardous material sites have been identified since the completion of the Draft EIS. In addition the reduction in the right-of-way requirements for the Revised Candidate Build Alternatives has eliminated all involvement with identified hazardous material sites. There has been no changes to the boundaries of these resource areas since the completion of the Draft EIS. However, reductions in the size of the revised Candidate Build Alternatives right-of-way requirements have resulted in reduced impacts to these special jurisdictions. The Fairfax County Park Authority purchased two contiguous parcels (26.85 acres) within the Accotink Stream Valley Park immediately west of the Little River Turnpike (Route 236) interchange. Proposed ramps within the interchange could potentially impact up to 0.4 acre of this new parkland representing a new parkland impact not evaluated in the Draft EIS. However, reductions of interchange and mainline designs have resulted in a reduction in the total number of parks impacted from 7 down to 4. And the total number of acres of parkland required is reduced from 15 to 19 acres down to 1 to 2.6 acres. (See Section 4(f) Evaluation on the following page). 1-5
461 Capital Beltway Study Issue or Area of Concern New Resource Present Method of Review HISTORIC & ARCHAEOLOGICAL RESOURCES Architectural Resources Yes No Archaeological Resources Yes No SECONDARY & CUMULATIVE Socioeconomic Impacts Yes No Natural Resource Impacts Yes No CONSTRUCTION IMPACTS Air Quality Yes No Noise Yes No Water Quality Yes No Review of the Draft EIS and updated data search. Discussions with Fairfax County planning staff. Review of potential construction techniques for the project. Have the Impacts Changed? Reduced impacts. No new impacts. Reduced impacts. Comment There has been no apparent change in the number of architectural, archaeological resources since the completion of the Draft EIS. However, the revision of the Gallows Road interchange now avoids potential impact to Holmes Run Acres Historic District. There have been no significant changes to the socioeconomic or natural environment since the completion of the Draft EIS. Therefore, secondary and cumulative impacts presented in the Draft EIS remain valid. Reduction in the size and mass of the Revised Candidate Build Alternatives will result in shorter construction periods and reduced constructionrelated impacts. Maintenance & Control of Traffic Yes No Health & Safety Yes No Pollution Control Yes No SECTION 4(f) EVALUATION Section 4(f) Evaluation Yes No Review of mapping of new park boundaries for the expanded Accotink Stream Valley Park. New Section 4(f) impact. The Fairfax County Park Authority purchased two contiguous parcels (26.85 acres) within the Accotink Stream Valley Park immediately west of the Little River Turnpike (Route 236) Interchange. Proposed ramps within the interchange could potentially impact up to 0.4 acre of this new parkland representing a new Section 4(f) use that was not evaluated in the Draft EIS. A complete evaluation of this new Section 4(f) use will be contained in the project s Final EIS. 1-6
462 Capital Beltway Study Issue or Area of Concern New Resource Present Method of Review Have the Impacts Changed? Comment PERMITS Compliance with E.O (Wetlands) Section 404 Permit (Clean Water Act) Section 10 Permit (Rivers & Harbors Act) Virginia Water Protection Permit Yes Yes Yes Yes No No No No Review of the Revised Candidate Build Alternatives and environmental regulations Reduced impacts. There have been no regulatory changes related to project development or construction activities. No significant changes to the affected environment have occurred that warrant additional study or change the findings of the Draft EIS. Those permits or compliances required for the Candidate Build Alternatives, as listed in the Draft EIS, remain valid. Subaqueous Bed Permit Yes No Coast Guard Permit Yes No Compliance with the ESA Yes No Compliance with Section 106 of the National Historic Preservation Act Compliance with Section 4(f) of the 1966 Department of Transportation Act Compliance with E.O (Environmental Justice) Consistency with Coastal Zone Management Act Compliance with E.O (Floodplains) Erosion & Sediment Control Laws Yes Yes Yes Yes Yes Yes No No No No No No Stormwater Management Act Yes No MITIGATION MEASURES Relocations Yes No Farmlands Yes No Noise Yes No Threatened & Endangered Species Yes No Review of the mitigation measures prescribed in the Draft EIS. Overall, reduced impacts. The types of impacts associated with the Revised Candidate Build Alternatives are consistent with those described in the Draft EIS but generally at reduced levels. The types of mitigation measures recommended in the Draft EIS are therefore still valid. 1-7
463 Capital Beltway Study Issue or Area of Concern New Resource Present MITIGATION MEASURES (CONTINUED) Floodplains Yes No Wetlands Yes No Water Quality Yes No Aquatic Resources Yes No Hazardous Waste Sites Yes No Construction Impacts Yes No Air Quality Yes No Noise Yes No Water Quality Yes No Method of Review Have the Impacts Changed? Comment Maintenance & Control of Traffic Yes No Health & Safety Yes No Pollution Control Yes No 1-8
464 Capital Beltway Study Table 2. Summary of Environmental Impacts No-Build Revised Final EIS 12-Lane HOT CANDIDATE BUILD ALTERNATIVES 10-Lane HOV Concurrent HOV (10 Lanes) Draft EIS Express/ Local with HOV (10 Lanes) Barrier- Separated HOV (12 Lanes) Noise Impacts (dwellings) 3,054 3,113 2,949 3,879 3,717 3,672 Dwellings Protected and Benefited by Noise Barriers NA 4,168 4,241 5,123 5,199 5,129 Homes Displaced Businesses Displaced Community Facilities Displaced tennis courts 0 Carbon Monoxide (ppm) 1 hr Range from 10 sites 8 hr Public Parks Impacted Parkland Required (acres) Adverse Effects to Historic Resources Wetlands Displaced (acres) Impacted Length of Streams (feet) Floodplain Encroachments (acres) Potential Hazardous Material Sites Threatened and Endangered Species 0 4,451 4,235 8,262 8,031 8, Length of Alternative (miles) Right-of-Way Required (acres) Right-of-Way, Utilities, and Relocation Costs (millions) $0 $7.6 $2.9 $345 $423 $402 Construction Costs (millions) $0 $891 $783 $2,340 $2,830 $2,
465 D DESIGN EXCEPTIONS The following provides a list of the potential design exceptions for the Preferred Alternative. These exceptions were incorporated into the conceptual designs to further reduce potential impacts to parks, residential areas and Metro s Orange Line tracks. Existing curve radii and design speeds are detailed for each specific location along with current requirements and what has been designed in the proposed improvements. Included with each potential design exception is a brief description indicating the types of impacts avoided and/or minimized. Design exceptions used in the conceptual design have not been approved by FHWA. Consequently, VDOT will need to submit a formal design exception request to FHWA before any design exceptions can be incorporated into the final design plans. The existing radii and related design speeds presented below have been estimated with the use of MicroStation CAD files created through aerial photography and surveys. The required standard radii and design speeds listed below were derived from the design criteria set forth using the 2001 AASHTO A Policy on Geometric Design of Highways and Streets and VDOT s Road Design Manual (Rev 7/05). In addition, the proposed radii and design speeds represent those of the final preliminary design presented in the Final EIS. Because many of the ramps in the design have multiple curves, the sharpest curve was used to determine the need for a potential design exception. The information is presented by interchange starting at the southern limit of the project. Braddock Road Interchange Loop Ramps Existing Radius/ Standard Radius/ Proposed Radius/ (Sharpest Curve) Design Speed Design Speed Design Speed NE Quadrant 180 /25 mph 250 /30 mph 210 /25 mph (Standard design criteria would require impacts to several homes in the NE quadrant and increase impacts to Fitzhugh Park.) SW Quadrant 180 /25 mph 250 /30 mph 210 /25 mph (Standard design criteria would require impacts commercial properties along Port Royal Road in the SW quadrant.) NW Quadrant 160 /25 mph 250 /30 mph 175 /25 mph (Standard design criteria would increase impacts to Wakefield Park and the existing trail through the park.) D-1
466 Capital Beltway Study Appendix D Route 236 Interchange Loop Ramps Existing Radius/ Standard Radius/ Proposed Radius/ (Sharpest Curve) Design Speed Design Speed Design Speed NE Quadrant 200 /25 mph 250 /30 mph 210 /25 mph (Standard design criteria would require reconfiguration of Lafayette Village Drive and impacts to homes in the NE Quadrant.) SE Quadrant 150 /25 mph 250 /30 mph 180 /25 mph (Standard design criteria would require reconfiguration of Americana Drive and impacts to the townhouse community in the SE quadrant.) NW Quadrant 190 /25 mph 250 /30 mph 220 /25 mph (Standard design criteria would increase impacts to Accotink Stream Valley Park and impact two major utility towers in the NW quadrant.) At-Grade Directional Ramps EB to SB 180 /25 mph 250 /30 mph 230 /25 mph (Standard design criteria would require impacts to Americana Park.) Gallows Road Interchange Loop Ramps Existing Radius/ Standard Radius/ Proposed Radius/ (Sharpest Curve) Design Speed Design Speed Design Speed 200 /25 mph 250 /30 mph 200 /25 mph (Standard design criteria would require additional ROW in the NW quadrant and also would further shorten the weave distance between the Route 50 and Gallows Road intersection.) Length of Auxiliary Lanes Off Ramp SB (weaving movements between Rte 50 and Gallows Road SB) (Standard design criteria for the weave length would require further reduction of substandard loop ramps at both interchanges.) I-66 Interchange Loop Ramps Existing Radius/ Standard Radius/ Proposed Radius/ (Sharpest Curve) Design Speed Design Speed Design Speed Between Mainlines 135 /20 mph 250 /30 mph 150 /25 mph (Standard design radius doesn t fit between NB and SB I-495 and realignment of the beltway would require additional impacts to adjacent properties, W&OD Trail, I-66, and the Metro line.) D-2
467 Design Exceptions Capital Beltway Study Route 7 Interchange Loop Ramps Existing Radius/ Standard Radius/ Proposed Radius/ (Sharpest Curve) Design Speed Design Speed Design Speed NE Quadrant 150 /20 mph 250 /30 mph 170 /25 mph (Standard design criteria would require reconfiguration of Corporate Ridge and impacts to commercial properties.) SE Quadrant 130 /20 mph 250 /30 mph 160 /25 mph (Standard design criteria would require impacts to commercial properties.) SW Quadrant 170 /25 mph 250 /30 mph 200 /25 mph (Standard design criteria would require impacts to commercial properties.) Route 123 Interchange Loop Ramps Existing Radius/ Standard Radius/ Proposed Radius/ (Sharpest Curve) Design Speed Design Speed Design Speed SE 230 /30 mph 250 /30 mph 200 /25 mph (Standard design criteria would require impacts to commercial properties.) SW Quadrant ramp New 250 /30 mph 200 /25 mph (Standard design criteria would require impacts to commercial properties and existing bridge crossing Route 123 west of the Capital Beltway.) Dulles Toll Road Interchange Ramp Curve Ex. Ramp NB to WB 350 /35 mph 465 /40 mph 390 /35 mph (Standard design would require commercial impacts in the NE quadrant and reconfiguration of Dulles Toll Road.) HOT Ramp NB to WB New 465 /40 mph 370 /35 mph (Insufficient space to meet design standard.) Ex. Ramp EB to NB 400 /35 mph 465 /40 mph 400 /35 mph (1) (Standard design would require impacts to commercial properties in SE quadrant.) Ex. Ramp SB to EB 300 /30 mph 465 /40 mph 340 /30 mph (Standard design would require impacts to residential properties in NW quadrant.) HOT Ramp SB to EB New 465 /40 mph 300 /30 mph (Insufficient space to meet design standard.) (1) Ramp is tied to existing before curve, so the substandard design is not being modified. D-3
468 Capital Beltway Study Appendix D Length of Auxiliary Lanes Off Ramp NB (Right) N/A (Weave Section) (Extension of weave length would require reduction in the radius of the ex. Ramp NB to WB at this intersection which is already below standard.) On Ramp SB (Weave Section) (Insufficient space to meet design standard.) C-D Lanes: Continuous C-D Lanes are required but not provided between Gallows Road, Route 50 and I-66. Continuous C-D Lanes between Route 7, Route 123 and Toll Road are required but not provided. (To provide C-D lanes at all necessary locations would require increased impacts along both sides of the Capital Beltway and would increase commercial and residential impacts.) D-4
469 E QUALITATIVE HOTSPOT ANALYSES FOR PM2.5 AND PROJECT-LEVEL CONFORMITY DETERMINATION E.1 PURPOSE OF THIS DETERMINATION Section 176(c) of the Clean Air Act requires that federally supported highway and transit projects and activities be consistent with state air quality goals, found in the State Implementation Plan (SIP). The process to ensure this consistency is called Transportation Air Quality Conformity. Conformity to the SIP means that the transportation activities will not cause new violations of the National Ambient Air Quality Standards (NAAQS or standards ), worsen existing violations of the standard, or delay timely attainment of the relevant standard. Transportation conformity is required for federally supported transportation projects in areas that have been designated by the U.S. Environmental Protection Agency (EPA) as not meeting one of the NAAQS. These areas are called nonattainment areas if they currently do not meet air quality standards or maintenance areas if they have previously violated air quality standards, but currently meet them and have an approved Clean Air Act maintenance plan. On January 5, 2005, the EPA designated the Washington, DC-MD-VA area as nonattainment for fine particulate matter, called PM2.5. This designation became effective on April 5, 2005, 90 days after EPA s published action in the Federal Register. Transportation conformity for the PM2.5 standards became effective April 5, 2006, following the one-year grace period provided by the Clean Air Act. Effective this date, metropolitan PM2.5 nonattainment areas must have a fiscally constrained long- range transportation plan (CLRP) and Transportation Improvement Program (TIP) in place that conforms; in certain instances, federally supported projects must also be shown to conform if they are not included in a CLRP and TIP. An additional requirement for PM2.5 is that a project-level conformity determination is also required for certain projects based on an assessment of localized emission impacts. This localized assessment is called a hotspot analysis. The 14-mile segment of the Capital Beltway Improvement Project is within the Washington, DC-MD-VA PM2.5 nonattainment area; and, therefore, the project is required to meet Transportation Conformity requirements found in 40 CFR Part 93 as amended. EPA amended the Transportation Conformity Rule on March 10, , requiring a hotspot 1 EPA posted the final rule on its website on March 1, 2006 and the final rule was published in the Federal Register on March 10, E-1
470 Capital Beltway Study Appendix E analysis as part of the project-level conformity determination in PM2.5 nonattainment areas for certain projects. On March 29, 2006, EPA and the Federal Highway Administration issued joint guidance for conducting qualitative hotspot analyses to meet the requirements established in the March10 th final Transportation Conformity Rule (71 FR 12468). This appendix addresses the project-level transportation conformity requirements for the proposed Capital Beltway improvements, including a qualitative hotspot analysis that is described in greater detail in Section E.5 below. E.2 PROJECT DESCRIPTION E.2.1 General The Federal Highway Administration (FHWA), in conjunction with the Virginia Department of Transportation (VDOT), proposes to improve the Capital Beltway (I-495) in Fairfax County, Virginia, between the I-95/I-395/I-495 interchange and the American Legion Bridge. The project is located in Northern Virginia. Improvements are needed to increase the Beltway s capacity to accommodate expected growth in daily traffic volumes and remedy current congestion, operational deficiencies, and safety problems on this critical link in the region s transportation system. Constructed as part of the Interstate highway system, the Beltway was originally designed to serve through traffic bypassing Washington, DC. However, since its completion in 1964, the growth of the Washington, DC metropolitan area and changes in travel patterns have made the Beltway an integral part of the regional transportation system. Instead of functioning as a bypass, the Beltway is now used primarily for travel to and from destinations within the region. Each day hundreds of thousands of local residents use the Beltway to get to work, shop, and travel throughout the metropolitan area. The proposed improvements to the Beltway and its interchanges would extend for about 14 miles from Backlick Road to the American Legion Bridge (see Figure 1-2 in the final EIS). The FHWA has determined that these termini are logical and that improving this portion of the Beltway has independent utility. The project also would include improvements to portions of 10 roadways that intersect and connect to the Beltway via existing interchanges at Braddock Road, Little River Turnpike, Gallows Road, Arlington Boulevard, Interstate 66, Leesburg Pike, Chain Bridge Road, Dulles Access / Toll Road, Georgetown Pike, and the George Washington Memorial Parkway. Modifications to these roadways would be necessary to properly integrate the proposed Beltway and interchange improvements with existing (or planned) roadway designs and traffic patterns. Improvements to the remainder of the Beltway in Virginia and to the Maryland Beltway are not included as part of this project. E.2.2 Preferred Alternative Based on input received at the Location Public Hearing held in May 2002, the Public Information Meetings held in June 2004, and additional analysis and agency input, the 12-Lane High Occupancy Toll (HOT) Alternative was adopted by the Commonwealth Transportation Board (CTB) as the project s Preferred Alternative on January 20, This alternative would add two HOT lanes to the Capital Beltway in each direction and modify, improve and reconfigure the interchanges within the project s limits to increase capacity, reduce congestion, and improve safety. E-2
471 Conformity Determination Capital Beltway Study Under this alternative, the Beltway would have a total of 12 through lanes: four generalpurpose lanes and two HOT lanes in each direction, i.e., a configuration. The two far left lanes in each direction would be designated as HOT lanes and separated from the general-purpose lanes with a 4-foot buffer strip. The HOT lanes would be used by High Occupancy Vehicles (assumed to be HOV-3+ (three or more occupants) for purposes of developing the Environmental Impact Statement (EIS)), buses, and tolled low occupancy vehicles with less than three occupants. See Figures 2-1 and 2-2 of the final EIS for cross section and plan views of the Preferred Alternative. The main advantage of this roadway type is the capacity it provides for both HOV and HOT traffic, thereby encouraging car-pooling and bus ridership by facilitating movement throughout the HOV/HOT roadway network. Accordingly, the HOT lanes would have direct access/egress to the existing and anticipated HOV facilities located at four of the interchanges in the project area: Braddock Road, I-66, Route 123, and the Dulles Access/Toll Road, as well as direct HOT access to and from Lee Highway (Route 29). Collector-distributor (C-D) roadways would be barrier-separated from the mainline roadways at interchanges and also between closely spaced interchanges to minimize movement conflicts and to improve safety and traffic operations. Continuous C-D roadways would be provided in both directions between Gallows Road and Route 50 (there is also an existing C-D road at Route 7 and along the northern portion of the Dulles Access/Toll Road). Generally, connection to interchanges would be made via the C-D roadways; however, direct access/egress would also be provided from the main roadways at selected interchanges. The locations where direct access/egress would occur are southbound at Gallows Road, I-66 (both directions), Route 123 (both directions), and Georgetown Pike. Northbound traffic at Gallows Road would have direct access, but egress onto a C-D road. The Dulles Access/Toll Road would have direct access northbound but egress onto a C-D road, while southbound traffic at the Dulles Access/Toll Road would have direct egress, with access via a C-D road. Left exits and entrances for non-hov traffic, from the mainline and the C-D roadways, would be eliminated. The existing left exits and entrances would be retained to serve HOV/HOT traffic only. At the northern end of the project segment, the 12-lane roadway configuration would transition to match the roadway cross-section prior to the George Washington Memorial Parkway interchange. The required transition in the I-495 mainline cross section would begin after the Dulles Access/Toll Road. The improvements to the southbound I-495 roadways would also begin south of the George Washington Memorial Parkway. Similarly, at the southern end of the project segment, the I-495 mainline cross section would tie into the I-95/I-395/I-495 interchange improvements immediately north of the Beltway bridge crossing over the Norfolk Southern Railway. At this location, the Beltway cross section would consist of a 12-lane cross section. Most of the recommended improvements would be accommodated within the existing right-of-way. A limited amount of additional right-of-way (approximately 10 acres) will be necessary because of widening at a few locations. The proposed improvements that would reduce traffic congestion and enhance traffic operation and safety are: Additional capacity by adding four lanes to the Beltway. E-3
472 Capital Beltway Study Appendix E Replacement of left exit and entrance ramps for general traffic with right exit and entrance ramps; this would eliminate multilane weaving and improve traffic safety and operation. Existing loop ramps that have radii smaller than the minimum design standard would be improved or replaced. Some minor design exceptions for loop ramps would be sought at locations where potential impacts to parks, residences and Metro s Orange Line could occur. Interchange configurations would be modified to reduce traffic congestion by eliminating the weaving movements at Braddock Road, Little River Turnpike (Alternative), and Chain Bridge Road interchanges. For instance, traffic weaving movements at the Chain Bridge Road interchange would be eliminated through the use of a flyover ramp southbound and the replacement of a loop ramp with left turn lanes for northbound traffic. Direct HOV/HOT access would also be provided at the Lee Highway (Route 29) crossing of the Beltway. This access would involve two center access ramps for HOV/HOT traffic only: one from the northbound I-495 HOT lanes to Lee Highway in either direction, and one from Lee Highway in either direction to the southbound I-495 HOT lanes. There would be no HOV/HOT access from southbound I-495 or to northbound I-495, nor any access for non-hov/hot traffic. A traffic signal would be required on Lee Highway at this location. The construction costs for the Preferred Alternative are estimated at $891 million (in Year 2002 dollars). Right-of-way costs are estimated to be $7.6 million. (Note: A supplemental estimate was prepared to forecast these same costs for the anticipated year of expenditure which represents the mid-point of construction. The escalated construction cost for the future year is $1.15 billion and the escalated right-of-way cost is $18.9 million.) E.3 BACKGROUND E.3.1 What is Fine Particulate Matter (PM2.5)? Particulate matter (PM) is the term for particles and liquid droplets suspended in the air. Motor vehicles (i.e., cars, trucks, and buses) emit direct PM from their tailpipes, as well as from normal brake and tire wear. In addition, vehicles cause dust from paved and unpaved roads to be re-entrained, or resuspended, in the atmosphere. Also, highway and transit projects construction may cause dust. Finally, gases in vehicle exhaust may react in the atmosphere to form PM. Particles come in a wide variety of sizes and have been historically assessed based on size, typically measured by the diameter of the particle in micrometers. PM2.5, or fine particulate matter, refers to particles that are 2.5 micrometers in diameter or less. (Note: A human hair is about 70 micrometers in diameter and a grain of sand is about 90 micrometers in diameter. The NAAQS for fine particulate matter include an annual standard of 15 micrometers per cubic meter (µg/m 3 ) and a 24-hour standard of 65 µg/m 3 ). The annual standard is based on a 3-year average of annual PM2.5 concentrations; the 24- E-4
473 Conformity Determination Capital Beltway Study hour standard is based on a 3-year average of the 98th percentile of the 24-hour concentrations. E.3.2 Statutory Requirements for PM Hotspot Analyses On March 10, 2006, EPA issued amendments to the Transportation Conformity Rule to address localized impacts of particulate matter: PM2.5 and PM10 Hotspot Analyses in Project-level Transportation Conformity Determinations for the New PM2.5 and Existing PM10 National Ambient Air Quality Standards (71 FR 12468). These rule amendments require the assessment of localized air quality impacts of federally-funded or approved transportation projects in PM2.5 or PM10 nonattainment and maintenance areas deemed to be projects of air quality concern 2. This assessment of localized impacts (i.e., hotspot analysis ) examines potential air quality impacts on a scale smaller than the entire nonattainment or maintenance area. Such an analysis is a means of demonstrating that the transportation project meets Clean Air Act conformity requirements to support state and local air quality goals. Qualitative hotspot analysis is required for projects of air quality concern until such time as EPA releases its future quantitative modeling guidance and announces that quantitative PM2.5 hotspot analyses are required under 40 CFR (b)(4). In the interim, EPA and FHWA have issued joint guidance for conducting qualitative hotspot analyses 3. EPA requires hotspot findings to be based on directly emitted PM2.5, since secondary particles take several hours to form in the atmosphere, giving emissions time to disperse beyond the immediate area of concern. The Conformity Rule requires PM2.5 hotspot analyses to include road dust emissions only if such emissions have been found significant by EPA or the state air agency prior to the PM2.5 SIP or as part of an adequate PM2.5 SIP motor vehicle emissions budget (40 CFR (b)(3)). Emissions resulting from construction of the project are not required to be considered in the hotspot analysis if such emissions are considered temporary according to 40 CFR (c)(5). E.4 PM2.5 REGIONAL CONFORMITY DETERMINATION Section 176(c) of the Clean Air Act and the federal conformity rule require that transportation plans and programs conform to the intent of the state air quality implementation plan (SIP) through a regional emissions analysis in PM2.5 nonattainment areas. The National Capital Region 2005 Constrained Long Range Transportation Plan (CLRP) and the Metropolitan Transportation Improvement Program (TIP) have been determined to conform to the intent of the SIP. The U.S. Department of Transportation made a PM2.5 conformity determination on the CLRP and the MTIP on February 21, 2006, and thus there is a currently conforming CLRP and TIP in accordance with 40 CFR The current conformity determination is consistent with the final conformity rule found in 40 CFR Parts 51 and 93. The Capital Beltway project was included in the regional emissions analysis and there have been no significant changes in 2 Criteria for identifying projects of air quality concern is described in 40 CRF (b)(1), as amended. 3 Transportation Conformity Guidance for Qualitative Hotspot Analysis in PM2.5 and PM10 Nonattainment and Maintenance Areas. EPA420-B March 29, E-5
474 Capital Beltway Study Appendix E the project s design concept or scope, as used in the conformity analyses. Therefore, the Capital Beltway Improvement Project comes from a conforming plan and program in accordance with 40 CFR E.5 PM2.5 HOTSPOT ANALYSIS As noted previously, EPA s final rule on PM2.5 hotspot analyses required a localized assessment for projects of air quality concern. FHWA has reviewed the Capital Beltway Improvement Project and determined that it meets the criteria set forth in 40 CFR (b)(1) as amended for projects of air quality concern because it is an expanded highway facility with an ADT that exceeds the threshold established in the final rule and the facility carries a significant number of diesel vehicles. Construction-related emissions for the project were considered to be temporary since the project will be completed within the next five years, meeting the criterion set forth in 40 CFR 193(c)(5). Therefore, construction-related emissions have not been considered in this hotspot analysis. EPA has not approved a PM2.5 SIP for Virginia, nor has EPA or the Virginia Department of Environmental Quality (state air agency) made any significance findings related to reentrained road dust for the Washington, DC-MD-VA PM2.5 nonattainment area. Therefore, re-entrained road dust is not considered in the analysis, per the Conformity Rule. In addition, there is no applicable PM2.5 SIP, there are no PM2.5 control measures, and the project is in compliance with 40 CFR According to 40 CFR (b)(2) and (4), a quantitative analysis for applicable projects is not required until such time as EPA releases modeling guidance in the Federal Register. However, a qualitative hotspot analysis is still required. For the Capital Beltway Improvement Project, a qualitative hotspot analysis was conducted in order to assess whether the project would cause or contribute to any new localized PM2.5 violations, or increase the frequency or severity of any existing violations, or delay attainment of the PM2.5 NAAQS. E.5.1 Existing Conditions The affected area for the purposes of this analysis is the Capital Beltway study area, as discussed in Section 2 of this document and further elaborated in Chapter 3 of the final EIS. This section includes a discussion of currently available information on existing conditions related to air quality and traffic conditions in the study area. Air Quality Monitors There are currently thirteen air quality monitors in the Washington, DC-MD-VA PM2.5 nonattainment area: five in the Commonwealth of Virginia, four in the State of Maryland, and four in the District of Columbia. Based on 2005 air quality monitoring data, there are three monitors that exceed the annual mean PM2.5 standard of 15 µg/m 3 : one in Virginia and two in DC. None of the monitors in the PM2.5 nonattainment area are exceeding the 24-hour PM2.5 standard of 65 µg/m 3. Table E-1 provides a summary of the 2005 air quality monitoring data. E-6
475 Conformity Determination Capital Beltway Study Table E MONITORS IN WASHINGTON, DC-MD-VA PM 2.5 NONATTAINMENT AREA Monitor Number and Name Number of Observations (24-hour) 98 th Percentile (24-hour) Annual Mean (24-hour) Franconia, VA (L-46-B9) Annandale, VA (L-46-C1) McLean, VA (L-46-A8) Ashburn, VA Pentagon City, VA Muirkirk, MD Rockville, MD Upper Marlboro, MD # Upper Marlboro, MD # RFK Stadium, DC # RFK Stadium, DC # Howard University, DC Tidal Basin, DC Sources: Virginia and Washington, DC data: US Environmental Protection Agency, Office of Air Quality Planning and Standards, Information Transfer and Program Integration Information Transfer Group. AIRS Data (website: http;// Maryland data: Maryland Department of the Environment. Air Monitoring Program. The Virginia Department of Environmental Quality (VDEQ) and the Fairfax County Health Department operate three air quality monitoring stations in the project area: Doctor s Exchange at 6120 Brandon Avenue in Franconia (Station No. L-46-B9); Mason Government Center at 6507 Columbia Pike (Route 244) in Annandale (Station No. L-46-C1); and McLean Government Center at 1437 Balls Hill Road in McLean (Station No. L-46-A8). See Figure 3-9 in the final EIS for the locations of these monitoring sites. As indicated in Table E-1, the annual mean for each of these monitoring sites is currently below the NAAQS for PM2.5 (annual and 24-hour) and no violations have been recorded. These same trends are being experienced by the region as a whole. A recent report published by the Metropolitan Washington Council of Governments (MWCOG) demonstrates a downward trend in annual average PM2.5 design values between 1999 and 2004 for the Metropolitan Washington, DC region. 4 Traffic and Transportation Conditions Average daily traffic (ADT) volumes on the 14-mile segment of the Capital Beltway between the Springfield Interchange and the American Legion Bridge vary among segments. In 2004, the daily volumes ranged from 165,000 vehicles (Braddock Road Little River Turnpike) to 205,000 vehicles 4 Air Quality Trends: Metropolitan Washington Region Metropolitan Washington Council of Governments, E-7
476 Capital Beltway Study Appendix E (Route 50 I-66). The types of vehicles traveling on this portion of the Beltway are fairly consistent throughout: automobiles comprise 94 95% of vehicle mix with trucks and buses making up the remaining 5 6%. Chapter 2 of the final EIS includes a complete presentation of the traffic data. Built and Natural Environment The Capital Beltway traverses a well-developed suburban segment of Fairfax County. Lands along the highway facility are extensively developed with little developable land available. Land uses include commercial, residential, industrial, public facilities, and park properties. Development has occurred at each of the ten major interchanges as well as along the highway mainline. More than 14 miles of noise barriers exist along this segment of interstate highway, with twice this amount proposed as part of future improvements. Chapter 3 of the final EIS contains a detailed description of existing as well as future land uses. E.5.2 Future Scenario According to a recent report by the Regional Transportation Planning Board 5, PM2.5 annual emissions associated directly to on-road mobile sources are expected to decrease by 56% in 2010 from a 2002 baseline. Emissions estimates using EPA s approved emissions estimation tool, MOBILE6.2, show that PM2.5 emissions rates from vehicles will drop by almost 50% between 2010 (anticipated completion of Beltway construction) and 2030 (the project design year). In the MWCOG PM2.5 conformity assessment, regional emissions of direct PM2.5 from on-road mobile sources show a continued decline through 2020, and they show that the regional emissions of direct PM2.5 from on-road mobile sources are well below the 2002 baseline for all milestone years (2010, 2020, and 2030). According to EPA, the 2007 heavy-duty engine standards will result in the introduction of new, highly effective control technologies for heavy-duty engines. Particulate matter emission levels are expected to be 90% lower on a per vehicle basis than 2000 standard levels due to the 2007 diesel engine and fuel program. 6 Improvements to the Capital Beltway are intended to provide additional roadway capacity in the study area to accommodate current and future demand and to link regional HOV systems (e.g., I-95, Braddock Road, I-66, Route 123, and the Dulles Toll Road). Increasing the capacity on the Beltway through the use of managed lanes will reduce congestion on the Interstate facility and, as a result, remove cut-through traffic from nearby local roadways. In addition to improving safety, the proposed improvements will help reduce stop-and-go traffic and extended idling and will improve traffic flow in the area overall. Chapter 2 of the final EIS includes a complete presentation of the traffic data. E.5.3 Analytical Considerations In accordance with the March 29, 2006 guidelines, a project-level analysis was conducted to qualitatively assess whether the proposed Beltway improvements would be expected to 5 Fine Particles (PM2.5) Standards Air Quality Assessment. National Capital Regional Transportation Planning Board, Metropolitan Washington Council of Governments. December 21, Heavy-duty Engine and Vehicle Standards and Highway Diesel Fuel Sulfur Control Requirements Final Rule. ( 2007 Heavy Duty Highway Final Rule ). Signed December 21, E-8
477 Conformity Determination Capital Beltway Study cause violations of the PM2.5 standards, worsen existing violations of the standard, or delay timely attainment of the relevant standard. The analysis considered worst case traffic impacts (i.e., highest daily traffic volumes) along with existing air quality data from air quality monitors in the project area plus regional air quality findings issued by the MWCOG. To conduct the project-level analysis, FHWA and VDOT reviewed traffic data for the Capital Beltway and nearby roadways to identify worst-case locations along the corridor. This review led to the assessment of three sites with the highest daily traffic volumes (see Table E-2). Table E-2 WORST-CASE LOCATONS FOR TRAFFIC AND TRUCK IMPACT Location 2004 Average Daily Traffic (ADT) 2020 Average Daily Traffic (ADT) Trucks (percent) 1. I-95 / I-395 / I , ,000 7% 2. I-495 / US , ,000 6% 3. I-495 / Dulles Toll Road 215, ,000 6% The location with the highest overall traffic volumes in the corridor is the interchange of Interstate 95 with the Capital Beltway (Location No. 1). Today more than 370,000 vehicles pass through this interchange daily, making it one of the highest traffic volumes locations in the Northern Virginia area. By the year 2020, volumes are expected to increase by approximately 50 percent to 555,000 vehicles per day. This location also has the highest mix of trucks and buses within the corridor. The second highest location (Location No. 2) is at the interchange of US 50 and the Beltway. Current daily volumes for this location are 218,000 and are expected to increase to 310,000 by This forecasted growth (42 percent) and percent trucks is slightly less than that for the I-95/I-495 interchange to its south. The third highest location (Location No. 3) is located on the north end of the corridor at the interchange of I-495 and the Dulles Toll Road. Existing daily traffic volumes are 215,000 and are slightly less than Location No. 2. The percent trucks is approximately the same. Although these three sites represent worst case locations for air quality analysis, they are felt to be representative of the entire corridor in terms of land uses, traffic volumes, and truck percentages. As described in Section E.5.1, air quality data was provided by the Virginia Department of Environmental Quality (VDEQ) and the Fairfax County Health Department for the monitors located near the three worst-case locations noted above. The meteorology at these sites as well as along the entire project corridor can be generally characterized as variable. Light winds generally tend to disperse PM2.5 emissions at these sites. In addition, temperature, humidity, and rainfall do not seem to influence the level of PM2.5 at the sites. As indicated in Table E-1, the 2005 annual average PM2.5 concentrations at each of the three worst-case sites range from 13.4 to 14.7 ug/m 3, all below the annual NAAQS for PM2.5 of 15 ug/m 3. In 2005, the 98 th percentile reading for the 24-hour PM2.5 concentration at these sites were 35 to 36 ug/mg 3, all well below the 24-hour NAAQS of 65 ug/mg 3. E-9
, the conformity rule requires that project-level analyses consider the year of expected")
478 Capital Beltway Study Appendix E Future year levels of PM2.5 emissions have also been considered as part of this project-level analysis. As clarified in the preamble to the July 1, 2004 revision to the Transportation Conformity Rule (64 FR 40056), the conformity rule requires that project-level analyses consider the year of expected peak emissions from the project. For PM2.5, this is expected to be a near-term year, such as the first year of operation for the Capital Beltway Improvement Project, because emission rates from vehicles are predicted to decline substantially between the opening year (2010) and the design year (2030) due in part to improvements in tailpipe emissions and national vehicle emissions control programs. As shown in Figure E-1, the regional PM2.5 emissions are forecasted to decrease at a significant rate in future years. As shown in the figure, levels are much higher in 2010 than in 2020 and Since regional emission is a good indicator of the overall emissions trends in the regions, it is expected that 2010 would be the year of peak emissions from the project and other emissions sources that affect the project area despite increases in traffic in the design year. In addition, EPA finalized a series of national vehicle control programs expected to reduce vehicle emissions substantially. These programs include the Tier II vehicle and fuel sulfur standards for light-duty vehicles, the 2007 Highway Rule for heavy-duty diesel vehicles, and other related programs. 7 Based on this regional modeling data, it is estimated that a 56% reduction in PM2.5 direct emissions by 2010, from the 2002 baseline. 7 For more information on EPA s national vehicle control programs, refer to EPA s Office of Transportation and Air Quality program information available at E-10