Hydrologic Modeling of Cedar Creek Watershed using SWAT
|
|
|
- Stewart Parrish
- 5 years ago
- Views:
Transcription
1 North Central Texas Water Quality Project Hydrologic Modeling of Cedar Creek Watershed using SWAT Balaji Narasimhan, Raghavan Srinivasan, Steve Bernardz and Mark Ernst

2 Cedar Creek Reservoir Total Watershed Area 884 mi 2
3 North Central Texas Water Quality Project Input Data Sources DEM 30m (USGS) NHD Stream network (USGS) LandUse/LandCover (USGS) 1992 NLCD Urban Soil (NRCS) SSURGO (Hunt, Rockwall, Kaufman, and Van Zandt ) Map Information Assembly Display System (MIADS) (Henderson) Dams and Reservoirs (NRCS) NRCS flood prevention dams, farm ponds, and other privately owned dams About 120 dams/ponds Four > 1500 ac.ft Weather (Precipitation, Max. Temp, Min. Temp) (NOAA) NCDC ( ) NEXRAD ( , when NCDC data is missing) Weather Generator: Solar Radiation, relative humidity, wind speed

4 North Central Texas Water Quality Project Cedar Creek Watershed Landuse
5 Total Area: Sq. KM Water 5.54% Wetland 1.84% LandUse Cropland 6.17% Rangeland 1.07% Urban 6.39% Forest 15.48% Cedar Creek 27.74% Kings Creek 33.65% Pasture 63.52% All other creeks 38.60%
6 North Central Texas Water Quality Project Management Information Cropland Sorghum Conventional Tillage Fertilizer - 67 kg N and 34 kg P per hectare Pastureland In a given year only 50% receive fertilizer (67kg N) Two hay cuttings Fair hydrologic condition Urban Bermuda grass in pervious regions Lawn fertilization (Auto-fertilization - nitrogen stress level of 0.9) Fertilizer assumed: Data source: Personal communication, County Extension Agents


7 North Central Texas Water Quality Project Cedar Creek Watershed Soil Types

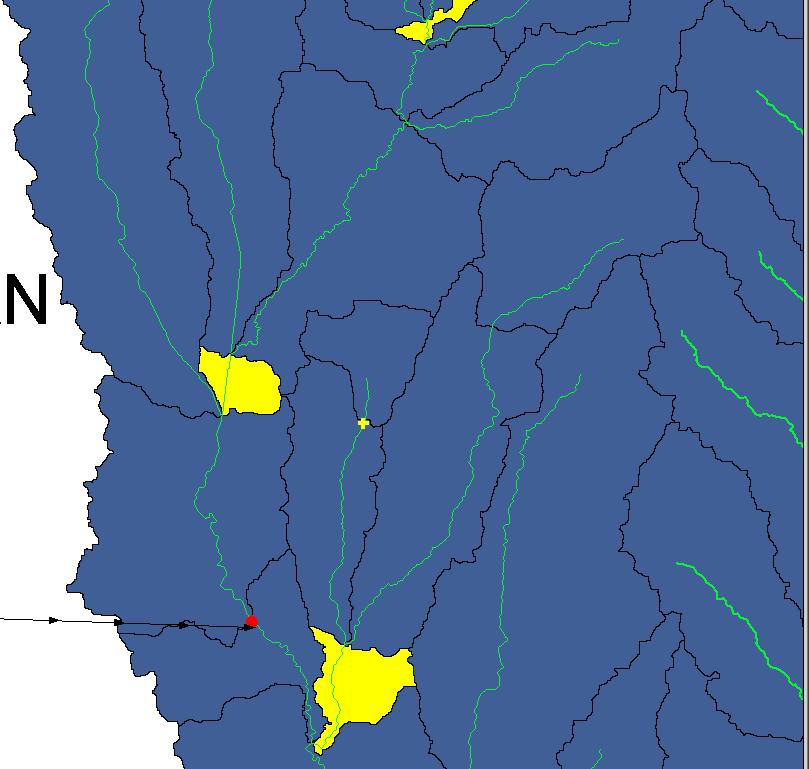
8 North Central Texas Water Quality Project Cedar Creek Watershed Water Resources 106 Subbasins 1516 HRU s 4 Reservoirs Major Creeks Big Brushy Kings Creek Cedar Creek Lacey Creek

9 North Central Texas Water Quality Project Cedar Creek Watershed 10 Weather Stations 9 rain gages 3 temperature gages

10 North Central Texas Water Quality Project Cedar Creek Watershed 10 Point Source Disarges Patel Terrell Willis Point Kaufman Kemp MaBank Eustace Athens East Cedar Creek Cherokee Shores
11 SWAT water routing A bucket type approa A = V ( 1000 L ) R = A P D = A z W + 2z btm 2 W 2z btm v = 1 n R 2 / 3 S 1/ 2 P = W + + btm 2 2D 1 z
12
13 Disadvantage with a bucket approa The current approa will artificially simulate higher velocity in those small segments and vice versa in large segments Travel time is uncertain Channel erosion will be significantly high in those small segments Natural decay of nutrients in-stream released from point sources during low flow
14 Modification Iterative Approa q = V ( )
15 North Central Texas Water Quality Project Flow Calibration and Validation
16 North Central Texas Water Quality Project
17 Variable Description Input Value Units File Coefficients related to flow CN2 SCS Runoff curve number (adjustment range) +3 to -3 - *.mgt ESCO Soil evaporation factor *.hru GW_REVAP groundwater re-evaporation coefficient *.gw GW_DELAY Groundwater delay time 135 Days *.gw GWQMN Groundwater storage required for return flow 1.00 mm *.gw REVAPMN Groundwater storage required for reevaporation mm *.gw ALPHA_BF Baseflow alpha factor to Days -1 *.gw CH_N2 Mannings "n" roughness for annel flow *.rte CH_K2 Hydraulic conductivity of annel alluvium 0.1 to 4.0 mm/hr *.rte

18 Cumulative Monthly Flow at USGS Stream Gage , Cedar Creek ( ) Measured Mean = 3.38 cms Predicted = 3.38 cms RMS Error = m 3 /s Year measured Predicted Calibration: Cedar creek Stream Flow at Predicted Flow y = x R 2 = COE = Series1 Linear (Series1) Measured Flow
19 Cumulative Monthly Flow at USGS Stream Gage , Kings Creek ( ) Measured Mean = 4.72 cms Predicted = 4.78 cms RMS Error = 3.21 Calibration: Kings Creek 800 m 3 /s Year MEASURED Predicted Stream Flow at Predicted Flow Measured Flow y = x R 2 = COE = Series1 Linear (Series1)

20 FLOW m 3 /s SUB 13-KC279 SUB 15 SUB 19 SUB 32-KC987 SUB 34-KC34 SUB 80-KC1388 SUB 45 SUB 52-KC4034 SUB 54 SUB 89-KC274 SWAT MEASURED SWAT: Low flow travel time is about 9.5 Days for about 52KM Dye study results: 10 days to 16 days Highly dependent on flow rate: 0.11 to 0.06 m 3 /s Data source: TRWD, Kings Creek Intensive Study, September 16, 2002
21 Cumulative Monthly Inflow to Cedar Creek Reservoir (NWS Stations - Enhanced with NEXRAD ) 6000 m 3 /s Measured Mean = cms Predicted = cms RMS Error = 11.7 Data source: TRWD, Reservoir Water balance Year Measured Predicted CC Resv Inflow Predicted Inflow 1.40E E E E E E E E Measured Inflow y = x R 2 = COE = Series1 Linear (Series1)
22 North Central Texas Water Quality Project Channel Erosion and Water Quality Modeling using SWAT Balaji Narasimhan, Peter M. Allen, Mark Ernst, John A. Dunbar, Steve Bernardz, Jeff Arnold, and Raghavan Srinivasan