LOWER INTERLAKE BASIN - HYDROLOGY
|
|
|
- Arron Clifton Gilmore
- 5 years ago
- Views:
Transcription
1 LOWER INTERLAKE BASIN - HYDROLOGY Disclaimer: The hydrologic conditions presented in this report are intended for watershed planning only and should not be used for licensing or design purposes. Utilization of this information on a specific case by case basis requires detailed analysis by trained professionals. 1. INTRODUCTION The Lower Interlake watershed is located north of the City of Winnipeg, between Lake Winnipeg and Lake Manitoba (see Figure 1.1). The whole watershed is within a relatively wet climate zone in Manitoba. The watershed has an area of 2279 km 2, of which 37.5% is agriculture, 14.8% is grassland, 22.1% is woodland, 21.5%, is water bodies, and 4.1% is unclassified. Most of eastern portion of the watershed is covered by sandy loam and its northwest portion is dominated by clay. The elevation of the watershed ranges from 212 m in its northeast to 283 in its northwest. This makes most of the watercourses in the watershed flow from northwest to east, ending in Netley Lake. Three towns are located in the watershed, with Selkirk at the east border, Stonewell at the west, and Teulon at the north. 1

2 Figure 1.1 Geographic location of the Lower Interlake watershed 2
3 2. CLIMATE Historic Climate We use meteorological factors like temperature, precipitation, sunshine, and wind to describe weather conditions at a specific location. Climate is then a description of a region s average long term weather patterns. Many methods are used to monitor meteorological factors. They include weather stations, weather radars, and meteorological satellites. Canada s first weather image from satellite TIROS-1 was launched in The satellite pictures most often displayed on television and in the newspapers are taken by geostationary orbiters known as Geostationary Operational Environmental Satellites (GOES). Today's images are commonly from GOES-8 and GOES-10 and. At 35,800 kilometers (22,300 miles) above the equator, such satellites will make one revolution in 24 hours. Although weather satellites play a key role in weather forecasting, we still need information from ground-based weather stations to understand local weather conditions. Since satellites cover vast areas, the collected data is too coarse for local needs. To complement satellite data, the Meteorological Service of Canada (MSC) maintains 110 weather stations across the Province of Manitoba, monitoring meteorological factors like temperature, precipitation, and snow depth. The MSC operates three weather stations around the 2300 km 2 watershed, namely Grosse isle, stony Mountain, and Selkirk (see figure 2.1). 3

4 Figure 2.1 Weather stations in Southern Manitoba and the Lower Interlake watershed Spatial variability exists for all the meteorological factors within a watershed, especially when the terrain of the watershed varies greatly. Though the Lower Interlake watershed is 4
5 quite flat, the meteorological factors still vary across the watershed. Figure 2.2 shows the daily temperature averages for each month in the period at Stony Mountain and Selkirk. We can see that the values in each month are very close; however, significant differences exist in average (normal) total rainfall for each month between these two stations (see Figure 2.3). This is partly due to the storm movement across the watershed. 25 COMPARISON OF DAILY AVERAGE TEMPERATURE IN MONTH Between Stony Mountain and Selkirk 20 Stony Mountain Selkirk Temperature ( C) Jan Feb Mar Apr May Jun Jul Aug Sep Oct Nov Dec Month Figure 2.2 Comparison of daily temperature between Stony Mountain and Selkirk 5
6 100 COMPARISON OF AVERAGE MONTHLY RAINFALL Between Stony Mountain and Selkirk 90 Stony Mountain Selkirk Rainfall (mm) Jan Feb Mar Apr May Jun Jul Aug Sep Oct Nov Dec Month Figure 2.2 Comparison of average monthly rainfall between Stony Mountain and Selkirk Temporal variations also exist for a particular meteorological factor from a specific weather station over the period of records. Figure 2.4 shows the daily temperature values ( ) from the station at Stony Mountain. We can see the values in different months are quite different. In winter we have a very low temperature (22 ºC below zero) and in summer the temperature can be as high as 25 ºC. 6
7 30 DAILY TEMPERATURE IN MONTH AT STONY MOUNTAIN 20 Daily Average Daily Maximum Daily Minimum 10 Temperature ( C) Jan Feb Mar Apr May Jun Jul Aug Sep Oct Nov Dec Month Figure 2.4 Daily temperature at Stony Mountain Figure 2.5 presents the temporal variation of precipitation (rain and snow). We have deep snow fall in winter and high rainfall during summer. It should be noted that we use the concept of Snow Water Equivalent (SWE) to represent an equivalent depth of rainfall for unit snowfall. Usually, 10 mm of snowfall is equal to 1 mm of rainfall. The figure shows that, in a month, the maximum snowfall depth (SWE) is 225 mm and the maximum rainfall can reach 90 mm. However, a changing climate can significantly shift the climate pattern both spatially and temporally. 7
8 250 AVERAGE MONTHLY PRECIPITATION AT STONY MOUNTAIN Rainfall Snowfall 200 Precipitation (mm) Jan Feb Mar Apr May Jun Jul Aug Sep Oct Nov Dec Month Figure 2.5 Average monthly rainfall and snow depth at Stony Mountain Climate Change Climate change is a shift in long-term average weather patterns, which can include changes in temperature and in precipitation amounts. The United Nations Framework Convention on Climate Change defines climate change as: a change of climate which is attributed directly or indirectly to human activity that alters the composition of the global atmosphere and which is in addition to natural climate variability observed over comparable time periods. In other words, the FCCC uses the term Climate Change to mean only those changes that are brought about by human activities. These activities emit greenhouse gases that trap heat in the atmosphere. Greenhouse Gases are a number of minor gases in the atmosphere, although relatively transparent to sunlight, they absorb most of the infrared heat energy transmitted by the Earth towards space. This phenomenon has been called the greenhouse effect and the absorbing gases that cause it are called greenhouse gases, as shown in Figure 2.1. Important greenhouse gases include: water vapor, carbon dioxide, methane, nitrous oxide, ozone, and halocarbons. 8
, due largely to the burning of fossil fuels for transportation and industrial processes.")
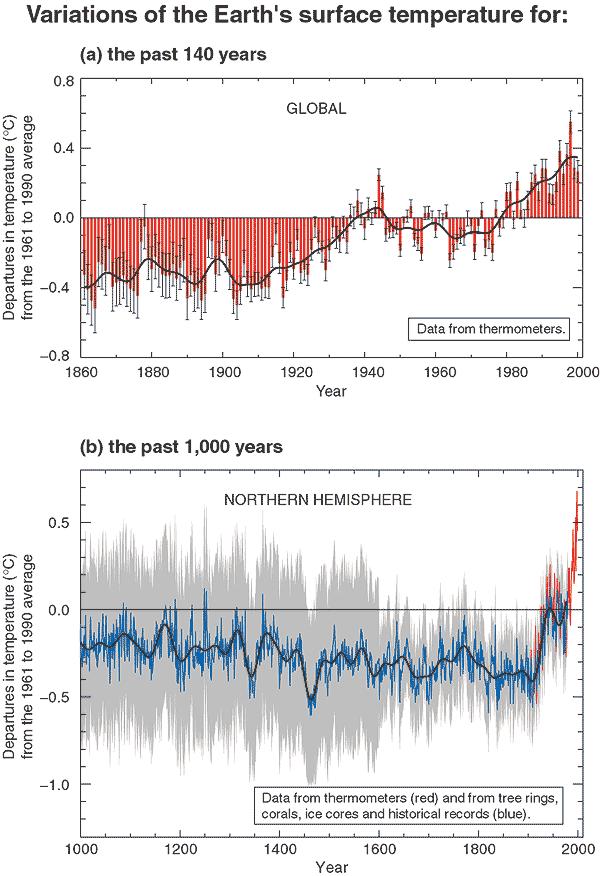
9 Figure 2.1 Greenhouse effect in the atmosphere Enormous scientific evidence shows significant increases of greenhouse gas concentrations in the atmosphere since industrialization (see Figure 2.2), due largely to the burning of fossil fuels for transportation and industrial processes. Such an increase of greenhouse gas concentrations in the atmosphere has led to a significant change in global climate in recent years, particularly in the polar areas. An analysis of temperature records shows that the Earth has warmed an average of 0.6 C on a global scale over the past 140 years. Figure 2.3 illustrates this change in two charts, one for the last 140 years and the other for the last 1000 years. There appears to have been a warming until the early 1940s then a moderate cooling occurred until the mid 1970s, followed by a renewed and pronounced warming continuing through to the present. Ice core and other proxy data indicate that the 1980s and 1990s were the warmest decades of the past millennium. The warming is real and significant though its intensity has varied from decade to decade and from region to region as well as from season to season. 9

10 Figure 2.2 CO2 concentration over the past 1000 years (Source: Environment Canada) 10
11 11
12 Figure 2.3 Relative to average (normal) temperature Canada's climate is changing too: temperatures are rising, particularly in the Arctic, where permafrost is thawing and the ocean's ice cover is shrinking. Even greater changes are expected in the future, including a continued rise in temperatures, shifts in rainfall patterns, and increases in certain types of hazardous weather, such as heavy spring rains and heat waves. As a cold northern country, Canada will be one of the most greatly affected countries in the world. These changes could alter hydrological regimes in Manitoba, leading to less of a snow pack, an earlier ice break-up and a change in streamflow across the Province, which could affect water resources management activities in the Lower Interlake watershed. Aquatic ecosystems in rivers, lakes and streams are expected to be impacted by changes in river and stream runoff due to climate change. Recent studies show that there has been an increase of algae outbreaks in Lake Winnipeg over the past decade, which is in part related to land use in the Lower Interlake watershed and possible change of climate. A changing climate could also exacerbate the risks of extreme hydrological events such as droughts and floods in the watershed which in turn may trigger enormous social and economic suffering. 3. HYDROLOGY The rivers, lakes, and streams within the Lower Interlake watershed deliver freshwater to domestic, agricultural, and industrial use across the watershed, provide habitats for aquatic creatures, and are of great value to the landscape and its residents. Historical flow information of the water bodies plays a key role in the management of water resources, design of water infrastructures, planning of land use and urban development, protection of ecosystems, and dealing with critical issues like climate change. It thus is of great importance to monitor flows and water levels, assess water availability, and balance supply and demand of water for the watershed. 12
13 Hydrometric Stations The collection of hydrometric data is very important to the understanding of the availability, variability and distribution of water resources. It provides the basis for responsible decision making on the management of water resources. Environment Canada and the Province of Manitoba operate water level and streamflow gauging stations throughout the province. Water level and streamflow data collected under the Canada-Manitoba Hydrometric Agreement, which is part of a National Hydrometric Program, supports activities such as policy development, operation of water control works, flow forecasting, water rights licensing, water management investigations and hydrologic studies, ecosystem protection and scientific studies. Environment Canada and the Province of Manitoba and Manitoba Hydro operate 143 discharge and 133 water-level gauging stations under this Agreement. Streamflow and water level data has been collected at 31 hydrometric gauging stations within the Lower Interlake watershed, of which 8 are still active (see Figure 3.1). 13
14 Figure 3.1 Hydrometric stations within the lower Interlake watershed 14
15 Runoff and Streamflow Runoff is that part of the precipitation, as well as any other flow contribution, which appears in surface streams of either perennial (lasting or continuing throughout the entire year) or intermittent (recurrent) form. This is the flow collected from a drainage basin or watershed, and it appears at an outlet of the basin. Specifically, it is the virgin flow, which is the streamflow unaffected by artificial diversions, storages, or other works of man in or on the stream channels, or in the drainage basin or watershed. Many of the hydrometric stations within the Province measure streamflow instead of total runoff since the flows in channels and lakes are affected by human activities. According to the source from which the flow is derived, runoff may consist of surface runoff, subsurface runoff, and groundwater runoff. The surface runoff is that part of the runoff which travels over the ground surface and through channels to reach the basin outlet. The subsurface runoff, also known as subsurface flow, interflow, or storm seepage, is the runoff due to that part of the precipitation which infiltrates the surface soil and moves laterally through the upper soil horizon toward the streams as shallow groundwater above the main groundwater level. The groundwater runoff is that part of the precipitation which has passed into the ground and by deep percolation this infiltrated water has reached the main groundwater level. This groundwater typically provides a base flow by discharging water into the stream channel. Factors that affect runoff and subsequently streamflow include climate factors such as rain, snow, intensity, duration, and storm movement, physiographic factors such as geometric factors (size, shape, and elevation), physical factors (land use and cover, soil type, and geological conditions), and channel characteristics (size and shape of cross section, slope, and roughness,). Therefore, significant spatial variations always exist in runoff and streamflow within a watershed. Different locations in a watershed have different runoff and streamflow. Figure 3.2 shows the daily discharges at stations 05OJ017 and 05OJ008 within the Lower Interlake watershed, graphically illustrating the difference of daily streamflow for these two locations. The difference is partly due to 15
16 different drainage areas contributing to these two gauging stations. The drainage area controlled by station 05OJ017 is 462 km 2 and for station 05OJ008 it is 641 km 2. Figure 3.2 Daily discharges at stations 05OJ017 and 05OJ008 Streamflow in the Lower Interlake watershed also shows big temporal variations. In most years, the majority of runoff in the watershed occurs in the spring, specifically in April. At this time of year, precipitation which has fallen as snow and accumulated through the winter melts and runs off into the drains and rivers. The ground is often either frozen, or is already saturated from melt water, so most rainfall flows as runoff to the rivers and lakes instead of into the ground. Both streamflow and water level change vary depending on the time interval. Figure 3.3 demonstrates this variability for daily, seasonal, and annual changes of measured streamflow at gauging station 05OJ017. The figure indicates that the maximum daily discharge is 55 m 3 /s (cms) and the minimum value is near zero. Figure 3.4 shows similar changes in measured water level at that station. They show that the daily values have the highest temporal variation and the annual average ones have the lowest. This is because 16

17 the annual and seasonal average values are calculated by taking averages of the daily values with smoothing the daily hydrographs. Figure 3.3 Discharges at station 05OJ017 17
18 Figure 3.4 Water levels at station 05OJ017 Agricultural Drainage Network The agricultural drainage network is designed to remove excess rainfall and snowmelt runoff from cropland during the growing season to improve the productive capability of the soil along with other technical, economic, and environmental considerations. The lack of resources dedicated to the maintenance and reconstruction of existing drainage works has long been an issue throughout agricultural areas. Required drainage system capacity has been increasing due to an increase in the amount of land used for crop production, greater planting levels in specific crops, improved on-farm infrastructure and urban development into agricultural areas. A general increase in farm size and landowners abilities to alter runoff has also aggravated the situation. Drains in the province are classified in terms of order, with1 st order being the smallest and 7 th order being the largest. Drains in this watershed range in size from 1 st order to 5 th order. Municipalities, towns and villages typically maintain 1 st and 2 nd order drains, whereas the Province of Manitoba typically construct and maintain 3 rd order and larger 18
19 drains. All property in, and all rights to the use, diversion or control of all water in the province is vested in the Crown in right of Manitoba. Therefore, all drainage works (other than those owned by the Province) in the province are subject to the jurisdiction of the Water Rights Act. Figure 3.5 shows the drainage network within the Lower Interlake watershed. Most of the drains follow natural rivers, creeks, and other watercourses. 19

20 Figure 3.5 Designated drains within the Lower Interlake watershed 20
21 4. WATER RESOURCES Generally, three basic elements need to be understood before any water resource planning and management is formulated. They are water supply, water demand, and the way to balance supply and demand. The plan often needs to determine the source, extent, and dependability of water supplies and the character of water on which an evaluation of control and utilization is to be based. It also needs to understand the time, volume, and pumping rate of water demand and the characteristics of a water user. Furthermore, the gaps between supply and demand need to be mitigated whether by the construction of water control facilities or optimal operation. Water Availability The hydrological appraisal of water resources is the basic requirement for planning, designing, constructing, and operating water resources projects. The collected hydrometeorological information and data are basic factors for the appraisal of water availability within a watershed or river basin. An important concept to describe water availability within a watershed is the water volume yield per area of watershed land surface. Acre-feet per square mile is a popular water volume unit used in water resource appraisal. There are many small creeks and streams in the Lower Interlake watershed, and water availability varies from one area to another for each of these smaller watershed units. Grassmere Creek Drain may be used as an example to demonstrate water availability in a sub-watershed where one of these creeks is located. Gauging station 05OJ017 (see Figure 3.1) is located at the downstream end of the Grassmere Creek Drain. Figure 4.1 presents the annual water volume per square kilometer of land for the Grassmere Creek Drain over the period of hydrological records. It shows great temporal variations in total water availability over the past decades, with some years (e.g., 1996 and 2005) having very high values and others (1981 and 1984) having very low values. This often leads to difficulties in water resources planning. 21
22 ANNUAL UNIT WATER VOLUME FOR GRASSMERE CREEK DRAIN ( ) Unit Water Volume (ac-ft/km^2) Year Figure 4.1 Annual water volume per land for the Grassmere Creek Drain Figure 4.2 shows the monthly water volume per land area for the Drain. Each value in the figure is an average of all values over the entire period of record for the same month. As can be seen, huge variability exists in monthly water supply. The highest water availability occurs in April when most of the winter accumulated snow pack melts; the lowest water availability often happens in winter when the rivers or lakes are frozen. 22
23 MONTHLY UNIT WATER VOLUME FOR GRASSMERE CREEK DRAIN ( ) Unit Water Volume (ac-ft/km^2) MAR APR MAY JUN JUL AUG SEP OCT NOV Year Figure 4.2 Monthly water volume per land for the Grassmere Creek Drain over the period of record Water Demand There are many water users in the Lower Interlake watershed. Farmers need water to irrigate their crops; residents in cities and towns need water for cooking, bathing, toilet flushing, and lawn and garden watering; industrial users need water for manufacturing or food processing; and the aquatic creatures need water for survival. In a wet season total water supply usually can satisfy all demands, while they compete for limited water resources in dry seasons. For certain human water uses, all water users should get permission (water license) from the Province of Manitoba before they can extract water from water bodies. The issuance of a Water Rights Licence requires the determination of the availability of water for human use and the determination of instream flow needs (an estimate of a threshold flow above which a user may pump water from a stream) for environmental and 23
24 ecological purposes. The hydrologist in the are responsible for the calculation of how much water is available for licensing in each river, creek, or stream in the province. Though we have abundant water resources in the Province of Manitoba, we still need to work hard to increase the efficiency of water consumption. This is because in some parts of the province the over extraction of water for human-use purposes is reaching allowable limits and deteriorating water quality and threatening the survival of aquatic creatures in dry seasons are becoming concerns. Another big risk to water supply is from climate change which could reduce the total available water dramatically by early melting of the snow pack and shifting weather patterns. Water Control Infrastructure In Figure 4.2, it can be seen that in summer total available water is low; however water demands are usually high during summer because of irrigation and domestic water uses. Therefore, water control structures, such as reservoirs or water tanks, are constructed to store water in wet seasons for use in dry seasons. A really big reservoir can store water in a wet year for use in a dry year while a small reservoir can only reserve water in a wet month to the coming dry months. However, man-made water control facilities can result in some environmental problems. For example, a dam can block fish from going upstream and a big reservoir can flood vast areas of land. The Oak Hammock Marsh Dam (see Figure 3.1) is located in the middle of the Lower Interlake watershed. The Lake can store excess runoff and release water when necessary (see Figure 4.3). 24

25 Figure 4.3 The Oak Hammock Marsh Dam Flooding is a serious concern to many residents of Manitoba. Although the public is probably more aware of flooding in the Red River Valley, flooding also occurs along numerous other rivers, streams and lakes. In an attempt to reduce flood damages, Canada 25
26 and Manitoba signed a General Agreement Respecting Flood Damage Reduction on December 20, Damages and hardships resulting from flooding usually result in large costs to the public. Controlling the use of areas prone to flooding is one effective way of reducing these damages, as are certain structural works such as dikes or diversions. Under the terms of the General Agreement, Canada and Manitoba agreed to discourage any new development from occurring in any designated floodway area. Within a floodway area, the two governments agreed not to finance or engage in any further projects. Both governments also agreed to withhold flood assistance payments for flood damages to any structures constructed within a floodway area, after its official designation. At the same time, they agreed to encourage suitable land use, such as recreational and agricultural uses, and appropriate zoning aimed at restricting development in those areas. Conversion Units: Temperature: C = 5/9 ( F-32) Length: 1 mm = inches, 1 inch = 25.4 mm Area: 1 km 2 = square miles Volume: 1 dam 3 (one cubic decameter) = 1000 cubic metres = acre-ft = 1 mm over 1 km 2 1 acre-foot = 43,560 cubic feet = 1233 cubic metres = 1 ft over 1 acre Flow: 1 m 3 /s = ft 3 /s 26