Assessment of Heavy Metals in Respirable Suspended Particulate Matter at Residential Colonies of Gajuwaka Industrial Hub in Visakhapatnam
|
|
|
- Evelyn Price
- 5 years ago
- Views:
Transcription
1 International Journal of Geology, Agriculture and Environmental Sciences Volume 3 Issue 5 October 2015 Website: ISSN: Assessment of Heavy Metals in Respirable Suspended Particulate Matter at Residential Colonies of Gajuwaka Industrial Hub in Visakhapatnam Srinivasa Rao S. 1, N.S. Rajamani 1 and E.U.B. Reddi 2 1-Research Scholar, 2-Senior Professor. Department of Environmental Sciences, Andhra University, Visakhapatnam, Andhra Pradesh, India. Abstract: Concerning air pollution, the elemental characterization of airborne particles has been recognized as a significant air quality parameter due to their impact on the environment and human health. Hence, concentrations of ten trace elements were analyzed in 96 RSPM samples collected in winter and summer seasons, to know the status and seasonal variations of metals concentration at the study area. The measured data revealed that all most all the elements were within the prescribed standards specified by standard organizations and it was observed that little variations were observed from changing seasonal conditions and metals concentrations were continuing to raise slowly within the study area. The data revealed that the average percentage of measured total heavy metal loadings in the mean values of respirable particulate matter of the entire study area was accounted for 4.7%. Data obtained were statistically analyzed by correlation coefficients, principal component analysis and cluster analysis methods to ascertain the relation and possible contributing factors towards the metal concentrations. Keywords: Heavy metals, Particulate matter, Multivariate analysis, Industrial sources. 1. Introduction Among all the criteria air pollutants, particulate matter (Suspended Particulate Matter - SPM and Respirable Suspended Particulate Matter - RSPM) has emerged as the most critical pollutant in almost all the cities. The harmful effects of heavy metals in respirable dust have been well established [1]. Coarser fraction (> PM10) of SPM concentrations is primarily irritants and may not have much relevance to direct health consequences as compared to the effects of its respirable fractions (PM10 and PM2.5), which can penetrate the human respiratory systems deeper [2]. Hence, villages and colonies of Gajuwaka industrial hub which is located on the south of Visakhapatnam city was chosen for the present study in order to address the extent of the presence of trace metals prevailing in the respirable suspended particulate matter. Multivariate analysis techniques like Principal Component Analysis (PCA) and Cluster Analysis (CA) have been widely used to identify the possible sources of pollutants in particulate matter [3]. Since, air quality in the study area was affected by a variety of complex source mix, the objectives of the present study were defined so as to have a better understanding of the trace metals contribution to air pollution by application of principal component analysis and cluster analysis. 2. METHODOLOGY The respirable suspended particulate matter samples collected at eight sampling locations of the study area during winter and summer seasons of , were used for the estimation of concentration levels of ten trace metals such as Iron (Fe), Lead (Pb), Zinc (Zn), Copper (Cu), Manganese (Mn), Chromium total (Cr), Nickel (Ni), Cobalt (Co), Cadmium (Cd) and Arsenic (As). The collected RSPM samples were acid digested by microwave digester by adopting the methods for the Determination of Inorganic Compounds in Ambient Air [4]. The filtered acid solution was analyzed for the trace metals using an atomic absorption spectrometer (for As by hydride generator) by following the Intersociety Committee methods to ensure data quality and consistency [5]. In this study, principal component analysis was used to ascertain the possible contributing factors towards the metal concentrations and thereby determine which metals have a common origin. By extracting the Eigen values from the correlation matrix, the number of significant factors and the percent of variance explained by each of them were calculated. Varimax rotation was adopted to maximize the variances of the factor loadings. Cluster analysis was performed to differentiate the components of various sources and to classify them into several categories. In this study, cluster analysis was carried out with the Ward s method and the distance method was with correlation coefficient and figured as a dendrogram. 3. Results and Discussion 3.1 Level of trace metals in the RSPM at the study area Location-wise annual mean of heavy metal and RSPM concentrations along with their standard deviations were given in Table-1 and 1a. Data showed that Fe, Zn and Pb were occupied in first three places respectively in all the sampling locations reflected the sources as anthropogenic. The most common sources of all these three heavy metals are emissions from vehicular, industrial and construction (geological) related activities. Hence, the sources of these metals in the study area could not be identified conclusively. The concentrations of Pb, WOAR Journals Page 56
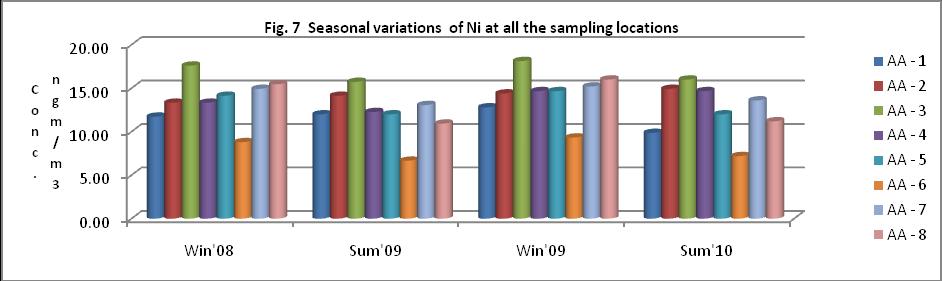
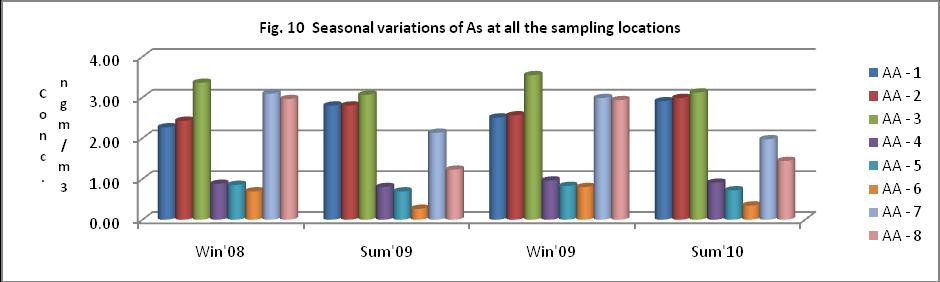
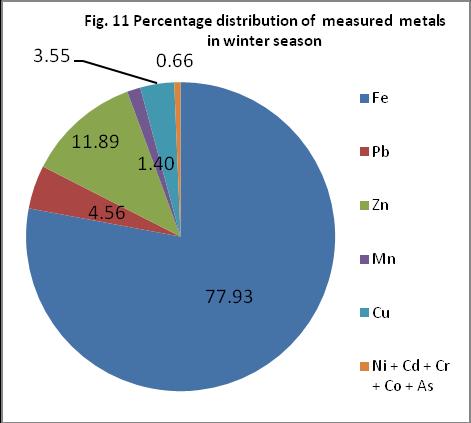
2 Ni and As in particulates and RSPM at almost all the sampling locations were within the norms specified by the Central Pollution Control Board. However, some metals still do not have any established air quality standards. In these cases, international standards [6], [1] were adopted as reference and found the metals Cd, Zn and Mn well within the prescribed limits. From the data it can be seen that the sampling location AA-3 was highly loaded with heavy metal particulate as this location was close to industries and heavy traffic area compared to other locations. Particularly, the Zn level at this sampling location was high compared to other locations and it can be attributed to the Zinc smelter which is very nearer to this location. Similar observations were reported in earlier studies of trace metal analysis at Visakhapatnam [7], [8]. The sampling location AA-6 was pollution free compared to the rest of the stations. The data revealed that the average percentage of measured total heavy metal loadings in the mean values of respirable particulate matter of the entire study area was accounted for 4.7%. Table 1: Location-wise annual mean of heavy metals and RSPM concentrations in the study area Units: Elements ngm/m 3, RSPM - µgm/m 3 Sampling AA - 1 AA - 2 AA - 3 AA - 4 lo catio n / Norm Element Mean Std. Dev. Mean Std. Dev. Mean Std. Dev. Mean Std. Dev. Fe Pb 1000 # Zn ** Mn 150 * Cu Cd 5 * Ni 20 # Cr Co As 6 # RSPM 100 # Table 1a: Location-wise annual mean of heavy metals and RSPM concentrations in the study area Units: Elements ngm/m 3, RSPM - µgm/m 3 Norm AA - 5 AA - 6 AA - 7 AA - 8 Mean Std. Dev. Mean Std. Dev. Mean Std. Dev. Mean Std. Dev. Fe Pb 1000 # Zn ** Mn 150 * Cu Cd 5 * Ni 20 # Cr Co As 6 # RSPM 100 # Sampling lo catio n / Element Note: # Central Pollution Control Board, New Delhi, * European Environmental Agency, ** World Health Organization, Geneva. 3.2 Seasonal variations of trace metals at the sampling locations The seasonal variations in average concentrations of heavy metals in respirable particulates at each sampling location were given in Fig.1 to Fig. 10. It was observed that little variations were observed from changing seasonal conditions for metals. But the significant variations were observed at upwind and downwind locations of industrial point sources in both the seasons as the direction of the wind in the study area is almost in opposite directions. Hence, the change in wind direction, cold and stable conditions were favored for higher concentrations in winter season at sampling locations AA-6, AA-7 and AA-8. The turbulent conditions with a change in wind direction aggravated the metal concentrations in summer season at the rest of the sampling locations. Irrespective of the seasons the impact of automobile and construction activities (continuous) could also be responsible for the buildup of the metals concentrations significantly at all the sampling locations which were resulted the little seasonal variations. Effect of mixed pollutant sources were clearly seen at all the sampling locations. The highest concentrations of metals were observed (Fig.1 to 10) in summer seasons at sampling locations AA-1 to AA-5. This might be due to the increased erosion of ground soil in summer. In winter seasons, sampling locations AA-6, AA-7 and AA-8 were showing higher values compared to summer seasons. AA-6 is a thickly vegetated colony which showed lower values of all the metals in particulates during entire study period. Measured heavy metals concentrations in particulates showed almost the same trend in both the seasons (Fe>Zn>Pb>Cu>Mn>Ni>Cr>As>Cd>Co) revealed that the study area was exposed with fixed and uninterrupted sources of the pollutants. The percentage distribution of total heavy metals (based on the ten measured metals) for both the seasons were shown Fig. 11 and 12. The data revealed that % of Fe and Mn has increased in summer season where as Zn, Pb, Cu and Ni showed relatively higher percentage in winter than in summer. This high percentage of Zn, Pb, Cu and Ni in the winter season can be attributed to local vehicular emissions and the high percentage of Fe and Mn in summer season can be attributed to the windblown soil borne particles. And there was no seasonal change in the percentage of Cd, Cr, Co and As metals. WOAR Journals Page 57


3 International Journal of Geology, Agriculture and Environmental Sciences Volume 3 Issue 5 October 2015 Website: ISSN: WOAR Journals Page 58


4 WOAR Journals Page 59


5 WOAR Journals Page 60
6 It was observed that the measured metals concentrations have continued to raise slowly within the study area at all the sampling locations (Fig. 13). The raise of metals can be attributed to the emissions released from the vehicular and construction activities at the study area because of exponential increase of these activities were observed during this period. The data indicated that overall heavy metal loading was higher in summer than in winter. The average percentage of increase in summer to summer season was 2.8 and that of winter to winter season was 1.5 only. The increase of metal loading was contributed by Fe and Mn in summer season whereas Zn, Pb and Cu were responsible in winter season (Fig. 11 and Fig.12). 3.3 Multivariate analysis Correlation among the measured heavy metals: In order to establish the inter-elemental relationships of the particulates, Pearsons s correlation coefficients were calculated for each metal against the other metals and were shown in Table-2. From the results, significant (P <0.01) positive correlations were found between the metal pairs of Cu-As (0.936), Cu-Cd (0.799), Pb-Cu (0.791), Pb-Fe (0.789), Cd-As (0.777), Pb-As (0.773), Pb-Ni (0.763), Fe-Cr (0.725), Cu-Ni (0.724). Mn and Co metals were not significantly correlated with other metals. Metals, which were strongly correlated, indicate possible of similar originating sources that can be associated with traffic, industrial sources and road dust. Table 2: Pearson s correlation matrix for the metal concentrations (N=96) Metal Fe Pb Zn Mn Cu Cd Ni Cr Co As Fe 1 Pb Zn Mn Cu Cd Ni Cr Co As Principal component analysis: The extracted Eigen values with the number of principal components and the percent of variance were shown in Table-3. The results showed that only three principal components which were extracted with the Eigen values >0.8 accounting for 85.1% of the total variance were calculated by means of Varimax rotation. The three factor loadings with the percentage of variance for unrotated and Varimax rotated were listed in Table-4 & 5 respectively. Table 3: Eigen analysis of the correlation matrix WOAR Journals Page 61
7 Eigenvalue Proportion Cumulative Principal components Variable PC1 PC2 PC3 PC4 PC5 PC6 PC7 PC8 PC9 PC10 Fe Pb Zn Mn Cu Cd Ni Cr Co As Table 4: Unrotated factor loadings Factor Analysis: Fe, Pb, Zn, Mn, Cu, Cd, Ni, Cr, Co, As Principal Component Factor Analysis of the Correlation Matrix Unrotated Factor Loadings and Communalities Variable Factor1 Factor2 Factor3 Communality Fe Pb Zn Mn Cu Cd Ni Cr Co As Variance % Var Table 5: Rotated factor loadings Rotated Factor Loadings and Communalities Varimax Rotation Variable Factor1 Factor2 Factor3 Communality Fe Pb Zn Mn Cu Cd Ni Cr Co As Variance % Var The first factor, which accounted for 53.9% of the total variance, had high loadings on the elements Cd, As, Cu, Pb, Cr, Fe, Ni, Co and Zn. Cu and Pb, Pb and Ni, Cu and Ni were significantly correlated, as can be shown from their correlation coefficient (Table-2), and may originate mainly from industry and traffic sources, implying that these metal WOAR Journals Page 62
8 Distance Second Factor pollutants should be from different sources. Therefore, factor -1 can be classified as heavy metals from strong anthropogenic sources which is also evident from the presence of various industries in the study area. The second factor explains about 17.9% of the total variance, with Mn, Fe, Cr, Pb and Ni providing the highest loadings. This factor s high loadings on the elements Mn and Fe suggest the influence of natural sources. Further, the third factor was dominated by the metal Cd, which is mainly of industrial sources. The first factor represents the contribution of metals from local anthropogenic sources and the second factor represents the contribution of metals from lithogenic and anthropogenic sources. This can be further explained by the loading plot shown in Fig Mn Loading Plot of Fe,..., As 0.8 Fe Cr 0.6 Pb 0.4 Ni Zn Cd Cu As -0.2 Co First Factor Figure 14: Loading plot for first two components Cluster analysis: The results of cluster analysis were shown in Fig. 15. From the dendrogram, it can be observed that four clusters were identified: (1) Fe, Pb and Cr (2) Mn (3) Zn, Ni and Co (4) Cu, As and Cd. The degree of correlation between these metals can be reflected by the distances in between them. Based on PCA and CA, four groups were identified corresponding to the probable sources of heavy metal pollutants. (1) Fe, Pb and Cr (2) Mn (3) Zn, Ni and Co (4) Cu, As and Cd. Group 1: Fe, Pb and Cr. Fe metal pollutant has the highest mean concentration compared with those of other metals. It might be likely from the suspended soil, road and construction related dust and/or local industries emitting Fe. These metal pollutants might be from industrial activities even though traffic emissions might be the major pollution sources for Pb, while Cr might originate mainly from mixed sources of vehicular and industrial activities. The source of Fe could not be identified conclusively. Dendrogram with Ward Linkage and Correlation Coefficient Distance Fe Pb Cr Mn Zn Ni Variables Co Cu As Cd Figure 15: Dendrogram for 10 metals obtained by Ward s hierarchical clustering method WOAR Journals Page 63
9 Group 2: Mn. CA results indicated that this pollutant is obviously different from the others, which may suggest that it was from lithologic source. And PCA results indicated no significant correlation between Mn and other heavy metal pollutants, while clusters 1, 2 and 3 join together at a relatively higher level by CA, indicating that Mn has a common source with groups 1 and 3. Group 3: Zn, Ni and Co. These pollutants might be from mixed sources. Ni and Co are mainly from oil combustion, while Zn might be from abrasion of vehicles because this heavy metal is a part of the materials for brass alloy. Therefore, traffic emissions might be the major pollution sources for these metals. Group 4: Cu, As and Cd. These metals were from the byproducts of industrial processes. Traffic and industrial activities can also produce Cd. [8] Sankara Rao, Bh., D.G.S. Narayana and D.L. Sastry Quantitative Analysis of Trace Elements in Aerosols of Visakhpatnam. Indian Journal of Environmental Protection. 5. (3) Author Profile S. SRINIVASA RAO, Research scholar, Department of Environmental Sciences, Andhra University, Visakhapatnam, Andhra Pradesh, India. Mobile No: ( srisampara@gamil.com ). N. SRINIVASA RAJAMANI, Research scholar, Department of Environmental Sciences, Andhra University, Visakhapatnam, Andhra Pradesh, India. Mobile No: ( rajamani74ns@gamil.com ). Prof. E.U.B. REDDI, Senior Professor, Department of Environmental Sciences, Andhra University, Visakhapatnam, Andhra Pradesh, India. Mobile No: ( ubreddie@gamil.com ). The results of the statistical analysis and data treatment of the metal pollutants suggested that industrial activities and vehicular emissions represent the most important pollutant sources in the study area. 4. Conclusion In this study, the measured heavy metals in particulate matter at the residential colonies were almost all within the specified limits. But the sources of these pollutants cannot be identified conclusively due to multiplicity of sources and all these pollutants are common sources of emissions from vehicular, industrial and construction (geological) related activities. More attention should be paid to control the increase of vehicles as vehicle exhaust is an important particulate contributor to ambient air in this area. References [1] WHO, World Health Organization. Review of health hazards from heavy metals. Genewa. [2] CPCB, Air quality monitoring, emission inventory and source apportionment study for Indian cities. National Summary Report. Central Pollution Control Board, New Delhi. [3] Viana, M., Querol, X., Alasstuey, A., Gil, J. I., and Menendez, M Identification of PM sources by principal component analysis (PCA) coupled with wind direction data. Chemosphere [4] USEPA, Compendium of Methods for the determination of Inorganic Compounds in Ambient Air. Compendium Method IO-3.2. EPA/625/r- 96/010A. U S Environment Protection Agency. [5] James P. Lodge. Jr. Editor Methods of air sampling and analysis. 3 rd edition. Intersociety Committee. Lewis Publishers. New York. [6] EEA, guidelines. [7] Ravi Kumar, M., G.J. Naga Raju, P. Sarita, S. Bhuloka and B. Seetharami Reddy Trace elemental analysis of aerosol samples using the particle-induced X-ray emission technique. Indian Journal of Environmental Protection. 30 (7): WOAR Journals Page 64