Department of Environmental Conservation. Fiscal Year 2015 Performance Outcomes and Measures
|
|
|
- Shannon Burns
- 5 years ago
- Views:
Transcription
1 Department of Environmental Conservation Fiscal Year 2015 Performance Outcomes and Measures

2 Department of Environmental Conservation Fiscal Year 2015 Performance Outcomes and Measures
3 Department of Environmental Conservation Legal Administration and Innovation Compliance and Enforcement Environmental Assistance Office Laboratory 15 FTEs 12 FTEs 12 FTEs 6 FTEs Deputy Commissioner Commissioner 6 FTEs Air Quality and Climate Waste Management and Prevention Facilities Engineering 27 FTEs 47 FTEs 18 FTEs Watershed Management Drinking Water and Groundwater Protection Vermont Geological Survey 86 FTEs 59 FTEs 3 FTEs Total (FY14) Full Time Equivalent (FTEs) Employees: 291
4 VT Department of Environmental Conservation FY14 Budget Appropriated* by Major Funding Source $5,733,499 (12%) $9,350,054 (19.5%) $10,251,824 (21.5%) General Funds Special Funds Federal Funds Interdepartmental $22,557,487 (47%) *After Section B.1202 of Act 50 Management Savings Initiative
5 VT Department of Environmental Conservation FY2014 Budget "As Passed" By Major Expenditure Object Code $4,174,720 (9%) $14,233,501 (30%) $25,216,387 (52%) Personal Services Contracts Operating Grants $4,349,377 (9%)
6 VT Department of Environmental Conservation FY2015 Budget "Proposed" By Major Funding Source $5,881,148 (12%) $9,383,304 (19%) $10,846,407 (22%) General Funds Special Funds Federal Funds Interdepartmental $22,867,418 (47%)
7 VT Department of Environmental Conservation FY2015 Budget "Proposed" By Major Expenditure Object Code $4,351,228 (9%) $14,431,789 (29%) $25,426,826 (52%) Personal Services Contracts Operating Grants $4,768,434 (10%)
8 Watershed Management Division Organizational Structure Director Deputy Director Natural Resource Media Programs Discharge Management Programs Ecosystem Restoration Monitoring, Assessment & Planning Administration & Compliance Lakes - Wastewater Hydrology Rivers Residuals Biomonitoring Wetlands Stormwater
9 DEC River Engineering working to reduce emergency measures and restore the natural stream processes that mitigate flood damage 2013 Stream Alteration Permits and Authorizations 30% 27% 43% Project Outcomes Departure Minimized Departure Avoided Equilibrium Restored * Departures from natural stream processes that minimize erosion, such as those associated with stream equilibrium, are avoided or minimized DEC River Engineers: Technically assist ~ project per year Permit ~500 projects per year

10 FEMA Public Assistance Projects from 1999 through 2013

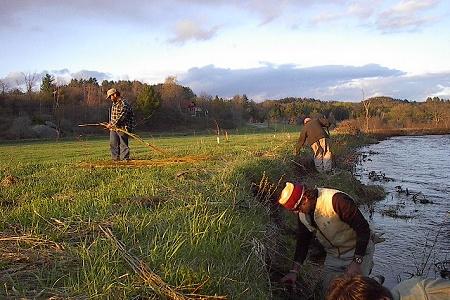
11 Roaring Branch Floodplain Restoration Bennington, VT


12 Wetlands Program Goal: To conserve the significant wetlands of Vermont for the values and functions they provide, with no net loss of wetland functions and values, and no net loss of significant wetland acreage


13 Wetlands Program Number of site visits = avoidance and minimization of wetland impacts - Over 600 site visits in 2013 No permits issued unless applicant demonstrated no loss of wetland function or value. NEW MAP COMING Concentration of Wetland Site Visits Since permits issued in Wetland Site Visits Over 12,000 site visits between 1990 and 2013
14 Stormwater Management Program The Watershed Management Division s Stormwater Management Program regulates stormwater runoff from construction activities, new impervious surfaces, industrial activities, concentrated animal feeding operations, large municipalities, and impervious surfaces in stormwater impaired watersheds. Regulatory Programs and Thresholds Over Time 1980 First state impervious surface regulation 1997 State impervious surface permit amended 2 acres of impervious 2003 First Construction General Permit (CGP) 5 acres of disturbance 2003 Municipal Separate Storm Sewer System (MS4) Permit Census designated municipalities (within Chittenden Co.) 2005 State impervious surface permit renewed 1 acre of impervious 2006 CGP amended 1 acre of disturbance 2006 Multi-Sector General Permit (MSGP) Categories of industrial activity 2009 Residual Designation Authority (RDA) permit Properties in stormwater impaired watersheds 2012 MS4 with stormwater TMDL implementation Expanded to St. Albans & Rutland 2013 Concentrated Animal Feeding Operations (CAFO) Medium and Large farms


15 Total Active Permits Over Time Stormwater Management Program The number of active permits has increased over the last several years due to introduction of new permit programs and the lowering of jurisdictional thresholds. Authorizations issued for Multi-Sector or Operational coverage remain active as long as the industrial activity or impervious surface remains, so the number of these permits generally increase from year to year # of Active Permits Year
16 Stormwater Management Program Sediment in urban runoff degrades aquatic habitat and carries attached pollutants and nutrients, such as phosphorus. By requiring treatment of runoff from impervious surfaces, the state stormwater program prevents an increasing amount of sediment from impacting our water resources every year. Annual Sediment Removal Resulting from the State Permit Program Sediment Treated (tons) Year
17 Ecosystem Restoration Program Provides grants to municipalities and organizations Targets polluted runoff & erosion - the leading cause of water quality degradation Fiscal Year 2014 Grant Awards Applying Tactical Basin Planning to target high priority projects 64 grants awarded Over $2 million in grant funds allocated across the State Grant Funds Allocated by County or Regionally $300,000 $250,000 $200,000 $150,000 $100,000 $50,000 $0
 Grant Funds Allocated by Project Type $1,000,000")


18 Ecosystem Restoration Program Fiscal Year 2014 Grant Awards (Continued) Grant Funds Allocated by Project Type $1,000,000 $800,000 $600,000 $400,000 $200,000 $0 River Channel, Lake Shoreland Stability Stormwater Mitigation Road Infrastructure Stability Agricultural Runoff Mitigation Improving road drainage, Randolph Mitigating stormwater runoff, Hardwick Restoring vegetated buffer, Woodstock
19 Director Sites Management & Brownfields Redevelopment Solid Waste Management Hazardous Waste Program Salvage Yards Underground & Above Ground Storage Tanks Spills and Emergency Response

20 Change our view from waste to
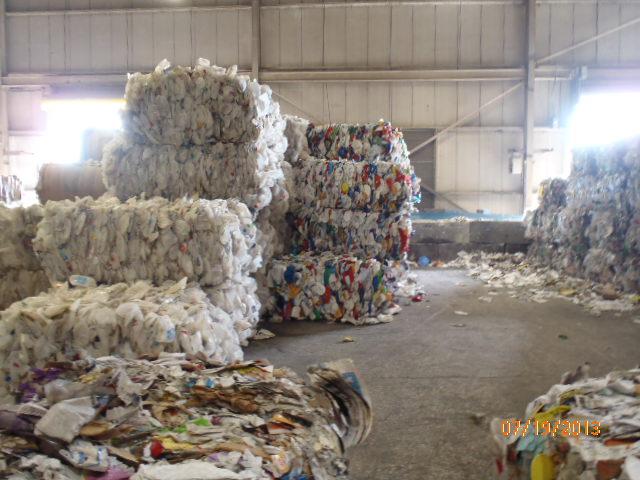
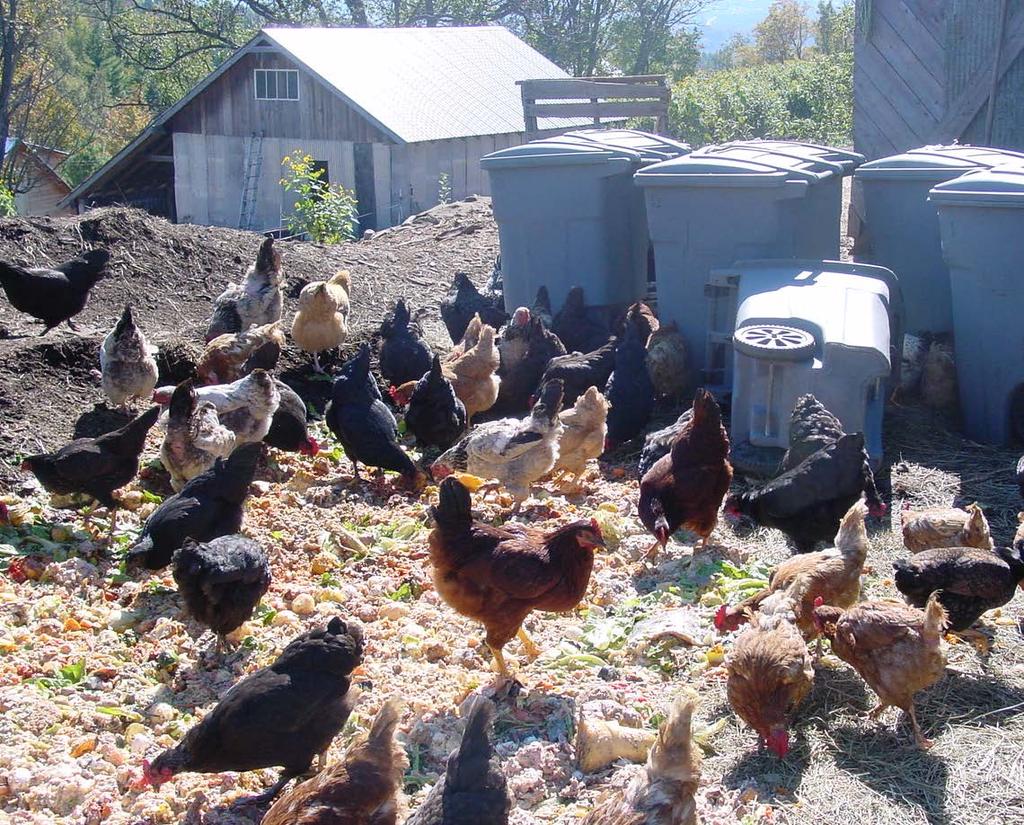
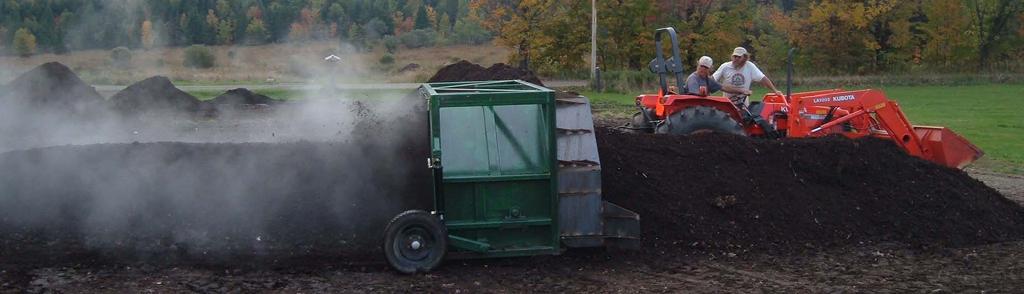
21 Materials Management

 Tonnage Diverted (actual) 0 2000 2002 2004 2006 2008 2010")

22 Amount of Material (in tons) 700, , , , , , ,000 Materials Disposal and Diversion Vermont Past, present and future estimates Population (Census data) Tonnage Disposed (actual) Tonnage Diverted (actual) *Diversion refers to materials that are recycled or composted. Waste prevention and re-use is not currently tracked by ANR.


23 Current Disposal Rate 2013 Waste Composition Study Residential Industrial, Commercial and Institutional
 releases and annual clean up costs are")
24 Measure of Success: Above ground storage heating oil tank (AST) releases and annual clean up costs are decreasing
25 PCF Funds reimbursed # of releases w/ claims # of AST Grants AST Releases, Petroleum Cleanup Fund Claims, and Tank Replacement Grants $1,600,000 $1,400,000 $1,200,000 $1,000, $800, $600,000 $400,000 $200, $0
26 Brownfields Development Program leverages funding from other sources EPA Assessment Federal money used for site assessments Phase 1, Phase 2, and Corrective Action Plans EPA Cleanup Federal money used for implementation of Corrective Action Plan Leveraged Funding $1,264,567 $2,962,488 Leveraged Funding All funding allocated for total project redevelopment (examples include: Community Development block grants, HUD, private funding (loans)etc.. $33,021,475 This chart represents data from 63 Sites out of 244 total Brownfields sites in Vermont. Data source is an EPA database BROWNFIELD Site means real property, the expansion, redevelopment, or reuse of which may be complicated by the release or threatened release of a hazardous material. BROWNFIELD Development promotes: Positive Environmental Outcomes, Downtown Development, Job Creation, Increased Property Tax Revenue, Private Investment and much more!


27 Funding Gap: Increasing number of Brownfields sites per year with decreasing federal funding Number of Sites Dollars (federal money from EPA) Photo of Windsor Welcome Center, Windsor, VT 10 5 Federal Brownfields $/Year* Brownfield sites added per year *Money/year represents EPA money awarded to all applicants in Vermont (VTDEC, ACCD, RPC, Municipal, Non-profits)
 City Place, Barre")
28 Brownfields Program: Environmental Protection, Economic Growth and Redevelopment Downtown Cores, Rivers& High Concentrations of Brownfields (2012) City Place, Barre City
29 Facilities Engineering Division Facilities Engineering Division Dam Safety Agency Facilities Water Infrastructure Financing Financial Management Project Development Accounting Design Section Construction Section

30 Dam Safety Program Mill Pond Dam, Windsor, VT High Hazard Dam
31 70 60 Vermont Dam Safety Program: 5 Year Average Inspections vs. Target Inspections % of Target 85.5% of Target 32.8% of Target 59 Hazard Class Key Potential Loss of Life Number of Dams Annual Year Target Avg. 5 Year Avg. Annual Target 19 5 Year Avg. Annual Target HIGH = More than a few SIGNIFICANT = Few LOW = None Expected Potential Economic Loss HIGH = Excessive SIGNIFICANT = Appreciable LOW = Minimal 0 High Significant Low Hazard Class
32 Facilities Engineering Division: Annual Infrastructure Investment * 60 Infrastructure Investment in ($Millions) Dam Safety Construction Projects Awarded Agency Facilities Total Project Cost DW Construction Bids Awarded CW Construction Bids Awarded * Calendar Years * Projected

33 Before Significant Hazard Dam Dufresne Pond Dam, Batten Kill ~Manchester, VT

34 After No Hazard Batten Kill Restored, Dufresne Pond Dam Removal Fall 2013


35 Clean Water State Project Financing Wastewater Treatment Facility Secondary Lagoon ~Swanton, VT, 2013 Burlington Vermont
36 100 Clean Water State Project Financing: Loans and Grants Dollars ($ Millions) Annualized CW Need State and Federal Funds Linear (Annualized CW Need) 0 FY 2000 FY 2001 FY2002 FY 2003 FY 2004 FY 2005 FY 2006 FY 2007 FY 2008 FY 2009 FY 2010 FY 2011 Fiscal Year FY 2012 FY 2013 FY 2014* FY 2015* FY 2016* FY 2017* FY 2018* FY 2019* FY 2020* * Projected
37 Air Quality and Climate Division Director Engineering Services/Permitting Air Planning Mobile Source Control Technical Services Field Services
38 Total Vermont Gross Greenhouse Gas (GHG) Emissions This performance measure tracks progress in meeting Vermont s GHG reduction goals. Vermont did not achieve its 2012 goal of reducing GHG emissions to 25% below 1990 levels. Vermont now must focus on reducing GHG emissions to 50% below 1990 levels by 2028 as set forth by state statute.
39 This performance measure indicates that Vermont s measured ambient air concentrations for the six criteria pollutants have generally been declining over time, and all of Vermont is currently in attainment with EPA s NAAQS. Percent of NAAQS Standard Ambient Air Quality Trends for Criteria Pollutants in Vermont Shown as a Percent of the Current National Ambient Air Quality Standard (NAAQS) 100% of Standard Ozone Particulate Matter Sulfur Dioxide Nitrogen Dioxide Carbon Monoxide Lead

40 Number of Registered Stationary Sources in Vermont and Associated Emissions of Criteria Air Pollutants
41 6,000 Ambient Air Quality Trends for Benzene in Vermont (Shown as a Percent of Current VT Hazardous Ambient Air Standard VT HAAS) 5,000 Rutland Benzene Burlington Benzene Percent of VT HAAS Standard 4,000 3,000 2,000 1,000 Underhill Benzene 100% of VT Standard While ambient air concentrations of many hazardous air contaminants have declined in VT over time, benzene remains well above VT s standards. The difference between the urban sites in Rutland and Burlington and the rural site in Underhill indicates that local sources (e.g., motor vehicle exhaust, refueling, and residential wood burning) are primarily responsible for VT s benzene levels.

42 Motor vehicles are the largest source of air pollution in Vermont. Decreasing motor vehicle emission standards help to offset increases in VMT and vehicle population in Vermont. The AQCD also supports efforts to ensure emission control systems are properly maintained and repaired.
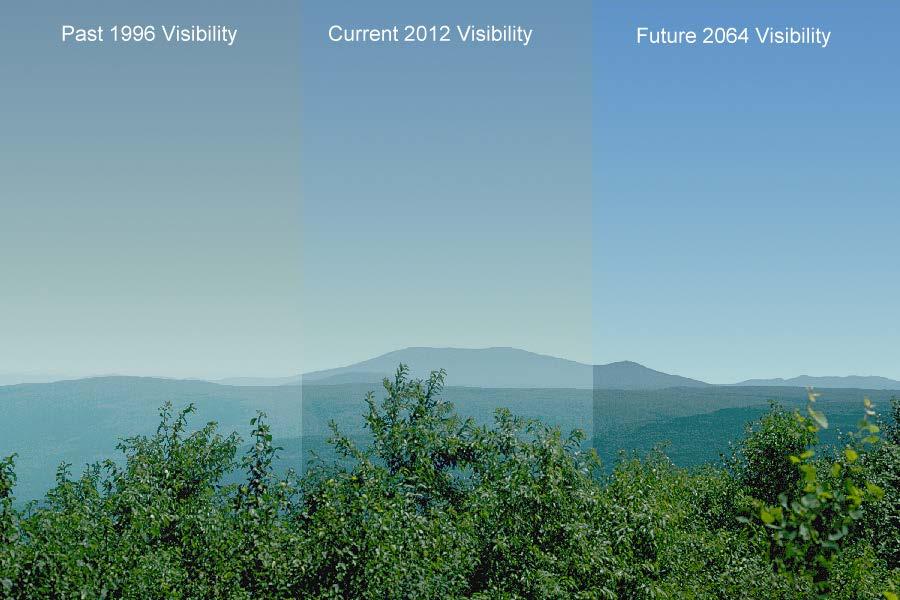
43
44 Decreasing Sulfate + Nitrate Pollution in Lye Brook (Red Line, Left-hand Scale) & Improving Visibility Conditions in Lye Brook (Blue Line, Right-hand Scale) Sulfates + Nitrates (µg/m 3 ) Visual Range (kilometers)