Gasification and combustion of corn kernels in a pilot scale system
|
|
|
- Marcia Lee
- 5 years ago
- Views:
Transcription

 thesis, University of Iowa, 2015. https://ir.uiowa.edu/etd/1750. Follow this and additional works at: https://ir.uiowa.edu/etd Part of the Mechanical Engineering Commons")
1 University of Iowa Iowa Research Online Theses and Dissertations Spring 2015 Gasification and combustion of corn kernels in a pilot scale system Tejasvi Sharma University of Iowa Copyright 2015 Tejasvi Sharma This thesis is available at Iowa Research Online: Recommended Citation Sharma, Tejasvi. "Gasification and combustion of corn kernels in a pilot scale system." MS (Master of Science) thesis, University of Iowa, Follow this and additional works at: Part of the Mechanical Engineering Commons
2 GASIFICATION AND COMBUSTION OF CORN KERNELS IN A PILOT SCALE SYSTEM by Tejasvi Sharma A thesis submitted in partial fulfillment of the requirements for the Master of Science degree in Mechanical Engineering in the Graduate College of The University of Iowa May 2015 Thesis Supervisor: Associate Professor Albert Ratner
3 Copyright by TEJASVI SHARMA 2015 All Rights Reserved
4 Graduate College The University of Iowa Iowa City, Iowa CERTIFICATE OF APPROVAL This is to certify that the Master s thesis of MASTER S THESIS Tejasvi Sharma has been approved by the Examining Committee for the thesis requirement for the Master of Science degree in Mechanical Engineering at the May 2015 graduation. Thesis Committee: Albert Ratner, Thesis Supervisor H.S. UdayKumar Ching-Long Lin
5 ACKNOWLEDGEMENTS I am very thankful to Professor Ratner who has supported, guided and mentored me ever since I was an undergraduate lab assistant. I am very grateful to be part of your team. I am thankful for the support my parents and my brother have given me. Thank you for believing in me. Lastly I will like to thank my lab teammates, Yunye shi and Guiyan Zang and the rest of the combustion team mates for their support and collaboration. ii
6 ABSTRACT Gasification is a process that converts organic or fossil fuel based material into syngas at high temperature under controlled amount of air. The syngas can be used in a gas engine and thus increases the practicality of using biomass as a renewable source of energy. The goal of this paper is to explore corn kernel gasification at the University of Iowa Oakdale pilot scale gasifier. The results of this paper consists of three parts; the temperature profile in the gasifier, gas analysis at 950F and 1050F, and bio char analysis. The temperature profile within the gasifier was obtained and studied; different temperature gasification zones were identified. Sample gases at 950F and 1050F were obtained and analyzed. It was seen that the syngas production (in volume) at 1050 F was 12.2% greater than that of 950F. A 37.4%, 27.1% and 38.3% increase in composition of H, CO and CH 4 respectively was also observed. Ultimate analysis, proximate analysis, SEM and BET tests were carried on the corn bio char produced. From the ultimate and proximate analysis, it was observed that corn bio char was similar to activated carbon. Oakdale bio-char was compared with other processed powder bio char. It was observed that char produced from the Oakdale gasifier was more porous than powder bio-char, possibly making it a better soil amendment. iii
7 PUBLIC ABSTRACT Gasification is a process that converts organic or fossil fuel based material to gases such as carbon monoxide, hydrogen and carbon dioxide at high temperatures using controlled amounts of oxygen. The outcome of gasification is clean synthesis gas (syngas), which can be directed into a boiler for electricity production, can be used as a heat source for hot water generation and bio char processing. Bio char is a soil amendment that can be used by farmers to grow crops. Gasification, a member of the renewable energy family, could help a country reduce its dependence on imported oil. This paper studies the gasification of corn kernels in the University of Iowa twoyear-old pilot-scale gasifier located at the Oakdale power plant. About 10% of corn produced by farmers is discarded as waste due to pesticides and fungicides. Gasification can be used to convert this corn into usable energy. Three topics were examined in the paper: the temperature profile in the downdraft gasifier, the composition of sample synthesis gas obtained at 950F and 1050F, and the quality of the bio char produced. These analyses were compared to results from biomasses and it was observed that the char produced at Oakdale had similar properties with activated carbon (a type of carbon used for water and gas purification) under some of the tests. iv
8 TABLES OF CONTENTS LIST OF TABLES... vii LIST OF FIGURES... viii Chapter 1: INTRODUCTION AND LITERATURE REVIEW Motivation and background Gasification processes Types of Gasifiers Gasification technology versus other waste management technology Factors affecting gasification Conversion of syngas to Bio power Chapter 2 : MATERIALS AND TESTING METHOD : Materials used in this experiment Large scale Experimental setup Tar removal system Gas chromatography Experimental Procedure Chapter 3 : RESULTS AND DATA ANALYSIS Gasification temperature profile and superficial velocity Gas evolution production and measurement Bio char analysis Comparison results to other studies Chapter 4 : CONCLUSION AND FUTURE WORK Conclusions v
9 4.2 Future work APPENDIX A APPENDIX B APPENDIX C REFERENCES vi
10 LIST OF TABLES TABLE 1.1: APPLICATION LIMITS OF BIOMASS GAS TAR AND PARTICULATES TABLE 2.1 : PROXIMATE AND ULTIMATE ANALYSIS OF CORN AND OTHER BIOMASSES TABLE 3.1: GASIFIER OPERATION PARAMETERS AT 950F TABLE 3.2: SYNGAS COMPOSITION AT 950F TABLE 3.3 : GASIFIER OPERATIONS AT 1050F TABLE 3.4 : SYNGAS COMPOSITION AT 1050F TABLE 3.5 : ULTIMATE ANALYSIS OF BIOCHAR TABLE 3.6 : PROXIMATE ANALYSIS OF BIOCHAR TABLE 3.7 : BIOCHAR ULTIMATE AND PROXIMATE ANALYSIS COMPARISON vii
11 LIST OF FIGURES FIGURE 1.1 GASIFICATION TECHNOLOGIES AND THEIR COMMERCIAL USE. 5 FIGURE 1.2 : RANGE OF APPLICABILITY FOR BIOMASS GASIFIER... 5 FIGURE 1.3 : SCHEMATIC OF AN UPDRAFT GASIFIER... 6 FIGURE 1.4 SCHEMATIC OF A DOWNDRAFT GASIFIER... 7 FIGURE 1.5: SCHEMATIC OF A CROSS DRAFT GASIFIER... 8 FIGURE 1.6 SKETCH OF THE ORIGINAL BUBBLING FLUIDIZED-BED GASIFIER... 9 FIGURE 1.7 : TEMPERATURE VERSUS EQUIVALENCE RATIO FIGURE 1.8 : SCHEMATIC OF A FOSTER WHEELER BOILER FIGURE 1.9 : GE'S LENBACKER TYPE-2 SYNGAS ENGINE FIGURE 1.10 : GE'S CLASS E SYNGAS TURBINE FIGURE 2.1 : OAKDALE PILOT-SCALE GASIFIER SETUP FIGURE 2.2: PRIMARY FUEL BIN FIGURE 2.3 : SECONDARY FUEL BIN FIGURE 2.4 : OUTER VIEW OF THE GASIFIER FIGURE 2.5 : INNER VIEW OF THE GASIFIER (BOTTOM VIEW-LEFT AND TOPVIEW-RIGHT) FIGURE 2.6 : SCHEMATIC OF THE UI'S DOWNDRAFT GASIFIER FIGURE 2.7 : SCHEMATIC OF THE PROBE FIGURE 2.8 : TAR COLLECTION SYSTEM FIGURE 2.9 : SCREEN SHOT OF THE CONTROL PANEL FIGURE 2.10 : START UP AND STEADY STATE FUEL LOADING viii
12 FIGURE 2.11: PREVIOUS CHUTE(LEFT) AND DAMPER(RIGHT) INSTALLED IN THE UI GASIFER FIGURE 3.1 : TEMPERATURE PROFILE IN THE UI'S PILOT-SCALE GASIFER FIGURE 3.2 : OUTER LAYER OF BIOCHAR UNDER A MAGNIFICATION OF X3041 FIGURE 3.3 : OUTER LAYER OF BIOCHAR AT A MAGNIFICATION OF X FIGURE 3.4 : INNER VIEW OF BIO-CHAR AT A MAGNIFICATION OF X FIGURE 3.5 : INTERIOR VIEW OF THE BIO CHAR AT A MAGNIFICATION OF X FIGURE 3.6 : INTERIOR VIEW OF THE BIO-CHAR AT A MAGNIFICATION OF X FIGURE 3.7 : REED'S TEMPERATURE PROFILE IN A DOWNDRAFT GASIFIER.. 45 FIGURE 3.8 : MCKENDRY DOWNDRAFT TEMPERATURE PROFILE FIGURE 3.9 : OUTER LAYER OF POWDER BIOCHAR FIGURE 3.10 : INTERIOR LAYER OF POWDER BIOCHAR ix
13 1 Chapter 1 : INTRODUCTION AND LITERATURE REVIEW 1.1 Motivation and background Biomass gasification has become a relevant renewable energy field of study in the past few years. Alongside major initiatives such as geothermal, hydroelectric, solar and wind energy, biomass gasification is proving to be a reliable renewable technology. Its potential to convert biomasses and waste into something much more useful such as electricity, steam, and bio char makes it a very appealing technology in the energy sector. Gasification has the potential of decreasing environmental pollution by decreasing harmful emissions of C02, SO2 and NOx by a significant level. This technology is extensively studied and used in European countries such as Sweden, Norway, Netherland and the United Kingdom. Biomass gasification can help small and medium sized enterprises using the energy converted from syngas. As such this technology can also be used in developing countries, especially in areas, which are off the grid. Gasification is a process that converts organic or fossil based carbonaceous materials into carbon monoxide, hydrogen and carbon dioxide at high temperature with controlled amount of oxygen. The resulting gas is known as syngas and could be used to generate electricity when passed through a turbine. Gasification also releases great amounts of heat, which if well utilized, could be used to produce steam, and bio char, a product that can act as a soil amendment. Some companies such as Energy Independence based in Ames, Iowa, are currently using this technology. They plan to promote gasification using a
14 2 downdraft gasifier in developing countries such as Brazil, Tanzania and Belize. They intend to gasify municipal waste present in these regions to produce syngas, which will be directed into a boiler to generate electricity. The goal of this thesis paper is to study three things; the temperature profile obtained at the Oakdale gasifier to identity the different gasification zone within the system, the sample composition of syngas produced at 950F and 1050F, and the bio- char produced from this system. 1.2 Gasification processes Gasification processes is the conversion of solid or liquid feedstock into useful and convenient gaseous fuel that can be burned to release energy or used for production of value added chemicals [7]. Gasification and combustion are very similar to one another but have an important difference. Gasification packs energy into chemical bonds in the product gas while combustion breaks those bonds to produce energy. Biomass gasification process includes the following process [7, 17]; Drying All biomasses have a certain amount of moisture present in them. For example freshly cut wood has moisture content varying from 30% to 60%. It is calculated that every kilogram of moisture in a biomass wastes a minimum of 2242 KJ of extra energy from the gasifier. This energy cannot be recovered. For this reason, most biomasses have to be pre- dried before been inserted into a gasifier. An acceptable range of biomass moisture to be inserted in the gasifier ranges from 10 to 35%. This varies depending on the specific type of gasifier. In the drying zone, at above 100 degrees Celsius, loosely bound water present in the biomass is
15 3 irreversibly removed. This leads to the low- molecular- weight extractives to start volatizing until the temperature of the system reaches 200 degrees Celsius. Pyrolysis/thermal decomposition Pyrolysis occurs at temperatures of about 350 degrees Celsius [14]. Pyrolysis involves the thermal breakdown of larger hydrocarbon molecules of biomass into smaller gas molecules with no major chemical reactions occurring with air or any other gasification medium (for example nitrogen) [7]. The output of this process is bio- char (which is mostly made up of carbon), gas (CO, CO2, H2, H20, and CH4) and tar vapor [14]. The tar is formed through the condensation of condensable vapor produced in the process. There are two types of pyrolysis: slow and fast pyrolysis. Slow pyrolysis is mainly observed in a gasification system. Combustion The outputs from the pyrolysis pass through the combustion zone. The temperature in this zone ranges from 800 to 900 degrees Celsius [28]. Basic reactions: C + O! CO! 4H + O! 2H! O C! H! + N 2 + M 4 O! NCO! + M 4 H!O Gasification of decomposed products. (Char gasification) This stage is also called reduction [8]. The char produced from pyrolysis is not usually pure carbon and usually contains some amount of hydrocarbons
16 4 consisting of hydrogen and oxygen [14]. Char gasification is an important process and this zone involves several reactions between char and the gasification medium. Char + O! CO! + CO Char + CO! CO Char + H! O CH! + CO Char + H! CH! Another way of looking at the reduction is seeing it as a zone where the producer gas is produced [28] using the following two endothermic equations Boudouard reaction: C + CO! 2CO Water gas reaction: C + H! O H! + CO Gasification reactions are generally endothermic in nature, but some of them can be exothermic as well. [14]. It should be noted that there are no sharp boundaries between the different type of zones in a gasifier (fixed bed gasifier) and as such these zones may often overlap. The fuel entering a gasifier has to pass through the above- mentioned zones so as to be completely converted [28]. 1.3 Types of Gasifiers There are mainly three categories of gasifiers; fixed bed, fluidized bed and entrained flow bed [14, 21]. There is an appropriate use for each of them. Fixed bed gasifiers (updraft and downdraft) are usually used for smaller units (<10 MW), fluidized bed (5-10 MW) and entrained flow are used for large capacity units
![5 (1000MW) [17].](/docs-images/87/97402908/images/17-0.jpg "Some examples of companies that use gasification as a source of energy includes Sasol, based in South Africa and several plants in Germany that convert municipal waste to electricity [1]. Figure 1.")
17 5 (1000MW) [17]. Some examples of companies that use gasification as a source of energy includes Sasol, based in South Africa and several plants in Germany that convert municipal waste to electricity [1]. Figure 1.1 Gasification technologies and their commercial use [14] Figure 1.2 : Range of applicability for biomass gasifier [14] The cost of manufacturing a fixed bed gasifiers can relatively be cheaper compared to other types of gasifiers. For this reason large numbers of small- scale fixed bed gasifiers are used around the world. draft. There are three types of fixed bed gasifiers; updraft, down draft and cross
![6 Figure 1.3 : schematic of an updraft gasifier [14] An updraft gasifier is widely used for coal gasification and non- volatile fuel.](/docs-images/87/97402908/images/18-0.jpg "One of the drawbacks of an updraft gasifier is it produces tar at a higher rates (30-150 lb./nm 3, 14 70 kg/ Nm 3 ). Updraft gasifiers were used in the early part of World War 2.")
18 6 Figure 1.3 : schematic of an updraft gasifier [14] An updraft gasifier is widely used for coal gasification and non- volatile fuel. One of the drawbacks of an updraft gasifier is it produces tar at a higher rates ( lb./nm 3, kg/ Nm 3 ). Updraft gasifiers were used in the early part of World War 2. In this system air enters the gasifier from below the grate and flows through the bed to produce a combustible gas [14]. Moisture from the biomass is removed in the drying zone followed by pyrolysis zone. The fuel then moves into the reduction and combustion zone where char is broken down. Due to high production, fluffy biomasses are unsuitable to be used in an updraft gasifier. [21]. An example of a company where an updraft gasifier is currently is SASOL based in South Africa. SASOL produces barrel/day of Fischer- Tropsch liquid fuel [17].
![7 Figure 1.4 Schematic of a downdraft gasifier[17] In a downdraft gasifier, air enters the gasifier at a certain level above the top. The product gas flows out from the bottom.](/docs-images/87/97402908/images/19-0.jpg "This gas passes through a high temperature zone, which provides favorable conditions for cracking to occur.")
19 7 Figure 1.4 Schematic of a downdraft gasifier[17] In a downdraft gasifier, air enters the gasifier at a certain level above the top. The product gas flows out from the bottom. This gas passes through a high temperature zone, which provides favorable conditions for cracking to occur. For this reason, a downdraft gasifier produces very little tar since most of it is thermally cracked down at the reduction zone. [14, 19,21]. Highest amount of tar among different types of downdraft gasifiers have been observed at under temperatures of 700 degrees Celsius [22]. Downdraft gasifiers work well with biomasses that contain low moisture content [9]. The gas from a down draft system is clean and can work well with internal combustion engines. The biomass in a downdraft gasifier passes through several zones. In the first zone, the biomass is dried. It then passes through a pyrolysis zone, which is the second zone where little or no air is present. Most of the tar, ash and pyrolysed char is produced in the 3 rd zone and 4 th zone these zones consists of hot ash and unreacted charcoal, which cracks any tar present [14].
20 8 Figure 1.5: Schematic of a cross draft gasifier [17] In a cross draft gasifier, fuel is fed from the top and air is inserted from the sides using a nozzle. This type of gasifier is primarily used for gasifying charcoal with little ash content. Crossdraft gasifiers can be light, small, and can handle biomasses with a high moisture content.
21 9 Figure 1.6 Sketch of the original bubbling fluidized- bed gasifier [17] Fluidized bed gasifier contains a bed, which is used to heat the biomasses with a gasifying agent [21]. This bed is made up of sand or ash and acts as a heat transfer medium [17]. In contrast to the fluidized bed gasifier, no distinct zones exist and as such gasification and pyrolysis can occur at the same time. Catalyst such as carbonates, limestone, calcium chloride and inorganic salts can be used to increase the efficiency of a fluidized bed gasifier. Biomass entering a fluidized bed requires to be crushed to less than 10mm. Example of fluidized plants in the US includes the 15MW project at McNeil power station in Burlington (Vermont,) and 5MW project ay Paia (Hawaii) [2]. 1.4 Gasification technology versus other waste management technology Gasification is currently seen as one of the best solution to get rid of waste and at the same time produce electricity. We shall be comparing gasification with
22 10 other technologies used in trash management and explore the possible advantages of using gasification. Incineration Incineration is defined as the act of burning something completely, reducing it to ashes [12]. They operate at atmospheric pressure and temperature [3]. In an incinerator unit, feed stock, waste material is directly burnt by using large amount of air. What remains from this process is ash that has to be treated before been deposited in the landfill. A huge drawback of Incineration is it also emits harmful gases such as Sulphur dioxide, Nitrogen dioxide and fine particulates. [3]. Anaerobic digestion Anaerobic digestion is a defined as the microbial decomposition of organic matter into methane, carbon dioxide, inorganic nutrients and compost in an oxygen- depleted environment and in the presence of the hydrogen gas [5]. There are many countries including Germany, Denmark and UK who are currently investing in anaerobic digesters. These digesters are sealed and contain heated tanks, which provide a suitable environment for naturally occurring anaerobic bacteria to grow, multiply, and convert manure to biogas. The biogas can be used to replace natural gas. The main drawback of this process is that it has a costly initial investment. It requires a periodic cleaning of the digester. [23, 24] Thermal hydrolysis Thermal hydrolysis is a two- stage process that combines pressure- cooking followed by rapid decompression. Here, sludge from waste can be heated to a temperature ranging from 150 to 200 degrees Celsius with a pressure range
23 11 between 6 bars to 25 bars [13]. This process is usually combined with anaerobic digestion. The pressure and temperature in this process gets rid of any pathogens that can be used as a precursor to anaerobic digestion. An example of a thermal hydrolysis plant is the District of Colombia water and sewer authority plant (DC Water), which started operation in Plasma gasification Here, very high temperatures are used to gasify biomass hydrocarbons. This process can also be called plasma pyrolysis as this process takes place in an oxygen- starved environment. Here, inert gas is passed through two electrodes causing an electric arc to be produced. The temperature produced by this arc is usually of around 13,000 degrees Celsius and can vary to degrees Celsius. The main advantage of using plasma gasification is that it s insensitive to the quality of feedstock that is inserted into this system. [14] 1.5 Factors affecting gasification There are a number of factors that affect gasification reactions. These include temperature, pressure, height of the reactor bed, the fluidization velocity, the equivalence ratio, the air to steam ratio, and the characteristic of the fuel. [17]. Temperature An increase in temperature in a gasifier increases the formation of combustible gases and decreases the yield of char and liquids[18]. This was observed by Scott et Al (in 1988) when trying maple sawdust. Voloch et al also observed this when they were testing corn corbs (in 1983)[18]. It was found that the calorific value of biomass producer gas increased steadily up to 700 degrees
24 12 Celsius and then reduced [18]. It is suggested by researchers such as Sadaka that the increase in the calorific value at that temperature was most likely due to increase in concentrations of CO, H2 and hydrocarbon gases in the gas mixture. The decrease in the calorific value after 700 C could also be from the thermal decomposition of the hydrocarbons present. [18]. A downdraft gasifier such as that present at Oakdale has a gas exiting temperature of about 700 degrees Celsius but it s peak gasification temperature at the throat is about 1000 degrees Celsius. This corresponds perfectly to other downdraft gasifiers analyzed by Prabir Basu[14]. Syngas exit temperature from a down draft gasifier may range from 600 to 1200 degrees Celsius. Bed pressure Increase in pressure in a gasifier leads to increase in char gasification. The higher the pressure and temperature, the better the char gasification [17]. Higher bed pressure also leads to higher production of methane [18]. Bed height Increase in bed height, increases the residence time and also leads to an increase in gas yield. This was observed by Sadakar et al (in 1998), when their gasifier efficiency increased by raising their bed height. Other researchers such as Font et al saw an increase in their gas components (H2, CO2, CO, CH4 and C2H2) as a result of increased residence time due to the increase in bed height [18]. This observation was also done at our pilot scale gasifier. When our bed height was brought to 5.5 inches, we observed more fresh corn in our char bin. When we raised our bed height to 6 inches, we observed less fresh corn and an increased rate of bio
25 13 char production. This was because increasing the height of the bed led to a longer residence time, which allowed for an increased heat transfer leading to a better biochar formation (this observation agrees with Samy Sadaka s paper [18]) Equivalence ratio The equivalence ratio has a great impact on the performance of gasifiers as it affects the bed temperature, its thermal efficiency, and the quality of the gas evolved from the gasifier [18]. Equivalence ratio is defined as the ratio of the actual air- fuel ratio to the stoichiometric air- fuel ratio. [14, 8] Equivalence ratio = (( m!"#$ m!"#$#%&' )/( m!"#$ m!"#$#%&' )!"#$%!!"#$%&' ) Downdraft gasifiers give best yield at an equivalence ratio of about 0.25 [14]. It has been observed that low equivalence ratio value led to low char formation [14]. High equivalence ratio of more than 0.4 tends to produces combustion gases that are composed of CO2 and H2O rather than the desirable CO and H2 [14]. High equivalence ratio also increases the rate of syngas production while lower ratios lead to lower energy content and more tar production [17]. Equivalence ratio can restrict the temperature of a gasifier from 700 degrees Celsius [8]. In the downdraft gasifier at Oakdale, the equivalence ratio at steady state ranges from [29].
26 14 Figure 1.7 : Temperature versus equivalence ratio Fluidized velocity Fluidization is a processing technique, which employs a suspension of a small solid particle in a stream of fluid (usually gas) so that solid particle may come in contact with the fluid [17]. The higher the fluidization velocity the higher the bed temperature and the lower the producer gas heating value due to the increased amounts of oxygen and nitrogen in the system [18]. This property is usually observed in a fluidized bed gasifier. Characteristics of fuel (Moisture content, size of the feed material) The moisture content of the fuel affects the reaction temperature. This is because part of the energy from the system is required to evaporate the water present in the fuel. Studies done by Elliot and Sea lock in 1985 suggest that the
27 15 temperature of the gasifier decreased when fuel with greater moisture content is fed in the system [18] and also has an effect on the production gases [17]. The size of the fuel also affects the amount of tar and char produced a rough fuel texture leads to an increased production in char and lower production of tar [18]. Lu et Al in 2006 showed that fuel with small particle sizes improved the gasifier s efficiency. This has not yet been generally accepted, as other authors such as Mettanant et al did not find the same results under similar experimental conditions [14]. 1.6 Conversion of syngas to Bio power We have been approached by companies, which will be using downdraft gasifiers such as the one located at university of Iowa power plant to produce electricity in developing countries. For this reason, this part of my thesis looks at some methods through which the syngas from our gasifier could be used to produce electricity. Boiler The syngas that comes out from a gasifier is usually around 700 degrees Celsius. This means that gas can be fed directly into a boiler without a need of a heat exchanger [16]. A boiler such as the one in the Oakdale power plant can burn natural gas to produce heat, which can be used to convert water to steam. Syngas can be co- fired with natural gas to burn in boiler. An example of a co- firing boiler is the foster wheeler system at Ruien power plant. Here the syngas is co- fired with coal to convert water into steam and can produce an electric output of 790MW [16].
![16 Figure 1.8 : Schematic of a Foster Wheeler Boiler [30] Gas engines Gas engine is an internal combustion engine, which runs on gas fuel.](/docs-images/87/97402908/images/28-0.jpg "Usually wide range of gases can be used with gas engines, but depending on the gas composition, engine backfiring may occur.")
28 16 Figure 1.8 : Schematic of a Foster Wheeler Boiler [30] Gas engines Gas engine is an internal combustion engine, which runs on gas fuel. Usually wide range of gases can be used with gas engines, but depending on the gas composition, engine backfiring may occur. Due to the rising use of gasification technologies, companies such as Clarck Energy produce gas turbines costumed specifically for syngas. Companies such as General Electric (GE) are following the same trend and are working in collaboration with companies such as Clarck Energy. An example of a syngas engine is GE s Lenbacker Type- 2 Engine. It can produce an electric output of up to 330 Kilowatt- electric (KWe) [27].
![17 Figure 1.9 : Ge's Lenbacker type- 2 syngas engine [27] Gas Turbine A gas turbine expands hot gases that are produced by burning fuel.](/docs-images/87/97402908/images/29-0.jpg "In this case the fuel is syngas. These gases can also work with natural gas and can produce up to 510 MW of electricity.")
29 17 Figure 1.9 : Ge's Lenbacker type- 2 syngas engine [27] Gas Turbine A gas turbine expands hot gases that are produced by burning fuel. In this case the fuel is syngas. These gases can also work with natural gas and can produce up to 510 MW of electricity. An example of such as gas turbine is GE s E class turbine [26].
![18 Figure 1.10 : Ge's class E syngas turbine [26] A comparison on how much tar each of these devices can withhold can be seen in table 1.1. Internal combustion (IC) engines are best suited for syngas containing a high amount of tar.](/docs-images/87/97402908/images/30-0.jpg "Table 1.1 : Application limits of biomass gas tar and particulates [14]")
30 18 Figure 1.10 : Ge's class E syngas turbine [26] A comparison on how much tar each of these devices can withhold can be seen in table 1.1. Internal combustion (IC) engines are best suited for syngas containing a high amount of tar. Table 1.1 : Application limits of biomass gas tar and particulates [14]
31 19 Chapter 2 : MATERIALS AND TESTING METHOD 2.1: Materials used in this experiment The primary fuels used in our pilot scale gasifier are corn kernels. It has a moisture content ranging from 15-25%. Our initial motivation to study corn came from the following reasons 1) 10% corn produced by farmers in Iowa goes wasted due the pesticide and fungicides. This wasted corn could be used to produce syngas, which could be fed into the boiler to produce electricity. Instead of throwing into landfill, waste corn could be used as a potential clean source of energy. 2) Corn is abundantly available in Iowa. Due to its abundance and nearby location, using corn as a starting fuel made sense. The primary fuel in our gasifier currently is seeded corn. We decided not to use contaminated seed corn due various risks involved in handling the material. The contaminants present in it could lead to health hazard if not well handled. Corn is a considered a terrestrial biomass and is classified as an energy crop. Proximate analysis and ultimate analysis in comparison to other biomasses can be seen in table 2.1 [6].
32 20 Table 2.1 : Proximate and Ultimate analysis of corn and other Biomasses [6] Seed contains 66.34% weight of volatile matter. This means 66% of the corn will be converted to condensable and non- condensable vapor once it s heated and about percent of the corn should remain as char when heated. These numbers may fluctuate depending on the amount of moisture present and other factors. The above data was collected on seed corn from Iowa with a moisture content of 15% [4, 8] We run an average of 50-75lbs (22-34 kg) seed corn per hour, averaging to 300 lbs (136 kg) of corn during an average day test. Our gasifier can run up to 250 (114kg) lbs of corn per hour.

33 Large scale Experimental setup Figure 2.1 : Oakdale pilot- scale gasifier setup The primary fuel and secondary fuel are located externally from the main gasifier. Fuel from the primary and secondary bin is transported to a metering bin using a spiral connected to a motor. This process is automated and the operator can control the amount of fuel transported from both bins using a control panel located next to the gasifier. As such the amount of fuel in the metering bin is closely measured and monitored before inserting it into the gasifier. Once the gasifier is running and has attained steady state, most of the syngas produced from the gasifier exits into a boiler. At steady state, part of this syngas is collected for testing purposes by either using a probe or an outlet located at the pipe connecting the gasifier to the boiler. Once syngas collected, it is passed through a tar filtering system and its gas components are tested using a gas chromatography (GC).
34 22 Our pilot scale gasifier at Oakdale is made up of several important components. These are: Primary and secondary fuel storage One of the advantages of our pilot scale gasifier is its ability to combine two or more different types of biomasses at the same time. Our primary bin (in figure 2.2) is filled with corn and can hold up to 3tonnes of corn kernels. The primary fuel bin is connected to a dust collector. There are two secondary bins (as shown in figure 2.3). Each of them contains a grid so as to allow biomasses of up to 2x2 inches to go through. The size of the fuel plays a critical role. A size of up to 2x2 can easily be carried from the bins to the gasifier using spirals. Spirals were particularly chosen since they can easily transport biomasses of different sizes and densities from one location to another without getting clogged.


35 23 Figure 2.2: Primary Fuel bin Figure 2.3 : Secondary Fuel Bin
36 24 Primary and secondary Metering bin To assure that the biomass entering the gasifier is metered, the biomasses are temporarily stored in a primary and secondary bin. Each of these bins can withhold a weight of 250 to 300 lbs ( kg) per biomass material type. These metering bins are located on the top of the gasifier. Gasifier Our pilot scale gasifier is a down draft gasifier. In a common downdraft gasifier design, air is inserted into a gasifier from the sides, but in our system, air is inserted from the top. As such Fuel and air co- flows in the same direction. There is damper on the top of the gasifier that is used to control the amount of airflow entering the system. Our pilot scale gasifier has an outer diameter of 45.5 inches (1.15m) and is inches (2.58m) tall and is made up of mild steel [25]. Inside it there is a fire tube, and an adjustable turntable. The turntable as seen in figure 2.5 rotates one revolution every four minutes and is used to assure an even temperature at the bottom of the fire tube. On the sides of the gasifier there are four fingers, which is used to mix the fuel inside the gasifier and to maintain an even temperature. The syngas produced goes into a boiler where it is combusted. The driving force on this syngas is the boiler s blower which creates a vacuum, causing a draft of air to flow into and through the gasifier [25]. There are two thermocouples mounted on the gasifier. One thermocouple is on the pipe that transports the syngas into the boiler and the second is on the top of the gasifier.


37 25 Figure 2.4 : Outer view of the gasifier Figure 2.5 : Inner view of the gasifier (bottom view- left and top view- right)

38 26 Figure 2.6 : Schematic of the UI's downdraft gasifier When the biomass enters the system from the top, it passes through a drying zone, combustion zone and a reduction zone. The char produced from the gasifier falls through the bottom of the gasifier and is transported to the storage bin using an auger driven by a motor. Design details on the gasifier can be seen in appendix A. Probe To study more accurately the different temperature variations in the layers produced in the gasifier, three K- type thermocouples located 2 inches (0.05m) apart were inserted into a probe. This probe is 60 (1.52m) long and can be varied at different heights within the gasifier. The top of the probe has two holes that can be used to suck in syngas at the different zones using a pump.
39 27 Figure 2.7 : Schematic of the probe Burner A burner is located at the top of the gasifier. It runs on natural gas and used during the first 6 minutes of operation to heat the system. The burner can be controlled using a control or panel or can also be used manually. Pump A pump is used to suck the syngas produced from the gasifier. This gas passes through a filtering system where impurities such as tar are removed. The cleaned gas is collected in gasbags or can directly be connected to a gas chromatography. A detailed equipment list and their dimensions can be seen in Appendix A.
40 Tar removal system One of the bi products of gasification is tar. For the syngas to work directly in equipment such gas turbines and combustion engine, it is very important to reduce the amount of tar present. The syngas from the gasifier is extracted using a probe and its flow is controlled using a flow meter. This assures a stable flow. The syngas is then pass through 6 sets of impingers, 5 of which contain about 100ml of isopropanol each and the 6 th one is left empty. The 5 th and 6 th impingers are placed in an ice bath of temperatures of about - 20 degrees Celsius. This is to assure that any condensable gas- containing tar and moisture is condensed. The flow rate is kept at 60cfm (0.03 cubic meter/second) for about 3 minutes. Figure 2.8 : Tar collection system
41 Gas chromatography The Gas chromatography (GC) machine in our lab is Agilent 490 micro GC. This GC is made up of four columns but we currently use two for testing purposes. The first column uses Argon as carrier gas and can measure major gases such as He, H2, O2, N2, CH4 and CO. The second column uses helium as carrier gas and measures CO2 and various CxHy compounds (such as C2H4, C2H6). The clean gas that goes through the above mentioned tar collection system is fed into the GC. The GC absorbs the sample gas for the 30 seconds and analyzes the different gas components present the sample gas s thermal conductivity is matched with the thermal conductivities of the carrier gases (helium and argon). Calibration of the GC is necessary if the gas results seem inaccurate. The inaccuracy in a GC s results may usually be due to moisture content. When the GC is not used for a couple of days, bakeout mode setting is used to remove any moisture contents present in the GC. 2.5 Experimental Procedure Before starting the experiments the following steps should be taken. 1) A physical check must be done. The operator, using a ladder should inspect top of the gasifier. He/she should make sure all that all wires are connected and also to make sure that no external objects such as a ranch or screwdriver are present on the top of the gasifier which may lead to injuries. 2) The natural gas line connecting to the burner should be checked. For safety reasons, the Oakdale power plant engineers sometimes close the natural gas
42 30 line. It is important to make sure it s open when running the burner connected to the gasifier. 3) It should be made sure that the gate at the bottom of the primary fuel bin is open. This is especially important during the winter season. Due to freezing condition, the moisture present in the biomass (corn) tends to solidify. This causes the motor enabling the fuel to move from the storage bin to the gasifier to be stuck. To avoid this, the gate at the bottom of the bin is closed during non- operating hours. 4) Before starting the gasifier, the operator should ask for permission from the power plant engineers to run and should request a negative pressure of 0.3 from the boiler. This negative pressure takes care of moving the syngas from the gasifier to the boiler. Most of the operations on the gasifier are done using a control panel. There are mainly four steps that have to be followed. These include: start- up mode, steady- state mode, burn- down mode and shutdown mode. The start- up mode starts with the following actions on the control panel: 1. Start long char/ash auger motor (to receptacle outside the building) 2. Start airlock motor 3. Start short char/ash auger motor (under gasifier) 4. Start gasifier turntable motor. 5. The slide gate between the boiler and the gasifier should be open. This is a very important step so as to reduce any chances of overheating and from voiding an internal pressure accumulation.
 of fuel. Using start- up mode on the control panel, the damper is opened to 100% and the airflow is monitored.")
43 31 These settings are found on the right side of the panel as seen in figure 2.9 Figure 2.9 : Screen shot of the control panel The fuel is loaded into the primary bin and its level is monitored. The temporary bin can store up to 275 to 300 lbs ( kg) of fuel. Using start- up mode on the control panel, the damper is opened to 100% and the airflow is monitored. A certain amount of primary fuel (corn) of about 50 lbs (23kg) is inserted in the gasifier. The airflow entering the gasifier is continuously monitored. Once the gasifier is loaded with fuel about 50 to 75 lbs (23-34 kg) to start with, the burner is turned on for 600 seconds. The burner may be run for a couple of times until temperature of above 400F is reached. The temperature of the gasifier is closely monitored to make sure of the proper functioning of the burner. If no temperature increase is noticed within the first two minutes of running the burner,
44 32 the burner is reset, both using the control panel and manually. The syngas flow is also closely monitored throughout the process. A certain amount of fuel of about 20lbs (9 kg) or more is inserted until steady state operation, as shown in figure The temperature in a gasifier is controlled using the amount of fuel inserted in the gasifier and by using the damper. It takes approximately 90 minutes to two hours for steady state to be reached. This also depends on the moisture content of the fuel. During this period the char bin (located at the exterior) is checked a couple of times to assure a smooth flow of fuel within the system. At steady state, fuel is inserted when a temperature decrease is observed as shown in figure Figure 2.10 : Start up and steady state fuel loading [29] Once steady state is achieved, gas samples are collected both from the probe and the gasifier outlet. These outlets can be switched using a valve.
45 33 To collect the gas, one of the controllers has to climb to the top of the gasifier and adjust the height of the probe. As such, different temperatures and different gas samples can be obtained within the different zones of the gasifier. The controller has to make sure to stop the turning table located at the bottom of the gasifier. This is to avoid the rotating fingers located in the bottom of the gasifier from breaking. Once the ideal location of the probe is set, the gas is extracted using a pump. The gas flows through a flow meter where the flow rate is adjusted and stabilized. The gas is then circulated through a set of impingers containing isopropanol to remove any tar and impurities present in the gas. The clean gas from the impingers is flowed through a gas chromatography where the composition of the gas is analyzed. These measurements are repeated a couple of times at different probe locations. After running the system for some hours at the steady state, the following steps are taken to shut down the gasifier. No fuel is loaded into the system, and a temperature drop is monitored. Once the temperature falls below 500F the air damper is slowly opened. Once the temperature falls down to 350F, the slide gate linking the gasifier to the boiler is closed and the auger transporting the char from the bottom of the gasifier is run for half an hour. The turntable, ash auger, ash airlock and ash auger (long) are closed in this order. The main red switch located under the control panel is pulled to shut off the system [25]. Although, the gasifier may work smoothly, there are some problems that were encountered when running the gasifier. Here are some of the problems and the steps we took to solve them.


46 34 One of the problems we face with the pilot scale gasifier is overheating. After many trials and errors, we realized that the chute connecting the bottom of the gasifier to the char auger caused char to be stuck. This was because the shut was narrow and was bent. This refrained the smooth flow of char, which will lead to high temperatures. To fix this, a wider chute was installed. Figure 2.11 shows the chute that was replaced. Another design change that was made was on the air damper. We realized that when the damper was fully closed, certain amount of air been leaked into the gasifier. This was recently fixed. Figure 2.11 shows the picture of the previous damper that was present. The rubber present at the edge of the damper was burnt down due to high temperatures and as such the damper wasn t working correctly by letting more air than required flow through. A new damper has been placed and is made up of steel Figure 2.11: Previous chute (left) and damper (right) damper installed in the UI gasifier
47 35 Chapter 3 : RESULTS AND DATA ANALYSIS The results obtained for this paper mainly consist of three parts. The first section analyzes the temperature profile and superficial velocity of the pilot scale gasifier. The second part discusses the sample syngas composition data that was obtained at temperatures of 950F (510 C) and 1050 F (565 C). The third section of the results discusses the SEM and BET test that were carried on the bio- char produced by the large- scale gasifier. 3.1 Gasification temperature profile and superficial velocity To study the gasification temperature in the gasifier, a probe containing three thermocouples was inserted from the top of the gasifier. This probe is adjustable in the vertical direction and as such can be moved through different heights and gasification zones within the gasifier. At steady state, the following temperature curve was observed [29]
48 36 Figure 3.1 : Temperature profile in the UI's pilot- scale Gasifier [29] The drying zone in a gasifier ranges from 150 to 300 degrees Celsius. Thus the zone above (first two points) represents the drying zone at the top of the gasifier where most of the moisture present in corn grains is removed. Just below the drying zone is the combustion and the pyrolysis zone. Due to the air entering from the top, there is a substantial temperature increase to 1000 degrees. As the fuel moves downwards, the amount of air reduces. Below the combustion and gasification zone is the reduction zone. Here most of the tar produced is broken down due to thermal
49 37 cracking. For this reason, the Oakdale pilot scale gasifier produces very little tar. The char residence time in the gasifier can vary from 30mins to an hour. Superficial velocity (hearth load) of a gasifier is one of the most important measure of a gasifier s performance, controlling gas production rate, gas energy content, fuel consumption rate, power output, and tar production rate [15]. Superficial Velocity = gas production rate cross sectional area The superficial velocity at which the results where collected is calculated to be 0.14m/s. According to book Gangas by G.V a practical acceptable for the superficial velocity in a gasifier ranges from 0.8 m/s to 2.5 m/s. At 0.8m/s high level of tar is usually observed. The superficial velocity from the Oakdale pilot- scale gasifier was found to be in the middle of the above- mentioned range [15]. 3.2 Gas evolution production and measurement The measurements of gas were carried at two parameters; at 950 F (510 Celsius) and 1050 F (565 Celsius)(syngas temperature). The syngas was collected from the tube connecting the gasifier and the boiler. The operation airflow rate ( in CFM) was (0.08 cubic meter/second )and the syngas flow rate was 242 CFM (0.11 cubic meter/second ). Table 3.1 shows the operation parameters under which these tests were carried.
50 38 Table 3.1: Gasifier operation parameters at 950F Temperature of 950F (510 Celsius ) Air Flow Rate (CFM) (0.08m 3 /s) Gasifier Pressure (WC) 0.12 (29kg/ms 2 ) Syngas flow rate (CFM) (0.11m 3 /s) Gas Temperature (F) 950 (510 C) Fuel feeding Rate (lbs/hour) (22-45 kg) At these parameters syngas was obtained and tested in a gas chromatography. The following syngas compositions were observed. Table 3.2: Syngas composition at 950F 950 F (510 Celsius ) Hydrogen 2.86% Oxygen 1.66% Nitrogen 65.02% Methane 1.41% Carbon Monoxide 10.83% Carbon Dioxide 13.81% A second set of results was obtained at a higher temperature. Figure 3.3 shows the parameters at which this data was obtained.
51 39 Table 3.3 : Gasifier operations at 1050F Temperature of 1050F (565 C) Air Flow Rate (CFM) 160 (0.075m 3 /s) Gasifier Pressure (WC) 0.12 (29kg/ms 2 ) Syngas flow rate (CFM) (0.128m 3 /s) Gas Temperature (F) 1050 (565 C) Fuel feeding Rate (lbs./hour) (22-45 kg) Table 3.4 : Syngas composition at 1050F 1050 F Hydrogen 3.93% Oxygen 1.16% Nitrogen 61.79% Methane 1.95% Carbon Monoxide 13.76% Carbon Dioxide 13.42% An increase in temperature from 950F to 1050F (510C to 565C) led to a 12.2% increase in syngas production. This coincides with Carters claim that increase in temperature leads to a higher syngas production. An increase in temperature
52 40 from 510 C to 565 C led to increase in hydrogen, carbon dioxide and methane by 37.4%, 27.1% and 38.3% respectively. However a decrease in oxygen and carbon dioxide by 4.2% and 2.8% was observed. The increase in H2, CO and CH4 are due to the reactions taking place in the reduction zone (Bourdouad s reaction). The reactions at this zone are exothermic, and as such the resulting gases H2, CO and CH4 have a greater concentration at 565 C. 3.3 Bio char analysis The bio char and ash was collected in an outlet bin. The char was separated from the ash. Table 3.5 : Ultimate analysis of biochar Corn Bio char %Moisture %Volatile Matter % Ash % Fixed Carbon Table 3.6 : Proximate analysis of biochar Corn Bio Char %Carbon %Nitrogen % Hydrogen % Sulphur
 analysis provides a precise specific surface evaluation of materials by gas multilayer adsorption.")
53 41 The amount of Sulphur present in char was less than detectable. Section 3.4 compares this data to that of other char from different biomasses. BET analysis Brunauer- Emmert- Teller (BET) analysis provides a precise specific surface evaluation of materials by gas multilayer adsorption. A Nova 4200 instrument was used to calculate the specific area of the bio char. In a Nova 4200, nitrogen adsorption method was used. The degassing temperature of 150 Celsius and degassing time of 10 hours was set. A surface area of 2.38 m 2 /g was calculated. The specifications of these tests can be seen in appendix B. SEM analysis The bio char produced has the same oval shape as corn, the fuel. To better understand the structure of the char produced, scanning electron microscope (SEM) analyses was carried out to study the inner and outer surface of the char. Figure 3.2 : Outer layer of biochar under a magnification of X30

54 42 Figure 3.2 represents the outer section of a corn kernel biochar. This image was obtained at a magnification of x30 and at dimensions of 1.00 mm. We can observe a number of pores but not all the pores and the respective dimensions can easily be identified. Figure 3.3 : Outer layer of biochar at a magnification of X100 When zoomed in at a larger scale and at dimensions of 500micrometers as shown in figure 3.3, the pores are more visible. These pores in the outer layer of the bio char range from 250 micrometers to 2000 micrometers.


55 43 Figure 3.4 : Inner view of bio- char at a magnification of X30 When the bio- char is cracked, the interior view can be seen in figure 3.2. It is noticed that the interior has a larger number of pores compared to the outer layer. A more zoomed in view can be seen in figure 3.5 and figure 3.6 Figure 3.5 : Interior view of the bio char at a magnification of X100

56 44 Figure 3.6 : Interior view of the bio- char at a magnification of X100 Both figure 3.5 and 3.6 represent the inner core view of the bio- char at the same magnification of x100 but at different locations. It is observed that inner core of the bio- char has a larger range of pore dimensions compared to the outer layer. The pores sizes in the inside vary from 150 to 4000 micrometer. Other char pictures at the same conditions can be seen in appendix C. 3.4 Comparison results to other studies In this section, we shall be comparing the three results: temperature profile in the gasifier, gas evolution and char data with studies done in other universities.

57 45 Temperature profile Figure 3.7 : Reed's temperature profile in a downdraft gasifier Figure 3.8 : Mckendry downdraft temperature profile

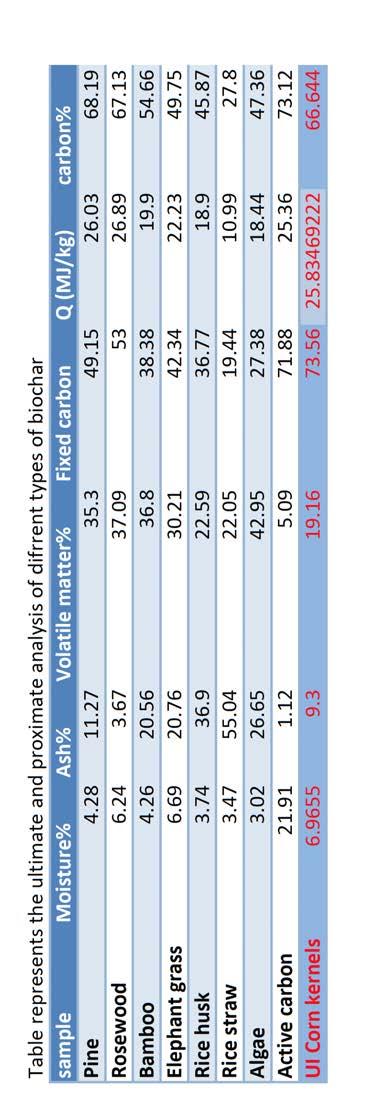
58 46 The temperature profiles obtained by Reed and Mckendry have a similar pattern to that obtained at the university of Iowa pilot scale gasifier. The outlet gas in Reed s gasifier exits at a temperature of 1000 degrees Celsius while that of Mckendry exits at approximately 750 degrees. The gas outlet temperature in our gasifier is 600 degrees Celsius. As we measure the temperature within the gasifier further away from the bottom, a sharp increase in temperature is observed. In Reed s gasifier this reaches to about 1400 degrees Celsius. In Mckendry, the maximum temperature obtained is 1200 degrees Celsius while maximum temperature obtained in our gasifier was 1050 degrees Celsius. Our gasifier has the potential of going as high as 1500, but due to overheating the conditions are kept to 1000 degrees Celsius. We hope to break this barrier in future tests. It s important to note that the Reed s and the UI s gasifier have a similar design. Both gasifiers have biomass and air entering from the top while in Mckendry s design; only the biomass is inserted from the top and air/oxygen is inserted from the side. Bio char comparison Table 3.7 : Biochar ultimate and proximate analysis comparison [10]


59 47 The char produced at the Oakdale gasifier is most similar to activated carbon. Both have a high heating value (HHV) of about 25 MJ/kg. The amount of Sulphur present in both is less than detectable. The amount of fixed carbon present is very similar as well. Activated carbon can widely be used as an adsorbent, catalyst and catalyst support for many reactions [20]. A larger and detailed version of table 3.6 can be found in appendix C. In other experimental systems the biomass is usually crushed in powder form before been inserted in the gasifier. As such the char they produce is different in structure than the one produce at the Oakdale. An advantage of our gasifier is that little or no biomass processing is required before been inserted into the gasifier. Figure 3.9 : Outer layer of powder biochar Figure 3.10 : Interior layer of powder biochar
60 48 In powder biomass, it is observed that powder biomass is not as porous as the bio- char produced at the Oakdale s gasifier. The bio- char produced at the University of Iowa can be used as a fertilizer. This is primarily due its porosity. The pores present in the char can absorb nutrients in the soil. This same effect cannot be seen in other powder bio char since they contained very little pores.
61 49 Chapter 4 : CONCLUSION AND FUTURE WORK 4.1 Conclusions Three main gasification aspects were analyzed from the University of Iowa Oakdale Power Plant gasifier: the temperature profile within the down draft gasifier, sample gas composition at 950 F (510 C) and 1050F (565C), and bio char quality. The temperature profile matched prior experiments that had been carried out using a downdraft gasifier. The temperature obtained followed a similar trend suggest similar gasification zones. Syngas samples were obtained and analyzed at 950 F and 1050 F. The syngas production at 1050 F was 12.2% higher than that at 950 F. The gas compositions at 1050 F were as follows: 3.9% H2, 1.16% O2, 61.79% N2, 1.95% CH4, 13.76% CO and 13.42% CO2. Ultimate and proximate analysis, scanning electron microscopy (SEM), and BET Surface area analysis were carried out on the bio char produced by the gasifier. It was observed that the mount of pores increased due to high temperature. It was also observed that char produced using the UI gasifier had more and larger pores and were larger than that of powder char produced by other gasifying systems. Due to the number and size of the pores, the UI bio char could act as a good soil amendment and such could potentially help farmers with poor soil. Further soil testing will have to be done to fully confirm this. The ultimate and proximate analysis results of corn bio char were compared with char analysis results from other biomasses. It was found that the properties of corn char were most similar to activated carbon..
62 Future work The University of Iowa pilot scale gasifier is fairly new; it has been running for the past three years. So far, the team has been able to fully understand the different parameters and components associated with the gasifier through trial and error, along with their effect on the overall system. For example, the gasification team had to replace the chute of the gasifier due to overheating, and recently, the damper through which air flows was also replaced because its sides were melting. Despite these nuances, the team obtained data on biomasses such as corn, and has understood the temperature profile within the gasifier. The team is working towards introducing new biomasses, and carrying test at various equivalence ratios and superficial velocities. The University of Iowa just approved the construction of a new power plant, which will be completed in the next two years. This plant is expected to be operational in the next four years. Part of the fuel in the power plant will be biomass. As such, the power plant is looking at using Miscanthus, oat hulls and wood chips as potential biomasses. The team would like to test these different biomasses at the Oakdale pilot- scale gasifier so as to better help the University with this initiative. The Oakdale pilot scale gasifier can run two or more types of different biomasses at the same time. The team would also like to try Miscanthus of different densities and sizes, and possibly combine it with other biomasses for hybrid biomass analysis. Furthermore, energy companies such as Independence Energy LLC based in Des Moines are planning on using the UI downdraft gasifier technology to process
63 51 trash in developing countries. Their main goal is to feed processed trash into the downdraft gasifier. The syngas produced will go through a boiler where the gas will be burnt to generate steam and will produce electricity using a turbine generator. They will be carrying out this project in Tanzania, Belize and in Brazil. The gasification team would like to make fake trash (a mixture of paper, wood and other materials) to study the feasibility of such an endeavor in the UI gasifier.
64 52 Appendix A: Equipment list [25] Details on the University of Iowa Pilot scale gasifier located at Oakdale Ag Bio-Power (ABP Model B2-2.5MM Btu, 45.5 dia. x tall): Exterior canister (.25 mild steel, 44 dia. x 60 tall) Air/fuel intake cap (.25 mild steel, 24 dia x 15.5 tall) Instrument ports above reaction zone (four ½ NPT female) High-temp removable 3 sight glass (top-mounted) Four-leg stand (4x4x0.5 angle attached, 26 tall to canister) Shaft-mounted turntable (.37 stainless, dia. x 6.5 wall) Vertical driveshaft (1.25 dia. x 74.5 ) Turntable drive gear-motor (Dayton 2H618) Top-mounted adjustable firetube (refractory 24.5 idia 28.5 odia.) Firetube mount shell (.25 mild steel x 47.5 ) Ash/Char removal auger (4 x 120 ) & tray Auger drive gear-motor (Dayton 2Z817) Airlock (Meyer 4x4 HDX) Spockets, chains, mounts, and idlers, as required Removable Insulating safety jacket w/embossed metal skin (max 130º OST) High-temp paint (basic machine gray) Control Devices and Instrumentation: (1) Wall Mounted, NEMA 4, 36 T x 32 W x 10 D disconnect enclosure containing the following: - (2) Allen Bradley PowerFlex 70 VFD s with Safe- Off option & Line Reactors for the primary & secondary fuel to Gasifier Augers, with reversible drive capability. - (4) Motor Starters for Gasifier Platter Drive, Char/Ash Auger, Primary Fuel Flexible Auger, & Secondary Fuel Flexible Auger. - All terminals, fuses, and circuit breakers needed to control the enclosed devices. (1) Wall Mounted (2) Door, NEMA 4, 36 T x 60 W x 12 D enclosure containing the following: - (1) Allen Bradley ControlLogix PLC(1) - (1) Allen Bradley Panelview 1500 Color HMI - (1) Mushroom head E- Stop button and flush E- Stop reset button. - (1) Horn to indicate critical alarms - All terminals and power supplies needed to control the Gasifier. (1) Remote Thermocouple Termination Enclosure for terminating Data Acquisition thermocouples. (2) Load Cell Summing enclosures for weighing of Primary and Secondary Metering Bins. To be located near Metering Bins.
65 53 (1) ABM Guided Wave Radar Level Transmitter for Gasifier Chamber level control (1) Air Monitor (air flow) sensor for combustion air intake. (6) Allen Bradley Capacitive Proximity Switches for Metering Bin level control. (1) 8 Control Damper and Modulating Actuator for combustion air intake to Gasifier. Damper seals rated to 400 Deg F. (1) Johnson Gas (natural gas) adjustable power burner (#321) fuel igniter for gasifier (top mounted, 1 natural gas feed, electric flame ignition, fault monitor, Fireye brand flame safeguard) Pressure reduction valves, piping, and venting to reduce 120 psi natural gas delivered to the gasifier ignition system at maximum of ½ psi max, 100 CFM Electrically modulated air intake damper at gasifier air inlet controlled by Ag Bio-Power s Allen Bradley controller. Allen Bradley communications module to communicate with Oakdale control system Syngas Handling Equipment Pipe from Ag Bio-Power gasifier to Hurst boiler (24 ga.,10 dia. stainless, 15 maximum length) Removable insulation (max 130º OST, embossed metal) Instrument ports (two ½ NPT female) Couplings, sealant, supports, as required, up to Hurst-Boiler-provided shutoff valve.
66 Appendix B : SEM analysis of the char from UI gasifier and that from 54
67 55
68 Appendix C: Ultimate and proximate analysis of Bio char 56
69 57

 SCALE: 500micrometer")
70 58 Exterior of view of bio- char Exterior of view of bio- char at S4800, 2.0 KV X30 SE(M) SCALE: 1mm Exterior of view of bio- char at S4800, 2.0 KV X100 SE(M) SCALE: 500micrometer

")
71 59 Interior view of biochar at S4800, 2.0 KV X30 SE(M) SCALE: 1mm Interior view of biochar at S4800, 2.0 KV X100 SE(M) SCALE: 500 micrometer
 SCALE: 500micrometer")
72 Interior view of biochar at S4800, 2.0 KV X100 SE(M) SCALE: 500micrometer 60