Effects of Agricultural Land Use on Water Quality at the Watershed Scale
|
|
|
- Emily Harrison
- 5 years ago
- Views:
Transcription
1 Effects of Agricultural Land Use on Water Quality at the Watershed Scale Julia D. Friedmann, Charnsmorn R. Hwang, Jon E. Schoonover, Karl W.J. Williard Department of Forestry Southern Illinois University Carbondale
2 Outline Introduction Objectives Past Research Importance of Research Study Area Methods Results Conclusions Future Research Acknowledgements
 pollution Water quality issues not contained to a field scale, Gulf of Mexico Hypoxia Photo by J.")
3 Introduction 45% of streams are impaired (US EPA 2007) Agricultural activities top cause of impairment Non-point source (NPS) pollution Water quality issues not contained to a field scale, Gulf of Mexico Hypoxia Photo by J. Friedmann
4 Objectives Determine how agricultural land cover affects baseflow and stormflow: Total Suspended Solids (TSS) Nutrients (orthophosphate and nitrate) Escherichia coli Determine how percent canopy cover within a 10, 30, and 50 m buffer affects baseflow and stormflow: Total Suspended Solids (TSS) Nutrients (orthophosphate and nitrate) E. coli
5 Past Research Landscape influence (Johnson et al. 1997) Seasonal difference (TN, ammonium, nitrate, phosphate) Row crop dominant landscape factor explaining variability Landscape metrics % Ag and % Forest (Jones et al. 2001) Consistently explained variation (nitrogen, phosphorus, and sediment) Riparian forest most important for phosphorus Watershed land cover and size (King et al. 2005) % cropland positively correlated with nitrate-n % forest negatively correlated with nitrate-n

6 Importance of Research Past research at field scale Best management at watershed scale Assess multiple landscape characteristics Better understanding of water quality impairments, NPS pollution TMDLs Photo by J. Friedmann

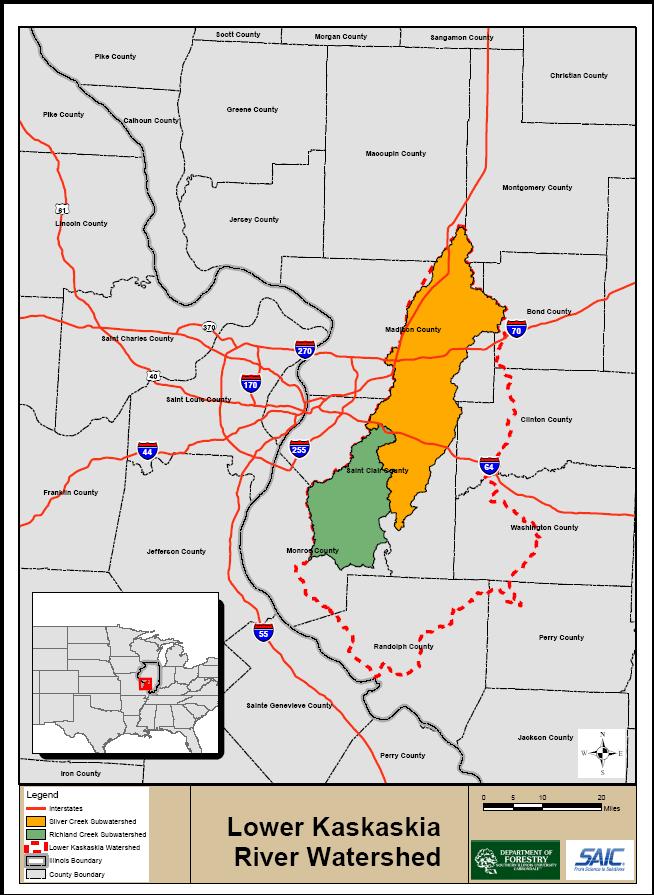
7 Study Area
8 Agriculture Land Cover 19 watersheds Photo by C Hwang


9 Rural Community 21 watersheds Photo by J. Friedmann
10 Urban 4 watersheds Photo by C. Hwang
11 Total Monthly Precipitation (Scott Airforce Base-Belleville) Total Precipitation (in) Jan Feb March April May June July Aug Sept Oct Nov Dec Month 30 Year Average 2008

 Photo by J.")
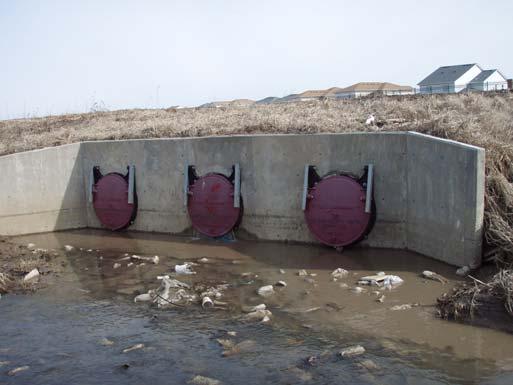
12 Field Methods Photo by J. Friedmann Twice a month (January-July) Once a month (August-September) Photo by J. Friedmann

13 Field Methods Photo by J. Schoonover
 Orthophosphate Ammonium IDEXX and mfc Agar Total coliform-idexx Fecal coliform-mfc mfc E. coli-idexx Photo by C.")
14 Lab Methods Water Quality Lab Analysis Vacuum Filtration Total Suspended Solids Ion chromatography (filtered) Nitrate Sulfate Chloride Spectrophotometer (filtered) Orthophosphate Ammonium IDEXX and mfc Agar Total coliform-idexx Fecal coliform-mfc mfc E. coli-idexx Photo by C. Slemp

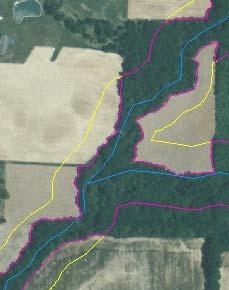
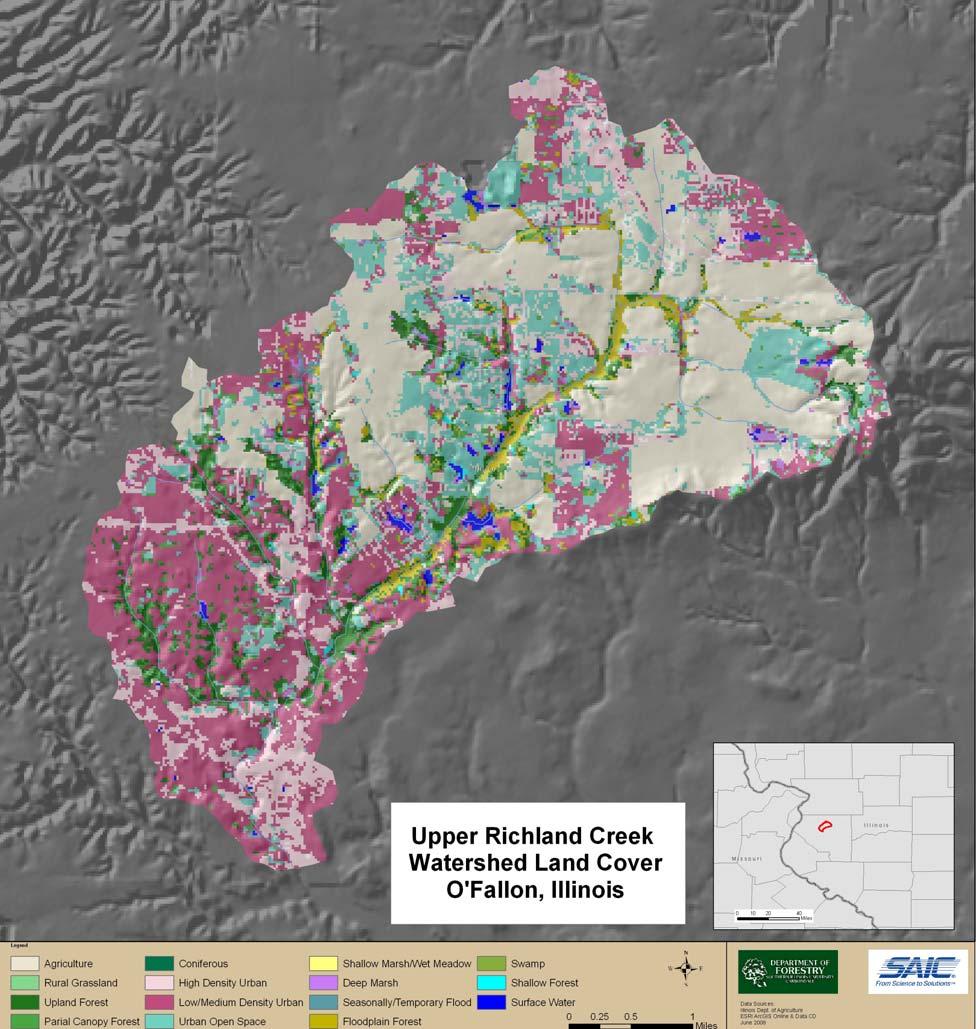
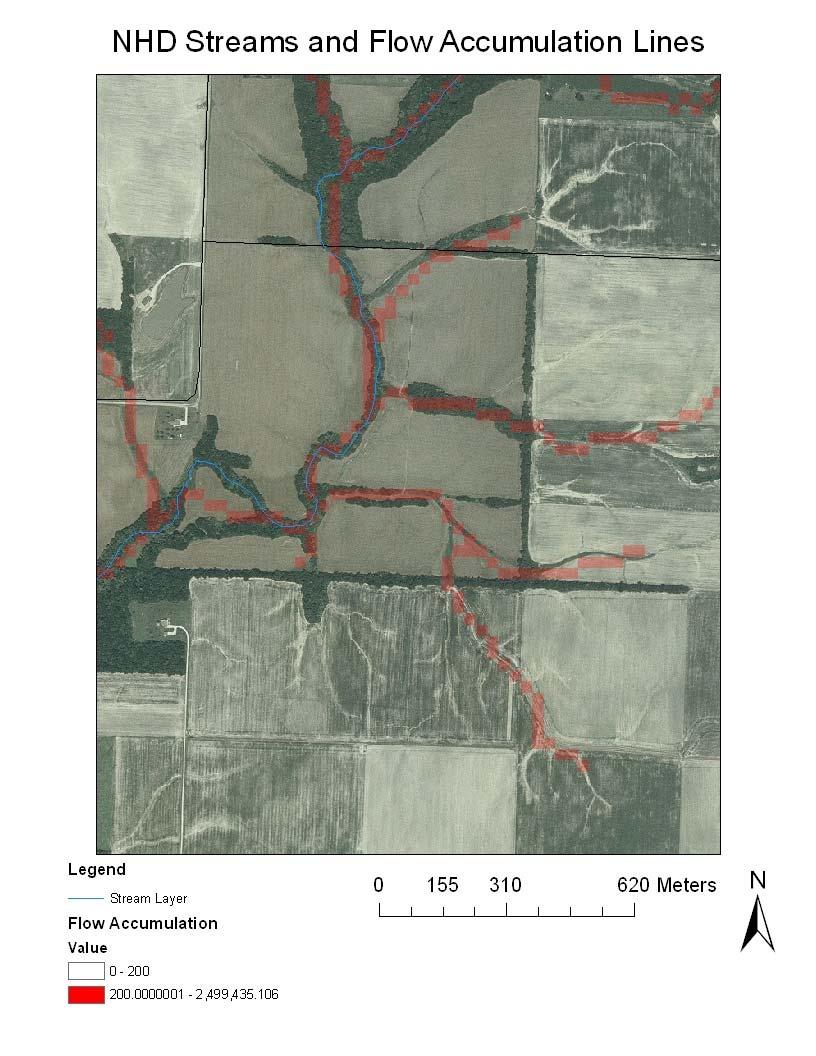
15 GIS Methods
16 GIS Results Percent Canopy Cover Descriptive Statistics 10 m Buffer (%) 30 m Buffer (%) 50 m Buffer (%) Min Max Mean S.E
17 Spearman s s Correlation Matrix Agriculture Baseflow Stormflow * Significant at 0.10 Parameter 10 m Buffer 30 m Buffer 50 m Buffer NO3 PO4 TSS E. Coli NO3 PO4 TSS E. Coli r = p = r = p = r = p = r = p = r = p = r = p = r = p =.887 r = p = r = p = r = p = r = p = r = p = r = p = r = p = r = p = r = p = r = p = r = p = r = p = 0.16 r = p = r = p = r = p = r = p = r = p =
18 Spearman s s Correlation Matrix Rural Community Baseflow Stormflow * Significant at 0.10 Parameter 10 m Buffer 30 m Buffer 50 m Buffer NO 3 -N r = p = PO 4 r = p = TSS E. Coli NO 3 -N r = p = r = p = r = p = PO 4 r = p = TSS E. Coli r = p = r = p = r = p = r = p = r = -0.1 p = r = p = r = p = r = p = r = p = r = p = r = p = r = p = r = p = r = p = r = p = r = p = r = p = r = p = 0.464
19
20 Results Nitrate-N 0.8 Concentration (mg L -1 ) Agriculture Rural Community Urban Dominant Land Cover Baseflow Stormflow
21 Orthophosphate Concentration (mg L -1 ) Agriculture Rural Community Urban Dominant Land Cover Baseflow Stormflow
22 Total Suspended Soilds (TSS) 400 Concentration (mg L -1 ) Agriculture Rural Community Urban Dominant Land Cover Baseflow Stormflow
23 E. Coli Most probable number (MPN) Agriculture Rural Community Urban Dominant Land Cover Baseflow Stormflow

24 Conclusions Nitrate levels low No difference among sites Orthophosphate levels high Septic systems, fertilizer leaching Slightly negative relationship between % canopy cover TSS from urban and rural communities possibly coming from channel scouring E. coli levels high during stormflow Slight negative relationship between % canopy cover Photo by J. Friedmann
25 Future Research Continue data collection Enhanced stream layer Landscape metrics (gap length, gap frequency, 1 st vs. 2 nd order streams) Tile drainage information Stormwater sampling Further analysis of correlations (season, % agriculture, etc.)
26 Acknowledgements United States Department of Agriculture (USDA) Dr. Mae Davenport Anthony Caselton Jackie Crim Mike Martinek William Beck